The global alloy wheels market revolves around the manufacturing and distribution of wheels made from metal alloys, primarily aluminum and magnesium. Alloy wheels are favored over traditional steel wheels due to their lighter weight, superior heat conduction, and aesthetic appeal. These characteristics contribute to improved vehicle performance, fuel efficiency, and enhanced handling. Due to their lightweight nature, alloy wheels are predominantly used in passenger vehicles rather than commercial vehicles, which require higher load-bearing capacity.
Market Size
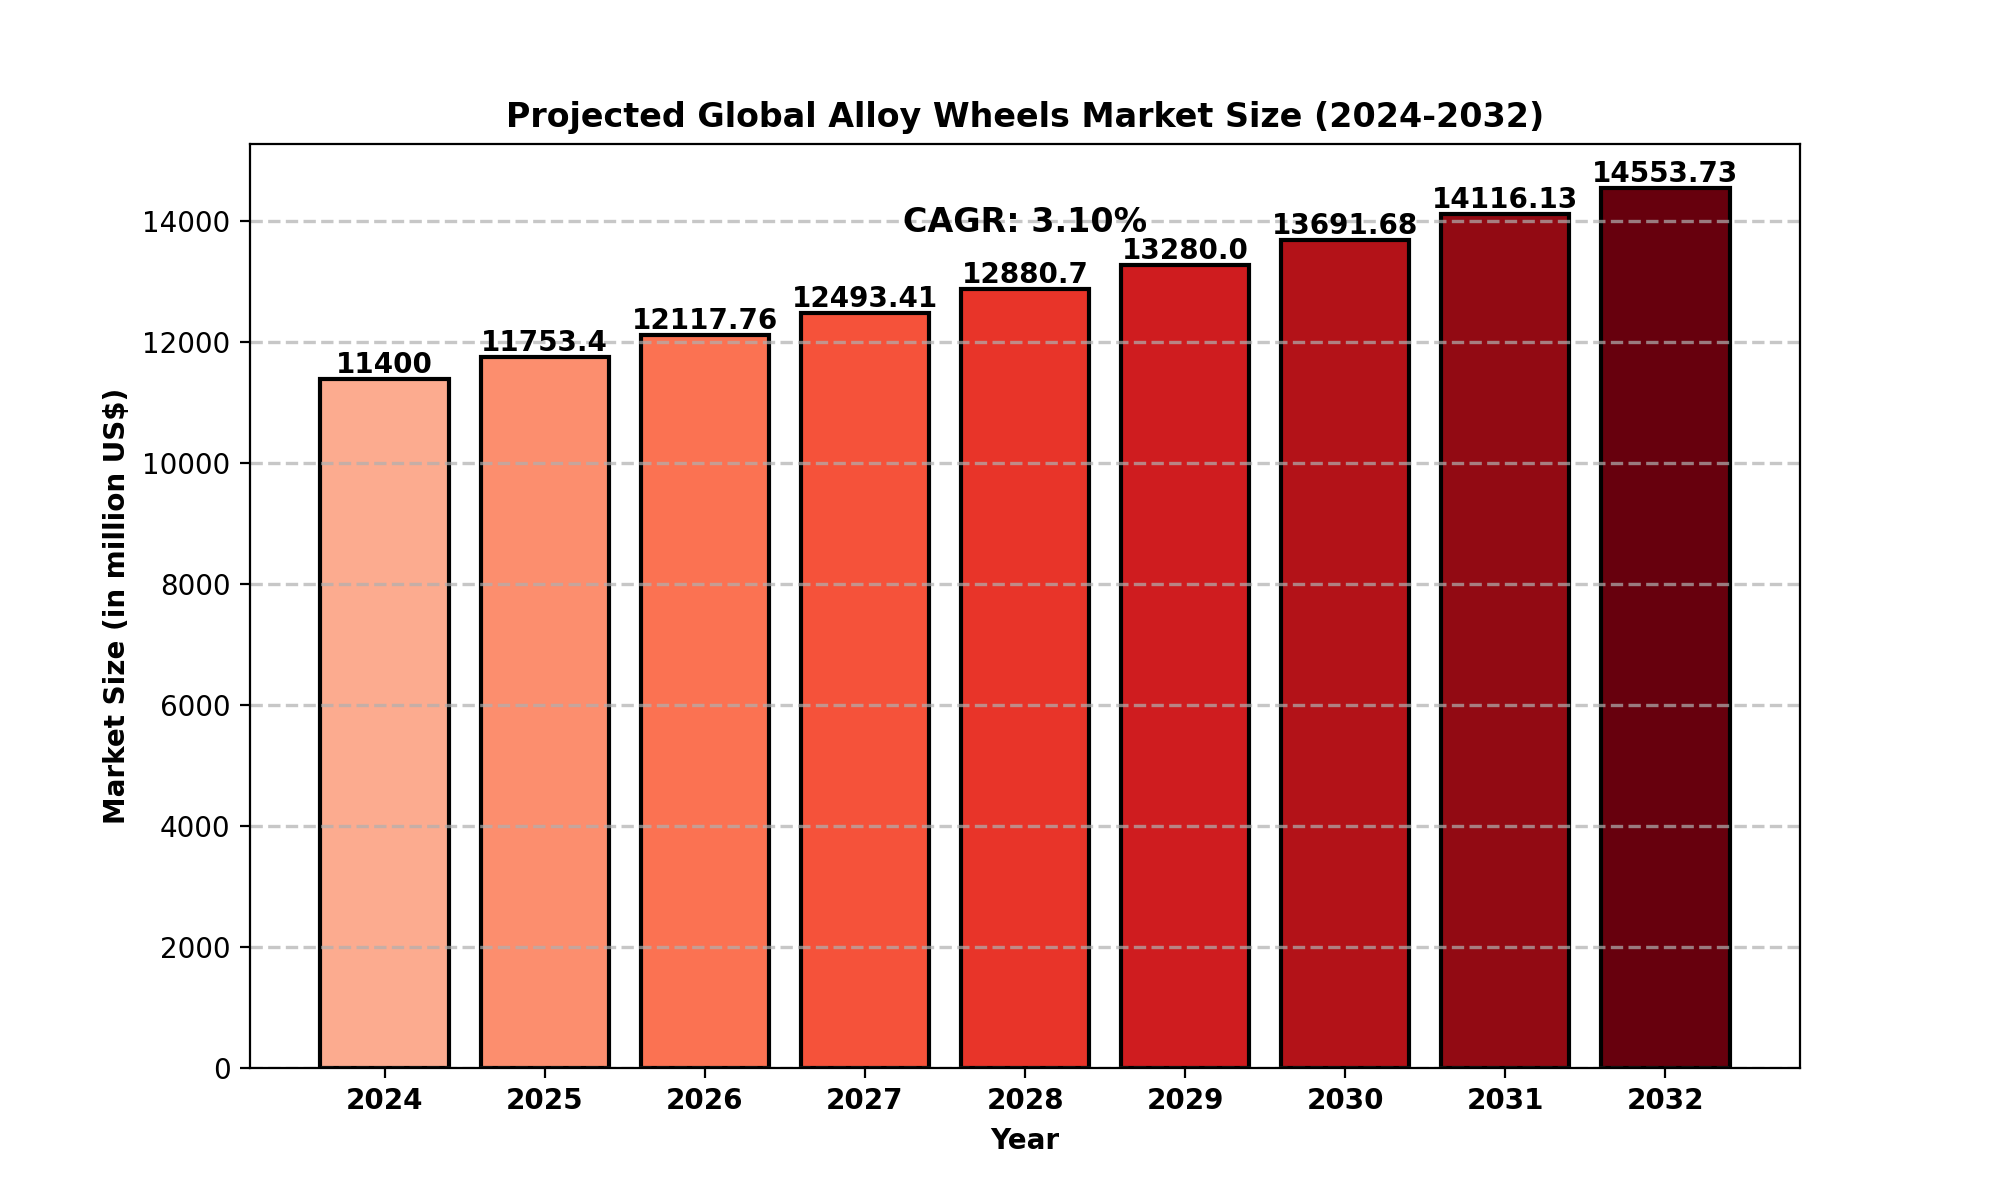
As of 2024, the global alloy wheels market is valued at approximately USD 11.4 billion and is projected to grow to USD 14.55 billion by 2032, reflecting a CAGR of 3.10% during the forecast period.
The North American alloy wheels market alone is valued at USD 3.13 billion in 2024, with an estimated CAGR of 2.66% from 2025 to 2032.
The growing demand for high-performance vehicles, coupled with advancements in wheel manufacturing technologies, is driving market expansion. Additionally, increasing consumer preference for customized wheels and the rising trend of electric vehicles (EVs) are contributing to the steady market growth.
Market Dynamics (Drivers, Restraints, Opportunities, and Challenges)
Drivers
-
Increased Vehicle Production: The global automobile industry is witnessing a steady rise in production, leading to higher demand for alloy wheels.
-
Lightweight and Fuel Efficiency Benefits: The lower weight of alloy wheels contributes to improved vehicle performance and fuel efficiency, encouraging automakers to adopt them.
-
Aesthetic Appeal: The stylish appearance of alloy wheels makes them a preferred choice among car enthusiasts and premium vehicle manufacturers.
-
Growing Aftermarket Sales: Rising consumer interest in vehicle customization has boosted demand in the replacement and aftermarket segments.
Restraints
-
Higher Cost Compared to Steel Wheels: Alloy wheels are more expensive to manufacture, making them less accessible for budget-conscious consumers.
-
Durability Concerns: While alloy wheels offer better performance, they are more prone to cracks and bends under extreme conditions compared to steel wheels.
Opportunities
-
Rise in Electric Vehicles (EVs): As EVs gain popularity, lightweight materials like alloy wheels are expected to see increased adoption to enhance battery efficiency.
-
Innovations in Manufacturing Techniques: Advancements in forging and casting technologies are likely to reduce production costs and improve wheel strength.
Challenges
-
Fluctuating Raw Material Prices: The prices of aluminum and magnesium, key components of alloy wheels, are subject to market fluctuations, impacting profitability.
-
Environmental Concerns: Manufacturing processes of alloy wheels generate emissions, raising concerns over sustainability.
Regional Analysis
North America
-
Estimated Market Size in 2024: USD 3.13 billion
-
Key Drivers: High consumer demand for luxury and performance vehicles, strong aftermarket sales.
-
Leading Countries: USA, Canada, Mexico.
Europe
-
Strong presence of premium car manufacturers driving demand for alloy wheels.
-
Leading Countries: Germany, UK, France, Italy.
Asia-Pacific
-
Largest regional market, driven by increasing automobile production in China, Japan, and India.
-
Rapid urbanization and rising disposable income fueling demand.
South America & Middle East/Africa
Competitor Analysis
Key Companies
Market Segmentation (by Type)
-
Casting: Most commonly used manufacturing process due to cost efficiency.
-
Forging: Produces stronger and lighter wheels, preferred for high-performance vehicles.
-
Other: Includes hybrid methods and innovative material combinations.
Market Segmentation (by Application)
-
Passenger Vehicles: Largest segment, driven by consumer preference for stylish and performance-enhancing wheels.
-
Commercial Vehicles: Limited adoption due to the higher durability requirements for heavy-duty usage.
Geographic Segmentation
-
North America: USA, Canada, Mexico.
-
Europe: Germany, UK, France, Italy, Russia.
-
Asia-Pacific: China, Japan, South Korea, India, Southeast Asia.
-
South America: Brazil, Argentina, Colombia.
-
Middle East & Africa: Saudi Arabia, UAE, South Africa, Nigeria.
Emerging Trends
-
Adoption in Electric Vehicles (EVs): Lightweight alloy wheels contribute to improved EV range and efficiency.
-
3D Printing in Wheel Manufacturing: Potential for customized designs and enhanced durability.
-
Sustainable Production Methods: Increasing focus on environmentally friendly materials and processes.
FAQs
What is the current market size of the alloy wheels industry?
- The global alloy wheels market is valued at approximately USD 11.4 billion in 2024 and is projected to reach USD 15.00 billion by 2032.
Which are the key companies operating in the alloy wheels market?
- Some of the major players include CITIC Dicastal, Borbet, Ronal Wheels, Howmet Aerospace, and Superior Industries.
What are the key growth drivers in the alloy wheels market?
- The market is primarily driven by increased vehicle production, fuel efficiency benefits, aesthetic appeal, and a growing aftermarket segment.
Which regions dominate the alloy wheels market?
- Asia-Pacific leads in production and demand, followed by North America and Europe.
What are the emerging trends in the alloy wheels market?
- Trends include increased adoption in EVs, advancements in forging techniques, and rising demand for customized wheels in the aftermarket.
Key Benefits of This Market Research:
- Industry drivers, restraints, and opportunities covered in the study
- Neutral perspective on the market performance
- Recent industry trends and developments
- Competitive landscape & strategies of key players
- Potential & niche segments and regions exhibiting promising growth covered
- Historical, current, and projected market size, in terms of value
- In-depth analysis of the Alloy Wheels Market
- Overview of the regional outlook of the Alloy Wheels Market:
Key Reasons to Buy this Report:
- Access to date statistics compiled by our researchers. These provide you with historical and forecast data, which is analyzed to tell you why your market is set to change
- This enables you to anticipate market changes to remain ahead of your competitors
- You will be able to copy data from the Excel spreadsheet straight into your marketing plans, business presentations, or other strategic documents
- The concise analysis, clear graph, and table format will enable you to pinpoint the information you require quickly
- Provision of market value data for each segment and sub-segment
- Indicates the region and segment that is expected to witness the fastest growth as well as to dominate the market
- Analysis by geography highlighting the consumption of the product/service in the region as well as indicating the factors that are affecting the market within each region
- Competitive landscape which incorporates the market ranking of the major players, along with new service/product launches, partnerships, business expansions, and acquisitions in the past five years of companies profiled
- Extensive company profiles comprising of company overview, company insights, product benchmarking, and SWOT analysis for the major market players
- The current as well as the future market outlook of the industry concerning recent developments which involve growth opportunities and drivers as well as challenges and restraints of both emerging as well as developed regions
- Includes in-depth analysis of the market from various perspectives through Porter
TABLE OF CONTENTS
Table of Contents
1 Research Methodology and Statistical Scope
1.1 Market Definition and Statistical Scope of Alloy Wheels
1.2 Key Market Segments
1.2.1 Alloy Wheels Segment by Type
1.2.2 Alloy Wheels Segment by Application
1.3 Methodology & Sources of Information
1.3.1 Research Methodology
1.3.2 Research Process
1.3.3 Market Breakdown and Data Triangulation
1.3.4 Base Year
1.3.5 Report Assumptions & Caveats
1.4 Key Data of Global Auto Market
1.4.1 Global Automobile Production by Country
1.4.2 Global Automobile Production by Type
2 Alloy Wheels Market Overview
2.1 Global Market Overview
2.1.1 Global Alloy Wheels Market Size (M USD) Estimates and Forecasts (2019-2032)
2.1.2 Global Alloy Wheels Sales Estimates and Forecasts (2019-2032)
2.2 Market Segment Executive Summary
2.3 Global Market Size by Region
3 Alloy Wheels Market Competitive Landscape
3.1 Global Alloy Wheels Sales by Manufacturers (2019-2025)
3.2 Global Alloy Wheels Revenue Market Share by Manufacturers (2019-2025)
3.3 Alloy Wheels Market Share by Company Type (Tier 1, Tier 2, and Tier 3)
3.4 Global Alloy Wheels Average Price by Manufacturers (2019-2025)
3.5 Manufacturers Alloy Wheels Sales Sites, Area Served, Product Type
3.6 Alloy Wheels Market Competitive Situation and Trends
3.6.1 Alloy Wheels Market Concentration Rate
3.6.2 Global 5 and 10 Largest Alloy Wheels Players Market Share by Revenue
3.6.3 Mergers & Acquisitions, Expansion
4 Alloy Wheels Industry Chain Analysis
4.1 Alloy Wheels Industry Chain Analysis
4.2 Market Overview of Key Raw Materials
4.3 Midstream Market Analysis
4.4 Downstream Customer Analysis
5 The Development and Dynamics of Alloy Wheels Market
5.1 Key Development Trends
5.2 Driving Factors
5.3 Market Challenges
5.4 Market Restraints
5.5 Industry News
5.5.1 New Product Developments
5.5.2 Mergers & Acquisitions
5.5.3 Expansions
5.5.4 Collaboration/Supply Contracts
5.6 Industry Policies
6 Alloy Wheels Market Segmentation by Type
6.1 Evaluation Matrix of Segment Market Development Potential (Type)
6.2 Global Alloy Wheels Sales Market Share by Type (2019-2025)
6.3 Global Alloy Wheels Market Size Market Share by Type (2019-2025)
6.4 Global Alloy Wheels Price by Type (2019-2025)
7 Alloy Wheels Market Segmentation by Application
7.1 Evaluation Matrix of Segment Market Development Potential (Application)
7.2 Global Alloy Wheels Market Sales by Application (2019-2025)
7.3 Global Alloy Wheels Market Size (M USD) by Application (2019-2025)
7.4 Global Alloy Wheels Sales Growth Rate by Application (2019-2025)
8 Alloy Wheels Market Consumption by Region
8.1 Global Alloy Wheels Sales by Region
8.1.1 Global Alloy Wheels Sales by Region
8.1.2 Global Alloy Wheels Sales Market Share by Region
8.2 North America
8.2.1 North America Alloy Wheels Sales by Country
8.2.2 U.S.
8.2.3 Canada
8.2.4 Mexico
8.3 Europe
8.3.1 Europe Alloy Wheels Sales by Country
8.3.2 Germany
8.3.3 France
8.3.4 U.K.
8.3.5 Italy
8.3.6 Russia
8.4 Asia Pacific
8.4.1 Asia Pacific Alloy Wheels Sales by Region
8.4.2 China
8.4.3 Japan
8.4.4 South Korea
8.4.5 India
8.4.6 Southeast Asia
8.5 South America
8.5.1 South America Alloy Wheels Sales by Country
8.5.2 Brazil
8.5.3 Argentina
8.5.4 Columbia
8.6 Middle East and Africa
8.6.1 Middle East and Africa Alloy Wheels Sales by Region
8.6.2 Saudi Arabia
8.6.3 UAE
8.6.4 Egypt
8.6.5 Nigeria
8.6.6 South Africa
9 Alloy Wheels Market Production by Region
9.1 Global Production of Alloy Wheels by Region (2019-2025)
9.2 Global Alloy Wheels Revenue Market Share by Region (2019-2025)
9.3 Global Alloy Wheels Production, Revenue, Price and Gross Margin (2019-2025)
9.4 North America Alloy Wheels Production
9.4.1 North America Alloy Wheels Production Growth Rate (2019-2025)
9.4.2 North America Alloy Wheels Production, Revenue, Price and Gross Margin (2019-2025)
9.5 Europe Alloy Wheels Production
9.5.1 Europe Alloy Wheels Production Growth Rate (2019-2025)
9.5.2 Europe Alloy Wheels Production, Revenue, Price and Gross Margin (2019-2025)
9.6 Japan Alloy Wheels Production (2019-2025)
9.6.1 Japan Alloy Wheels Production Growth Rate (2019-2025)
9.6.2 Japan Alloy Wheels Production, Revenue, Price and Gross Margin (2019-2025)
9.7 China Alloy Wheels Production (2019-2025)
9.7.1 China Alloy Wheels Production Growth Rate (2019-2025)
9.7.2 China Alloy Wheels Production, Revenue, Price and Gross Margin (2019-2025)
10 Key Companies Profile
10.1 CITIC Dicastal
10.1.1 CITIC Dicastal Alloy Wheels Basic Information
10.1.2 CITIC Dicastal Alloy Wheels Product Overview
10.1.3 CITIC Dicastal Alloy Wheels Product Market Performance
10.1.4 CITIC Dicastal Business Overview
10.1.5 CITIC Dicastal Alloy Wheels SWOT Analysis
10.1.6 CITIC Dicastal Recent Developments
10.2 Borbet
10.2.1 Borbet Alloy Wheels Basic Information
10.2.2 Borbet Alloy Wheels Product Overview
10.2.3 Borbet Alloy Wheels Product Market Performance
10.2.4 Borbet Business Overview
10.2.5 Borbet Alloy Wheels SWOT Analysis
10.2.6 Borbet Recent Developments
10.3 Ronal Wheels
10.3.1 Ronal Wheels Alloy Wheels Basic Information
10.3.2 Ronal Wheels Alloy Wheels Product Overview
10.3.3 Ronal Wheels Alloy Wheels Product Market Performance
10.3.4 Ronal Wheels Alloy Wheels SWOT Analysis
10.3.5 Ronal Wheels Business Overview
10.3.6 Ronal Wheels Recent Developments
10.4 Howmet Aerospace
10.4.1 Howmet Aerospace Alloy Wheels Basic Information
10.4.2 Howmet Aerospace Alloy Wheels Product Overview
10.4.3 Howmet Aerospace Alloy Wheels Product Market Performance
10.4.4 Howmet Aerospace Business Overview
10.4.5 Howmet Aerospace Recent Developments
10.5 Superior Industries
10.5.1 Superior Industries Alloy Wheels Basic Information
10.5.2 Superior Industries Alloy Wheels Product Overview
10.5.3 Superior Industries Alloy Wheels Product Market Performance
10.5.4 Superior Industries Business Overview
10.5.5 Superior Industries Recent Developments
10.6 Iochpe-Maxion
10.6.1 Iochpe-Maxion Alloy Wheels Basic Information
10.6.2 Iochpe-Maxion Alloy Wheels Product Overview
10.6.3 Iochpe-Maxion Alloy Wheels Product Market Performance
10.6.4 Iochpe-Maxion Business Overview
10.6.5 Iochpe-Maxion Recent Developments
10.7 Wanfeng Auto
10.7.1 Wanfeng Auto Alloy Wheels Basic Information
10.7.2 Wanfeng Auto Alloy Wheels Product Overview
10.7.3 Wanfeng Auto Alloy Wheels Product Market Performance
10.7.4 Wanfeng Auto Business Overview
10.7.5 Wanfeng Auto Recent Developments
10.8 Lizhong Group
10.8.1 Lizhong Group Alloy Wheels Basic Information
10.8.2 Lizhong Group Alloy Wheels Product Overview
10.8.3 Lizhong Group Alloy Wheels Product Market Performance
10.8.4 Lizhong Group Business Overview
10.8.5 Lizhong Group Recent Developments
10.9 Enkei Wheels
10.9.1 Enkei Wheels Alloy Wheels Basic Information
10.9.2 Enkei Wheels Alloy Wheels Product Overview
10.9.3 Enkei Wheels Alloy Wheels Product Market Performance
10.9.4 Enkei Wheels Business Overview
10.9.5 Enkei Wheels Recent Developments
10.10 Zhejiang Jinfei
10.10.1 Zhejiang Jinfei Alloy Wheels Basic Information
10.10.2 Zhejiang Jinfei Alloy Wheels Product Overview
10.10.3 Zhejiang Jinfei Alloy Wheels Product Market Performance
10.10.4 Zhejiang Jinfei Business Overview
10.10.5 Zhejiang Jinfei Recent Developments
10.11 Accuride
10.11.1 Accuride Alloy Wheels Basic Information
10.11.2 Accuride Alloy Wheels Product Overview
10.11.3 Accuride Alloy Wheels Product Market Performance
10.11.4 Accuride Business Overview
10.11.5 Accuride Recent Developments
10.12 Topy Group
10.12.1 Topy Group Alloy Wheels Basic Information
10.12.2 Topy Group Alloy Wheels Product Overview
10.12.3 Topy Group Alloy Wheels Product Market Performance
10.12.4 Topy Group Business Overview
10.12.5 Topy Group Recent Developments
10.13 Zhongnan Alloy wheels
10.13.1 Zhongnan Alloy wheels Alloy Wheels Basic Information
10.13.2 Zhongnan Alloy wheels Alloy Wheels Product Overview
10.13.3 Zhongnan Alloy wheels Alloy Wheels Product Market Performance
10.13.4 Zhongnan Alloy wheels Business Overview
10.13.5 Zhongnan Alloy wheels Recent Developments
10.14 YHI International Limited
10.14.1 YHI International Limited Alloy Wheels Basic Information
10.14.2 YHI International Limited Alloy Wheels Product Overview
10.14.3 YHI International Limited Alloy Wheels Product Market Performance
10.14.4 YHI International Limited Business Overview
10.14.5 YHI International Limited Recent Developments
10.15 Yueling Wheels
10.15.1 Yueling Wheels Alloy Wheels Basic Information
10.15.2 Yueling Wheels Alloy Wheels Product Overview
10.15.3 Yueling Wheels Alloy Wheels Product Market Performance
10.15.4 Yueling Wheels Business Overview
10.15.5 Yueling Wheels Recent Developments
11 Alloy Wheels Market Forecast by Region
11.1 Global Alloy Wheels Market Size Forecast
11.2 Global Alloy Wheels Market Forecast by Region
11.2.1 North America Market Size Forecast by Country
11.2.2 Europe Alloy Wheels Market Size Forecast by Country
11.2.3 Asia Pacific Alloy Wheels Market Size Forecast by Region
11.2.4 South America Alloy Wheels Market Size Forecast by Country
11.2.5 Middle East and Africa Forecasted Consumption of Alloy Wheels by Country
12 Forecast Market by Type and by Application (2025-2032)
12.1 Global Alloy Wheels Market Forecast by Type (2025-2032)
12.1.1 Global Forecasted Sales of Alloy Wheels by Type (2025-2032)
12.1.2 Global Alloy Wheels Market Size Forecast by Type (2025-2032)
12.1.3 Global Forecasted Price of Alloy Wheels by Type (2025-2032)
12.2 Global Alloy Wheels Market Forecast by Application (2025-2032)
12.2.1 Global Alloy Wheels Sales (K Units) Forecast by Application
12.2.2 Global Alloy Wheels Market Size (M USD) Forecast by Application (2025-2032)
13 Conclusion and Key Findings
LIST OF TABLES & FIGURES
List of Tables
Table 1. Introduction of the Type
Table 2. Introduction of the Application
Table 3. Motor Vehicle Production Market Share by Type (2023)
Table 4. Global Automobile Production by Region (Units)
Table 5. Market Share and Development Potential of Automobiles by Region
Table 6. Global Automobile Production by Country (Vehicle)
Table 7. Market Share and Development Potential of Automobiles by Countries
Table 8. Global Automobile Production by Type
Table 9. Market Share and Development Potential of Automobiles by Type
Table 10. Market Size (M USD) Segment Executive Summary
Table 11. Alloy Wheels Market Size Comparison by Region (M USD)
Table 12. Global Alloy Wheels Sales (K Units) by Manufacturers (2019-2025)
Table 13. Global Alloy Wheels Sales Market Share by Manufacturers (2019-2025)
Table 14. Global Alloy Wheels Revenue (M USD) by Manufacturers (2019-2025)
Table 15. Global Alloy Wheels Revenue Share by Manufacturers (2019-2025)
Table 16. Company Type (Tier 1, Tier 2, and Tier 3) & (based on the Revenue in Alloy Wheels as of 2022)
Table 17. Global Market Alloy Wheels Average Price (USD/Unit) of Key Manufacturers (2019-2025)
Table 18. Manufacturers Alloy Wheels Sales Sites and Area Served
Table 19. Manufacturers Alloy Wheels Product Type
Table 20. Global Alloy Wheels Manufacturers Market Concentration Ratio (CR5 and HHI)
Table 21. Mergers & Acquisitions, Expansion Plans
Table 22. Industry Chain Map of Alloy Wheels
Table 23. Market Overview of Key Raw Materials
Table 24. Midstream Market Analysis
Table 25. Downstream Customer Analysis
Table 26. Key Development Trends
Table 27. Driving Factors
Table 28. Alloy Wheels Market Challenges
Table 29. Global Alloy Wheels Sales by Type (K Units)
Table 30. Global Alloy Wheels Market Size by Type (M USD)
Table 31. Global Alloy Wheels Sales (K Units) by Type (2019-2025)
Table 32. Global Alloy Wheels Sales Market Share by Type (2019-2025)
Table 33. Global Alloy Wheels Market Size (M USD) by Type (2019-2025)
Table 34. Global Alloy Wheels Market Size Share by Type (2019-2025)
Table 35. Global Alloy Wheels Price (USD/Unit) by Type (2019-2025)
Table 36. Global Alloy Wheels Sales (K Units) by Application
Table 37. Global Alloy Wheels Market Size by Application
Table 38. Global Alloy Wheels Sales by Application (2019-2025) & (K Units)
Table 39. Global Alloy Wheels Sales Market Share by Application (2019-2025)
Table 40. Global Alloy Wheels Sales by Application (2019-2025) & (M USD)
Table 41. Global Alloy Wheels Market Share by Application (2019-2025)
Table 42. Global Alloy Wheels Sales Growth Rate by Application (2019-2025)
Table 43. Global Alloy Wheels Sales by Region (2019-2025) & (K Units)
Table 44. Global Alloy Wheels Sales Market Share by Region (2019-2025)
Table 45. North America Alloy Wheels Sales by Country (2019-2025) & (K Units)
Table 46. Europe Alloy Wheels Sales by Country (2019-2025) & (K Units)
Table 47. Asia Pacific Alloy Wheels Sales by Region (2019-2025) & (K Units)
Table 48. South America Alloy Wheels Sales by Country (2019-2025) & (K Units)
Table 49. Middle East and Africa Alloy Wheels Sales by Region (2019-2025) & (K Units)
Table 50. Global Alloy Wheels Production (K Units) by Region (2019-2025)
Table 51. Global Alloy Wheels Revenue (US$ Million) by Region (2019-2025)
Table 52. Global Alloy Wheels Revenue Market Share by Region (2019-2025)
Table 53. Global Alloy Wheels Production (K Units), Revenue (US$ Million), Price (USD/Unit) and Gross Margin (2019-2025)
Table 54. North America Alloy Wheels Production (K Units), Revenue (US$ Million), Price (USD/Unit) and Gross Margin (2019-2025)
Table 55. Europe Alloy Wheels Production (K Units), Revenue (US$ Million), Price (USD/Unit) and Gross Margin (2019-2025)
Table 56. Japan Alloy Wheels Production (K Units), Revenue (US$ Million), Price (USD/Unit) and Gross Margin (2019-2025)
Table 57. China Alloy Wheels Production (K Units), Revenue (US$ Million), Price (USD/Unit) and Gross Margin (2019-2025)
Table 58. CITIC Dicastal Alloy Wheels Basic Information
Table 59. CITIC Dicastal Alloy Wheels Product Overview
Table 60. CITIC Dicastal Alloy Wheels Sales (K Units), Revenue (M USD), Price (USD/Unit) and Gross Margin (2019-2025)
Table 61. CITIC Dicastal Business Overview
Table 62. CITIC Dicastal Alloy Wheels SWOT Analysis
Table 63. CITIC Dicastal Recent Developments
Table 64. Borbet Alloy Wheels Basic Information
Table 65. Borbet Alloy Wheels Product Overview
Table 66. Borbet Alloy Wheels Sales (K Units), Revenue (M USD), Price (USD/Unit) and Gross Margin (2019-2025)
Table 67. Borbet Business Overview
Table 68. Borbet Alloy Wheels SWOT Analysis
Table 69. Borbet Recent Developments
Table 70. Ronal Wheels Alloy Wheels Basic Information
Table 71. Ronal Wheels Alloy Wheels Product Overview
Table 72. Ronal Wheels Alloy Wheels Sales (K Units), Revenue (M USD), Price (USD/Unit) and Gross Margin (2019-2025)
Table 73. Ronal Wheels Alloy Wheels SWOT Analysis
Table 74. Ronal Wheels Business Overview
Table 75. Ronal Wheels Recent Developments
Table 76. Howmet Aerospace Alloy Wheels Basic Information
Table 77. Howmet Aerospace Alloy Wheels Product Overview
Table 78. Howmet Aerospace Alloy Wheels Sales (K Units), Revenue (M USD), Price (USD/Unit) and Gross Margin (2019-2025)
Table 79. Howmet Aerospace Business Overview
Table 80. Howmet Aerospace Recent Developments
Table 81. Superior Industries Alloy Wheels Basic Information
Table 82. Superior Industries Alloy Wheels Product Overview
Table 83. Superior Industries Alloy Wheels Sales (K Units), Revenue (M USD), Price (USD/Unit) and Gross Margin (2019-2025)
Table 84. Superior Industries Business Overview
Table 85. Superior Industries Recent Developments
Table 86. Iochpe-Maxion Alloy Wheels Basic Information
Table 87. Iochpe-Maxion Alloy Wheels Product Overview
Table 88. Iochpe-Maxion Alloy Wheels Sales (K Units), Revenue (M USD), Price (USD/Unit) and Gross Margin (2019-2025)
Table 89. Iochpe-Maxion Business Overview
Table 90. Iochpe-Maxion Recent Developments
Table 91. Wanfeng Auto Alloy Wheels Basic Information
Table 92. Wanfeng Auto Alloy Wheels Product Overview
Table 93. Wanfeng Auto Alloy Wheels Sales (K Units), Revenue (M USD), Price (USD/Unit) and Gross Margin (2019-2025)
Table 94. Wanfeng Auto Business Overview
Table 95. Wanfeng Auto Recent Developments
Table 96. Lizhong Group Alloy Wheels Basic Information
Table 97. Lizhong Group Alloy Wheels Product Overview
Table 98. Lizhong Group Alloy Wheels Sales (K Units), Revenue (M USD), Price (USD/Unit) and Gross Margin (2019-2025)
Table 99. Lizhong Group Business Overview
Table 100. Lizhong Group Recent Developments
Table 101. Enkei Wheels Alloy Wheels Basic Information
Table 102. Enkei Wheels Alloy Wheels Product Overview
Table 103. Enkei Wheels Alloy Wheels Sales (K Units), Revenue (M USD), Price (USD/Unit) and Gross Margin (2019-2025)
Table 104. Enkei Wheels Business Overview
Table 105. Enkei Wheels Recent Developments
Table 106. Zhejiang Jinfei Alloy Wheels Basic Information
Table 107. Zhejiang Jinfei Alloy Wheels Product Overview
Table 108. Zhejiang Jinfei Alloy Wheels Sales (K Units), Revenue (M USD), Price (USD/Unit) and Gross Margin (2019-2025)
Table 109. Zhejiang Jinfei Business Overview
Table 110. Zhejiang Jinfei Recent Developments
Table 111. Accuride Alloy Wheels Basic Information
Table 112. Accuride Alloy Wheels Product Overview
Table 113. Accuride Alloy Wheels Sales (K Units), Revenue (M USD), Price (USD/Unit) and Gross Margin (2019-2025)
Table 114. Accuride Business Overview
Table 115. Accuride Recent Developments
Table 116. Topy Group Alloy Wheels Basic Information
Table 117. Topy Group Alloy Wheels Product Overview
Table 118. Topy Group Alloy Wheels Sales (K Units), Revenue (M USD), Price (USD/Unit) and Gross Margin (2019-2025)
Table 119. Topy Group Business Overview
Table 120. Topy Group Recent Developments
Table 121. Zhongnan Alloy wheels Alloy Wheels Basic Information
Table 122. Zhongnan Alloy wheels Alloy Wheels Product Overview
Table 123. Zhongnan Alloy wheels Alloy Wheels Sales (K Units), Revenue (M USD), Price (USD/Unit) and Gross Margin (2019-2025)
Table 124. Zhongnan Alloy wheels Business Overview
Table 125. Zhongnan Alloy wheels Recent Developments
Table 126. YHI International Limited Alloy Wheels Basic Information
Table 127. YHI International Limited Alloy Wheels Product Overview
Table 128. YHI International Limited Alloy Wheels Sales (K Units), Revenue (M USD), Price (USD/Unit) and Gross Margin (2019-2025)
Table 129. YHI International Limited Business Overview
Table 130. YHI International Limited Recent Developments
Table 131. Yueling Wheels Alloy Wheels Basic Information
Table 132. Yueling Wheels Alloy Wheels Product Overview
Table 133. Yueling Wheels Alloy Wheels Sales (K Units), Revenue (M USD), Price (USD/Unit) and Gross Margin (2019-2025)
Table 134. Yueling Wheels Business Overview
Table 135. Yueling Wheels Recent Developments
Table 136. Global Alloy Wheels Sales Forecast by Region (2025-2032) & (K Units)
Table 137. Global Alloy Wheels Market Size Forecast by Region (2025-2032) & (M USD)
Table 138. North America Alloy Wheels Sales Forecast by Country (2025-2032) & (K Units)
Table 139. North America Alloy Wheels Market Size Forecast by Country (2025-2032) & (M USD)
Table 140. Europe Alloy Wheels Sales Forecast by Country (2025-2032) & (K Units)
Table 141. Europe Alloy Wheels Market Size Forecast by Country (2025-2032) & (M USD)
Table 142. Asia Pacific Alloy Wheels Sales Forecast by Region (2025-2032) & (K Units)
Table 143. Asia Pacific Alloy Wheels Market Size Forecast by Region (2025-2032) & (M USD)
Table 144. South America Alloy Wheels Sales Forecast by Country (2025-2032) & (K Units)
Table 145. South America Alloy Wheels Market Size Forecast by Country (2025-2032) & (M USD)
Table 146. Middle East and Africa Alloy Wheels Consumption Forecast by Country (2025-2032) & (Units)
Table 147. Middle East and Africa Alloy Wheels Market Size Forecast by Country (2025-2032) & (M USD)
Table 148. Global Alloy Wheels Sales Forecast by Type (2025-2032) & (K Units)
Table 149. Global Alloy Wheels Market Size Forecast by Type (2025-2032) & (M USD)
Table 150. Global Alloy Wheels Price Forecast by Type (2025-2032) & (USD/Unit)
Table 151. Global Alloy Wheels Sales (K Units) Forecast by Application (2025-2032)
Table 152. Global Alloy Wheels Market Size Forecast by Application (2025-2032) & (M USD)
List of Figures
Figure 1. Product Picture of Alloy Wheels
Figure 2. Data Triangulation
Figure 3. Key Caveats
Figure 4. Global Motor Vehicle Production (M Units)
Figure 5. Global Alloy Wheels Market Size (M USD), 2019-2032
Figure 6. Global Alloy Wheels Market Size (M USD) (2019-2032)
Figure 7. Global Alloy Wheels Sales (K Units) & (2019-2032)
Figure 8. Evaluation Matrix of Segment Market Development Potential (Type)
Figure 9. Evaluation Matrix of Segment Market Development Potential (Application)
Figure 10. Evaluation Matrix of Regional Market Development Potential
Figure 11. Alloy Wheels Market Size by Country (M USD)
Figure 12. Alloy Wheels Sales Share by Manufacturers in 2023
Figure 13. Global Alloy Wheels Revenue Share by Manufacturers in 2023
Figure 14. Alloy Wheels Market Share by Company Type (Tier 1, Tier 2 and Tier 3): 2023
Figure 15. Global Market Alloy Wheels Average Price (USD/Unit) of Key Manufacturers in 2023
Figure 16. The Global 5 and 10 Largest Players: Market Share by Alloy Wheels Revenue in 2023
Figure 17. Evaluation Matrix of Segment Market Development Potential (Type)
Figure 18. Global Alloy Wheels Market Share by Type
Figure 19. Sales Market Share of Alloy Wheels by Type (2019-2025)
Figure 20. Sales Market Share of Alloy Wheels by Type in 2023
Figure 21. Market Size Share of Alloy Wheels by Type (2019-2025)
Figure 22. Market Size Market Share of Alloy Wheels by Type in 2023
Figure 23. Evaluation Matrix of Segment Market Development Potential (Application)
Figure 24. Global Alloy Wheels Market Share by Application
Figure 25. Global Alloy Wheels Sales Market Share by Application (2019-2025)
Figure 26. Global Alloy Wheels Sales Market Share by Application in 2023
Figure 27. Global Alloy Wheels Market Share by Application (2019-2025)
Figure 28. Global Alloy Wheels Market Share by Application in 2023
Figure 29. Global Alloy Wheels Sales Growth Rate by Application (2019-2025)
Figure 30. Global Alloy Wheels Sales Market Share by Region (2019-2025)
Figure 31. North America Alloy Wheels Sales and Growth Rate (2019-2025) & (K Units)
Figure 32. North America Alloy Wheels Sales Market Share by Country in 2023
Figure 33. U.S. Alloy Wheels Sales and Growth Rate (2019-2025) & (K Units)
Figure 34. Canada Alloy Wheels Sales (K Units) and Growth Rate (2019-2025)
Figure 35. Mexico Alloy Wheels Sales (Units) and Growth Rate (2019-2025)
Figure 36. Europe Alloy Wheels Sales and Growth Rate (2019-2025) & (K Units)
Figure 37. Europe Alloy Wheels Sales Market Share by Country in 2023
Figure 38. Germany Alloy Wheels Sales and Growth Rate (2019-2025) & (K Units)
Figure 39. France Alloy Wheels Sales and Growth Rate (2019-2025) & (K Units)
Figure 40. U.K. Alloy Wheels Sales and Growth Rate (2019-2025) & (K Units)
Figure 41. Italy Alloy Wheels Sales and Growth Rate (2019-2025) & (K Units)
Figure 42. Russia Alloy Wheels Sales and Growth Rate (2019-2025) & (K Units)
Figure 43. Asia Pacific Alloy Wheels Sales and Growth Rate (K Units)
Figure 44. Asia Pacific Alloy Wheels Sales Market Share by Region in 2023
Figure 45. China Alloy Wheels Sales and Growth Rate (2019-2025) & (K Units)
Figure 46. Japan Alloy Wheels Sales and Growth Rate (2019-2025) & (K Units)
Figure 47. South Korea Alloy Wheels Sales and Growth Rate (2019-2025) & (K Units)
Figure 48. India Alloy Wheels Sales and Growth Rate (2019-2025) & (K Units)
Figure 49. Southeast Asia Alloy Wheels Sales and Growth Rate (2019-2025) & (K Units)
Figure 50. South America Alloy Wheels Sales and Growth Rate (K Units)
Figure 51. South America Alloy Wheels Sales Market Share by Country in 2023
Figure 52. Brazil Alloy Wheels Sales and Growth Rate (2019-2025) & (K Units)
Figure 53. Argentina Alloy Wheels Sales and Growth Rate (2019-2025) & (K Units)
Figure 54. Columbia Alloy Wheels Sales and Growth Rate (2019-2025) & (K Units)
Figure 55. Middle East and Africa Alloy Wheels Sales and Growth Rate (K Units)
Figure 56. Middle East and Africa Alloy Wheels Sales Market Share by Region in 2023
Figure 57. Saudi Arabia Alloy Wheels Sales and Growth Rate (2019-2025) & (K Units)
Figure 58. UAE Alloy Wheels Sales and Growth Rate (2019-2025) & (K Units)
Figure 59. Egypt Alloy Wheels Sales and Growth Rate (2019-2025) & (K Units)
Figure 60. Nigeria Alloy Wheels Sales and Growth Rate (2019-2025) & (K Units)
Figure 61. South Africa Alloy Wheels Sales and Growth Rate (2019-2025) & (K Units)
Figure 62. Global Alloy Wheels Production Market Share by Region (2019-2025)
Figure 63. North America Alloy Wheels Production (K Units) Growth Rate (2019-2025)
Figure 64. Europe Alloy Wheels Production (K Units) Growth Rate (2019-2025)
Figure 65. Japan Alloy Wheels Production (K Units) Growth Rate (2019-2025)
Figure 66. China Alloy Wheels Production (K Units) Growth Rate (2019-2025)
Figure 67. Global Alloy Wheels Sales Forecast by Volume (2019-2032) & (K Units)
Figure 68. Global Alloy Wheels Market Size Forecast by Value (2019-2032) & (M USD)
Figure 69. Global Alloy Wheels Sales Market Share Forecast by Type (2025-2032)
Figure 70. Global Alloy Wheels Market Share Forecast by Type (2025-2032)
Figure 71. Global Alloy Wheels Sales Forecast by Application (2025-2032)
Figure 72. Global Alloy Wheels Market Share Forecast by Application (2025-2032)

