The Automated Poultry Farm Market encompasses advanced technologies and automated systems designed to streamline poultry farming operations. These systems integrate feeding, heating, nesting, climate control, monitoring, and Internet of Things (IoT) solutions to enhance efficiency, reduce labor costs, and optimize poultry health.
Market Size
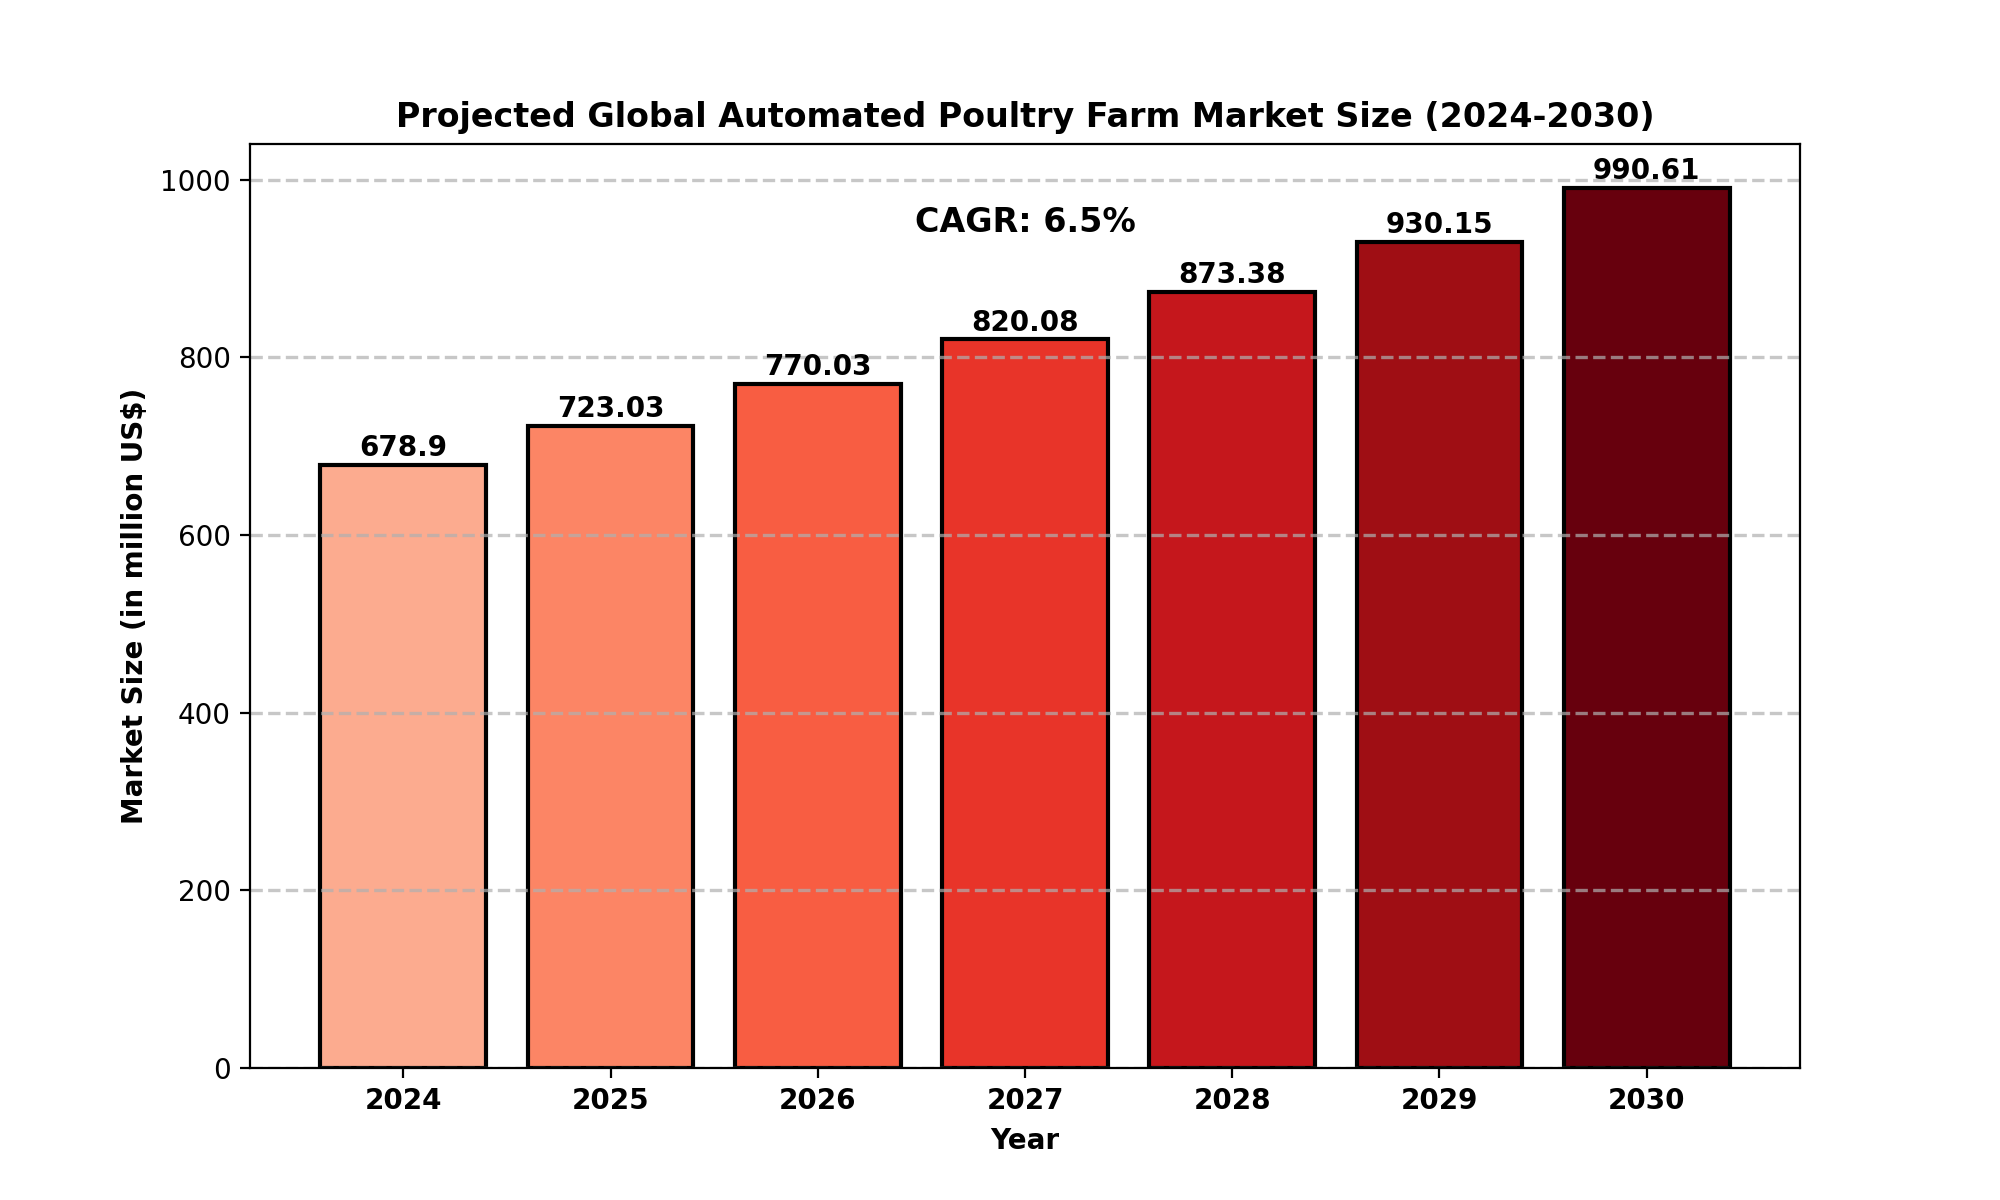
The global Automated Poultry Farm market was valued at US$ 678.9 million in 2024 and is expected to grow to US$ 990.6 million by 2030, at a CAGR of 6.5% during the forecast period.
In the United States, the market size was US$ 223.4 million in 2024, with a projected increase to US$ 323.6 million by 2030, growing at a CAGR of 6.4%.
Key Market Trends:
-
Large Farms Lead Market Share (42%) – Due to increasing demand for poultry production efficiency.
-
Feed Automation (35%) – Ensures optimized nutrition and reduced waste.
-
Climate Control Growth (32%) – Essential for maintaining poultry health and productivity.
-
Monitoring Systems (30%) – Improved disease detection and flock management.
-
IoT Integration (28%) – Enabling smart data analytics and real-time monitoring.
Market Dynamics
Drivers
-
Rising Demand for Poultry Products: Growing global population and increasing meat consumption drive market expansion.
-
Labor Cost Reduction: Automated solutions minimize the need for manual labor, reducing operational costs.
-
Technological Advancements: Integration of AI, IoT, and machine learning enhances farm productivity.
-
Government Support & Regulations: Policies promoting food safety and animal welfare encourage automation adoption.
Restraints
-
High Initial Investment: Significant capital required for installing automated systems.
-
Lack of Awareness in Developing Regions: Limited adoption due to low technological penetration.
-
Maintenance Costs: Automated systems require regular servicing and technical expertise.
Opportunities
-
Expansion in Emerging Markets: Increasing poultry consumption in Asia-Pacific and Latin America.
-
Innovations in Smart Farming: AI-driven monitoring systems for disease control and predictive analytics.
-
Sustainable Farming Solutions: Development of eco-friendly and energy-efficient automation technologies.
Challenges
-
Cybersecurity Risks: Vulnerabilities in IoT-enabled farm systems.
-
Infrastructure Limitations: Lack of high-speed internet and power reliability in rural areas.
-
Regulatory Compliance: Stringent animal welfare and food safety regulations.
Regional Analysis
North America
-
Market Share: Significant due to advanced technology adoption and high poultry consumption.
-
Key Players: Leading automation manufacturers based in the U.S.
-
Growth Factors: Government subsidies and research investments in smart farming.
Europe
-
Market Trends: Strong emphasis on animal welfare and sustainability.
-
Automation Adoption: Advanced climate control and feeding systems widely used.
-
Key Countries: Germany, UK, France, Italy, and the Netherlands.
Asia-Pacific
-
Rapid Growth Region: High demand for poultry and increasing automation in China, India, and Japan.
-
Investment Surge: Major companies expanding in APAC due to cost-effective production.
South America & MEA
Competitor Analysis
Key Companies:
Competitive Strategies:
-
Product Innovation: Smart sensors and AI-driven feeding systems.
-
Mergers & Acquisitions: Expansion through strategic partnerships.
-
Regional Expansion: Investments in emerging markets.
Market Segmentation (by Type)
-
Feeding System: Automating food distribution.
-
Heating System: Temperature regulation for poultry comfort.
-
Nesting: Automated egg collection and poultry care.
Market Segmentation (by Application)
Geographic Segmentation
-
North America: USA, Canada, Mexico
-
Europe: Germany, UK, France, Russia, Italy
-
Asia-Pacific: China, Japan, South Korea, India, Southeast Asia
-
South America: Brazil, Argentina, Columbia
-
Middle East & Africa: Saudi Arabia, UAE, Egypt, Nigeria, South Africa
FAQs
What is the current market size of the Automated Poultry Farm industry?
- The global Automated Poultry Farm market is valued at US$ 678.9 million in 2024 and is expected to reach US$ 989.4 million by 2030, growing at a CAGR of 6.5%.
Which companies are leading in the Automated Poultry Farm market?
- Key players include LiVi Machinery, Hotraco Company, Fancom, SYSTEM CLEANERS, Dhumal, and Reliance Poultry Equipment.
What are the major growth drivers of the Automated Poultry Farm market?
- Increasing demand for poultry products, labor cost reduction, AI and IoT adoption, and supportive government policies.
Which regions dominate the Automated Poultry Farm market?
- North America and Asia-Pacific lead the market, with high automation adoption in the USA, China, and India.
What are the emerging trends in the Automated Poultry Farm industry?
- Key trends include IoT-based monitoring, AI-driven automation, climate-controlled environments, and energy-efficient farming solutions.
Key Benefits of This Market Research:
-
Industry drivers, restraints, and opportunities covered in the study
-
Neutral perspective on the market performance
-
Recent industry trends and developments
-
Competitive landscape & strategies of key players
-
Potential & niche segments and regions exhibiting promising growth covered
-
Historical, current, and projected market size, in terms of value
-
In-depth analysis of the Automated Poultry Farm Market
-
Overview of the regional outlook of the Automated Poultry Farm Market:
Key Reasons to Buy this Report:
-
Access to date statistics compiled by our researchers. These provide you with historical and forecast data, which is analyzed to tell you why your market is set to change
-
This enables you to anticipate market changes to remain ahead of your competitors
-
You will be able to copy data from the Excel spreadsheet straight into your marketing plans, business presentations, or other strategic documents
-
The concise analysis, clear graph, and table format will enable you to pinpoint the information you require quickly
-
Provision of market value (USD Billion) data for each segment and sub-segment
-
Indicates the region and segment that is expected to witness the fastest growth as well as to dominate the market
-
Analysis by geography highlighting the consumption of the product/service in the region as well as indicating the factors that are affecting the market within each region
-
Competitive landscape which incorporates the market ranking of the major players, along with new service/product launches, partnerships, business expansions, and acquisitions in the past five years of companies profiled
-
Extensive company profiles comprising of company overview, company insights, product benchmarking, and SWOT analysis for the major market players
-
The current as well as the future market outlook of the industry concerning recent developments which involve growth opportunities and drivers as well as challenges and restraints of both emerging as well as developed regions
-
Includes in-depth analysis of the market from various perspectives through Porter
TABLE OF CONTENTS
Table of Contents
1 Research Methodology and Statistical Scope
1.1 Market Definition and Statistical Scope of Automated Poultry Farm
1.2 Key Market Segments
1.2.1 Automated Poultry Farm Segment by Type
1.2.2 Automated Poultry Farm Segment by Application
1.3 Methodology & Sources of Information
1.3.1 Research Methodology
1.3.2 Research Process
1.3.3 Market Breakdown and Data Triangulation
1.3.4 Base Year
1.3.5 Report Assumptions & Caveats
2 Automated Poultry Farm Market Overview
2.1 Global Market Overview
2.1.1 Global Automated Poultry Farm Market Size (M USD) Estimates and Forecasts (2019-2030)
2.1.2 Global Automated Poultry Farm Sales Estimates and Forecasts (2019-2030)
2.2 Market Segment Executive Summary
2.3 Global Market Size by Region
3 Automated Poultry Farm Market Competitive Landscape
3.1 Global Automated Poultry Farm Sales by Manufacturers (2019-2024)
3.2 Global Automated Poultry Farm Revenue Market Share by Manufacturers (2019-2024)
3.3 Automated Poultry Farm Market Share by Company Type (Tier 1, Tier 2, and Tier 3)
3.4 Global Automated Poultry Farm Average Price by Manufacturers (2019-2024)
3.5 Manufacturers Automated Poultry Farm Sales Sites, Area Served, Product Type
3.6 Automated Poultry Farm Market Competitive Situation and Trends
3.6.1 Automated Poultry Farm Market Concentration Rate
3.6.2 Global 5 and 10 Largest Automated Poultry Farm Players Market Share by Revenue
3.6.3 Mergers & Acquisitions, Expansion
4 Automated Poultry Farm Industry Chain Analysis
4.1 Automated Poultry Farm Industry Chain Analysis
4.2 Market Overview of Key Raw Materials
4.3 Midstream Market Analysis
4.4 Downstream Customer Analysis
5 The Development and Dynamics of Automated Poultry Farm Market
5.1 Key Development Trends
5.2 Driving Factors
5.3 Market Challenges
5.4 Market Restraints
5.5 Industry News
5.5.1 New Product Developments
5.5.2 Mergers & Acquisitions
5.5.3 Expansions
5.5.4 Collaboration/Supply Contracts
5.6 Industry Policies
6 Automated Poultry Farm Market Segmentation by Type
6.1 Evaluation Matrix of Segment Market Development Potential (Type)
6.2 Global Automated Poultry Farm Sales Market Share by Type (2019-2024)
6.3 Global Automated Poultry Farm Market Size Market Share by Type (2019-2024)
6.4 Global Automated Poultry Farm Price by Type (2019-2024)
7 Automated Poultry Farm Market Segmentation by Application
7.1 Evaluation Matrix of Segment Market Development Potential (Application)
7.2 Global Automated Poultry Farm Market Sales by Application (2019-2024)
7.3 Global Automated Poultry Farm Market Size (M USD) by Application (2019-2024)
7.4 Global Automated Poultry Farm Sales Growth Rate by Application (2019-2024)
8 Automated Poultry Farm Market Segmentation by Region
8.1 Global Automated Poultry Farm Sales by Region
8.1.1 Global Automated Poultry Farm Sales by Region
8.1.2 Global Automated Poultry Farm Sales Market Share by Region
8.2 North America
8.2.1 North America Automated Poultry Farm Sales by Country
8.2.2 U.S.
8.2.3 Canada
8.2.4 Mexico
8.3 Europe
8.3.1 Europe Automated Poultry Farm Sales by Country
8.3.2 Germany
8.3.3 France
8.3.4 U.K.
8.3.5 Italy
8.3.6 Russia
8.4 Asia Pacific
8.4.1 Asia Pacific Automated Poultry Farm Sales by Region
8.4.2 China
8.4.3 Japan
8.4.4 South Korea
8.4.5 India
8.4.6 Southeast Asia
8.5 South America
8.5.1 South America Automated Poultry Farm Sales by Country
8.5.2 Brazil
8.5.3 Argentina
8.5.4 Columbia
8.6 Middle East and Africa
8.6.1 Middle East and Africa Automated Poultry Farm Sales by Region
8.6.2 Saudi Arabia
8.6.3 UAE
8.6.4 Egypt
8.6.5 Nigeria
8.6.6 South Africa
9 Key Companies Profile
9.1 LiVi Machinery
9.1.1 LiVi Machinery Automated Poultry Farm Basic Information
9.1.2 LiVi Machinery Automated Poultry Farm Product Overview
9.1.3 LiVi Machinery Automated Poultry Farm Product Market Performance
9.1.4 LiVi Machinery Business Overview
9.1.5 LiVi Machinery Automated Poultry Farm SWOT Analysis
9.1.6 LiVi Machinery Recent Developments
9.2 Hotraco Company
9.2.1 Hotraco Company Automated Poultry Farm Basic Information
9.2.2 Hotraco Company Automated Poultry Farm Product Overview
9.2.3 Hotraco Company Automated Poultry Farm Product Market Performance
9.2.4 Hotraco Company Business Overview
9.2.5 Hotraco Company Automated Poultry Farm SWOT Analysis
9.2.6 Hotraco Company Recent Developments
9.3 Fancom
9.3.1 Fancom Automated Poultry Farm Basic Information
9.3.2 Fancom Automated Poultry Farm Product Overview
9.3.3 Fancom Automated Poultry Farm Product Market Performance
9.3.4 Fancom Automated Poultry Farm SWOT Analysis
9.3.5 Fancom Business Overview
9.3.6 Fancom Recent Developments
9.4 SYSTEM CLEANERS
9.4.1 SYSTEM CLEANERS Automated Poultry Farm Basic Information
9.4.2 SYSTEM CLEANERS Automated Poultry Farm Product Overview
9.4.3 SYSTEM CLEANERS Automated Poultry Farm Product Market Performance
9.4.4 SYSTEM CLEANERS Business Overview
9.4.5 SYSTEM CLEANERS Recent Developments
9.5 Dhumal
9.5.1 Dhumal Automated Poultry Farm Basic Information
9.5.2 Dhumal Automated Poultry Farm Product Overview
9.5.3 Dhumal Automated Poultry Farm Product Market Performance
9.5.4 Dhumal Business Overview
9.5.5 Dhumal Recent Developments
9.6 Xingyang Fengyu
9.6.1 Xingyang Fengyu Automated Poultry Farm Basic Information
9.6.2 Xingyang Fengyu Automated Poultry Farm Product Overview
9.6.3 Xingyang Fengyu Automated Poultry Farm Product Market Performance
9.6.4 Xingyang Fengyu Business Overview
9.6.5 Xingyang Fengyu Recent Developments
9.7 Zhongzhou Muye
9.7.1 Zhongzhou Muye Automated Poultry Farm Basic Information
9.7.2 Zhongzhou Muye Automated Poultry Farm Product Overview
9.7.3 Zhongzhou Muye Automated Poultry Farm Product Market Performance
9.7.4 Zhongzhou Muye Business Overview
9.7.5 Zhongzhou Muye Recent Developments
9.8 Shengying Muye
9.8.1 Shengying Muye Automated Poultry Farm Basic Information
9.8.2 Shengying Muye Automated Poultry Farm Product Overview
9.8.3 Shengying Muye Automated Poultry Farm Product Market Performance
9.8.4 Shengying Muye Business Overview
9.8.5 Shengying Muye Recent Developments
9.9 Tianmuyuan
9.9.1 Tianmuyuan Automated Poultry Farm Basic Information
9.9.2 Tianmuyuan Automated Poultry Farm Product Overview
9.9.3 Tianmuyuan Automated Poultry Farm Product Market Performance
9.9.4 Tianmuyuan Business Overview
9.9.5 Tianmuyuan Recent Developments
9.10 Reliance Poultry Equipment
9.10.1 Reliance Poultry Equipment Automated Poultry Farm Basic Information
9.10.2 Reliance Poultry Equipment Automated Poultry Farm Product Overview
9.10.3 Reliance Poultry Equipment Automated Poultry Farm Product Market Performance
9.10.4 Reliance Poultry Equipment Business Overview
9.10.5 Reliance Poultry Equipment Recent Developments
10 Automated Poultry Farm Market Forecast by Region
10.1 Global Automated Poultry Farm Market Size Forecast
10.2 Global Automated Poultry Farm Market Forecast by Region
10.2.1 North America Market Size Forecast by Country
10.2.2 Europe Automated Poultry Farm Market Size Forecast by Country
10.2.3 Asia Pacific Automated Poultry Farm Market Size Forecast by Region
10.2.4 South America Automated Poultry Farm Market Size Forecast by Country
10.2.5 Middle East and Africa Forecasted Consumption of Automated Poultry Farm by Country
11 Forecast Market by Type and by Application (2025-2030)
11.1 Global Automated Poultry Farm Market Forecast by Type (2025-2030)
11.1.1 Global Forecasted Sales of Automated Poultry Farm by Type (2025-2030)
11.1.2 Global Automated Poultry Farm Market Size Forecast by Type (2025-2030)
11.1.3 Global Forecasted Price of Automated Poultry Farm by Type (2025-2030)
11.2 Global Automated Poultry Farm Market Forecast by Application (2025-2030)
11.2.1 Global Automated Poultry Farm Sales (Kilotons) Forecast by Application
11.2.2 Global Automated Poultry Farm Market Size (M USD) Forecast by Application (2025-2030)
12 Conclusion and Key Findings
LIST OF TABLES & FIGURES
List of Tables
Table 1. Introduction of the Type
Table 2. Introduction of the Application
Table 3. Market Size (M USD) Segment Executive Summary
Table 4. Automated Poultry Farm Market Size Comparison by Region (M USD)
Table 5. Global Automated Poultry Farm Sales (Kilotons) by Manufacturers (2019-2024)
Table 6. Global Automated Poultry Farm Sales Market Share by Manufacturers (2019-2024)
Table 7. Global Automated Poultry Farm Revenue (M USD) by Manufacturers (2019-2024)
Table 8. Global Automated Poultry Farm Revenue Share by Manufacturers (2019-2024)
Table 9. Company Type (Tier 1, Tier 2, and Tier 3) & (based on the Revenue in Automated Poultry Farm as of 2022)
Table 10. Global Market Automated Poultry Farm Average Price (USD/Ton) of Key Manufacturers (2019-2024)
Table 11. Manufacturers Automated Poultry Farm Sales Sites and Area Served
Table 12. Manufacturers Automated Poultry Farm Product Type
Table 13. Global Automated Poultry Farm Manufacturers Market Concentration Ratio (CR5 and HHI)
Table 14. Mergers & Acquisitions, Expansion Plans
Table 15. Industry Chain Map of Automated Poultry Farm
Table 16. Market Overview of Key Raw Materials
Table 17. Midstream Market Analysis
Table 18. Downstream Customer Analysis
Table 19. Key Development Trends
Table 20. Driving Factors
Table 21. Automated Poultry Farm Market Challenges
Table 22. Global Automated Poultry Farm Sales by Type (Kilotons)
Table 23. Global Automated Poultry Farm Market Size by Type (M USD)
Table 24. Global Automated Poultry Farm Sales (Kilotons) by Type (2019-2024)
Table 25. Global Automated Poultry Farm Sales Market Share by Type (2019-2024)
Table 26. Global Automated Poultry Farm Market Size (M USD) by Type (2019-2024)
Table 27. Global Automated Poultry Farm Market Size Share by Type (2019-2024)
Table 28. Global Automated Poultry Farm Price (USD/Ton) by Type (2019-2024)
Table 29. Global Automated Poultry Farm Sales (Kilotons) by Application
Table 30. Global Automated Poultry Farm Market Size by Application
Table 31. Global Automated Poultry Farm Sales by Application (2019-2024) & (Kilotons)
Table 32. Global Automated Poultry Farm Sales Market Share by Application (2019-2024)
Table 33. Global Automated Poultry Farm Sales by Application (2019-2024) & (M USD)
Table 34. Global Automated Poultry Farm Market Share by Application (2019-2024)
Table 35. Global Automated Poultry Farm Sales Growth Rate by Application (2019-2024)
Table 36. Global Automated Poultry Farm Sales by Region (2019-2024) & (Kilotons)
Table 37. Global Automated Poultry Farm Sales Market Share by Region (2019-2024)
Table 38. North America Automated Poultry Farm Sales by Country (2019-2024) & (Kilotons)
Table 39. Europe Automated Poultry Farm Sales by Country (2019-2024) & (Kilotons)
Table 40. Asia Pacific Automated Poultry Farm Sales by Region (2019-2024) & (Kilotons)
Table 41. South America Automated Poultry Farm Sales by Country (2019-2024) & (Kilotons)
Table 42. Middle East and Africa Automated Poultry Farm Sales by Region (2019-2024) & (Kilotons)
Table 43. LiVi Machinery Automated Poultry Farm Basic Information
Table 44. LiVi Machinery Automated Poultry Farm Product Overview
Table 45. LiVi Machinery Automated Poultry Farm Sales (Kilotons), Revenue (M USD), Price (USD/Ton) and Gross Margin (2019-2024)
Table 46. LiVi Machinery Business Overview
Table 47. LiVi Machinery Automated Poultry Farm SWOT Analysis
Table 48. LiVi Machinery Recent Developments
Table 49. Hotraco Company Automated Poultry Farm Basic Information
Table 50. Hotraco Company Automated Poultry Farm Product Overview
Table 51. Hotraco Company Automated Poultry Farm Sales (Kilotons), Revenue (M USD), Price (USD/Ton) and Gross Margin (2019-2024)
Table 52. Hotraco Company Business Overview
Table 53. Hotraco Company Automated Poultry Farm SWOT Analysis
Table 54. Hotraco Company Recent Developments
Table 55. Fancom Automated Poultry Farm Basic Information
Table 56. Fancom Automated Poultry Farm Product Overview
Table 57. Fancom Automated Poultry Farm Sales (Kilotons), Revenue (M USD), Price (USD/Ton) and Gross Margin (2019-2024)
Table 58. Fancom Automated Poultry Farm SWOT Analysis
Table 59. Fancom Business Overview
Table 60. Fancom Recent Developments
Table 61. SYSTEM CLEANERS Automated Poultry Farm Basic Information
Table 62. SYSTEM CLEANERS Automated Poultry Farm Product Overview
Table 63. SYSTEM CLEANERS Automated Poultry Farm Sales (Kilotons), Revenue (M USD), Price (USD/Ton) and Gross Margin (2019-2024)
Table 64. SYSTEM CLEANERS Business Overview
Table 65. SYSTEM CLEANERS Recent Developments
Table 66. Dhumal Automated Poultry Farm Basic Information
Table 67. Dhumal Automated Poultry Farm Product Overview
Table 68. Dhumal Automated Poultry Farm Sales (Kilotons), Revenue (M USD), Price (USD/Ton) and Gross Margin (2019-2024)
Table 69. Dhumal Business Overview
Table 70. Dhumal Recent Developments
Table 71. Xingyang Fengyu Automated Poultry Farm Basic Information
Table 72. Xingyang Fengyu Automated Poultry Farm Product Overview
Table 73. Xingyang Fengyu Automated Poultry Farm Sales (Kilotons), Revenue (M USD), Price (USD/Ton) and Gross Margin (2019-2024)
Table 74. Xingyang Fengyu Business Overview
Table 75. Xingyang Fengyu Recent Developments
Table 76. Zhongzhou Muye Automated Poultry Farm Basic Information
Table 77. Zhongzhou Muye Automated Poultry Farm Product Overview
Table 78. Zhongzhou Muye Automated Poultry Farm Sales (Kilotons), Revenue (M USD), Price (USD/Ton) and Gross Margin (2019-2024)
Table 79. Zhongzhou Muye Business Overview
Table 80. Zhongzhou Muye Recent Developments
Table 81. Shengying Muye Automated Poultry Farm Basic Information
Table 82. Shengying Muye Automated Poultry Farm Product Overview
Table 83. Shengying Muye Automated Poultry Farm Sales (Kilotons), Revenue (M USD), Price (USD/Ton) and Gross Margin (2019-2024)
Table 84. Shengying Muye Business Overview
Table 85. Shengying Muye Recent Developments
Table 86. Tianmuyuan Automated Poultry Farm Basic Information
Table 87. Tianmuyuan Automated Poultry Farm Product Overview
Table 88. Tianmuyuan Automated Poultry Farm Sales (Kilotons), Revenue (M USD), Price (USD/Ton) and Gross Margin (2019-2024)
Table 89. Tianmuyuan Business Overview
Table 90. Tianmuyuan Recent Developments
Table 91. Reliance Poultry Equipment Automated Poultry Farm Basic Information
Table 92. Reliance Poultry Equipment Automated Poultry Farm Product Overview
Table 93. Reliance Poultry Equipment Automated Poultry Farm Sales (Kilotons), Revenue (M USD), Price (USD/Ton) and Gross Margin (2019-2024)
Table 94. Reliance Poultry Equipment Business Overview
Table 95. Reliance Poultry Equipment Recent Developments
Table 96. Global Automated Poultry Farm Sales Forecast by Region (2025-2030) & (Kilotons)
Table 97. Global Automated Poultry Farm Market Size Forecast by Region (2025-2030) & (M USD)
Table 98. North America Automated Poultry Farm Sales Forecast by Country (2025-2030) & (Kilotons)
Table 99. North America Automated Poultry Farm Market Size Forecast by Country (2025-2030) & (M USD)
Table 100. Europe Automated Poultry Farm Sales Forecast by Country (2025-2030) & (Kilotons)
Table 101. Europe Automated Poultry Farm Market Size Forecast by Country (2025-2030) & (M USD)
Table 102. Asia Pacific Automated Poultry Farm Sales Forecast by Region (2025-2030) & (Kilotons)
Table 103. Asia Pacific Automated Poultry Farm Market Size Forecast by Region (2025-2030) & (M USD)
Table 104. South America Automated Poultry Farm Sales Forecast by Country (2025-2030) & (Kilotons)
Table 105. South America Automated Poultry Farm Market Size Forecast by Country (2025-2030) & (M USD)
Table 106. Middle East and Africa Automated Poultry Farm Consumption Forecast by Country (2025-2030) & (Units)
Table 107. Middle East and Africa Automated Poultry Farm Market Size Forecast by Country (2025-2030) & (M USD)
Table 108. Global Automated Poultry Farm Sales Forecast by Type (2025-2030) & (Kilotons)
Table 109. Global Automated Poultry Farm Market Size Forecast by Type (2025-2030) & (M USD)
Table 110. Global Automated Poultry Farm Price Forecast by Type (2025-2030) & (USD/Ton)
Table 111. Global Automated Poultry Farm Sales (Kilotons) Forecast by Application (2025-2030)
Table 112. Global Automated Poultry Farm Market Size Forecast by Application (2025-2030) & (M USD)
List of Figures
Figure 1. Product Picture of Automated Poultry Farm
Figure 2. Data Triangulation
Figure 3. Key Caveats
Figure 4. Global Automated Poultry Farm Market Size (M USD), 2019-2030
Figure 5. Global Automated Poultry Farm Market Size (M USD) (2019-2030)
Figure 6. Global Automated Poultry Farm Sales (Kilotons) & (2019-2030)
Figure 7. Evaluation Matrix of Segment Market Development Potential (Type)
Figure 8. Evaluation Matrix of Segment Market Development Potential (Application)
Figure 9. Evaluation Matrix of Regional Market Development Potential
Figure 10. Automated Poultry Farm Market Size by Country (M USD)
Figure 11. Automated Poultry Farm Sales Share by Manufacturers in 2023
Figure 12. Global Automated Poultry Farm Revenue Share by Manufacturers in 2023
Figure 13. Automated Poultry Farm Market Share by Company Type (Tier 1, Tier 2 and Tier 3): 2023
Figure 14. Global Market Automated Poultry Farm Average Price (USD/Ton) of Key Manufacturers in 2023
Figure 15. The Global 5 and 10 Largest Players: Market Share by Automated Poultry Farm Revenue in 2023
Figure 16. Evaluation Matrix of Segment Market Development Potential (Type)
Figure 17. Global Automated Poultry Farm Market Share by Type
Figure 18. Sales Market Share of Automated Poultry Farm by Type (2019-2024)
Figure 19. Sales Market Share of Automated Poultry Farm by Type in 2023
Figure 20. Market Size Share of Automated Poultry Farm by Type (2019-2024)
Figure 21. Market Size Market Share of Automated Poultry Farm by Type in 2023
Figure 22. Evaluation Matrix of Segment Market Development Potential (Application)
Figure 23. Global Automated Poultry Farm Market Share by Application
Figure 24. Global Automated Poultry Farm Sales Market Share by Application (2019-2024)
Figure 25. Global Automated Poultry Farm Sales Market Share by Application in 2023
Figure 26. Global Automated Poultry Farm Market Share by Application (2019-2024)
Figure 27. Global Automated Poultry Farm Market Share by Application in 2023
Figure 28. Global Automated Poultry Farm Sales Growth Rate by Application (2019-2024)
Figure 29. Global Automated Poultry Farm Sales Market Share by Region (2019-2024)
Figure 30. North America Automated Poultry Farm Sales and Growth Rate (2019-2024) & (Kilotons)
Figure 31. North America Automated Poultry Farm Sales Market Share by Country in 2023
Figure 32. U.S. Automated Poultry Farm Sales and Growth Rate (2019-2024) & (Kilotons)
Figure 33. Canada Automated Poultry Farm Sales (Kilotons) and Growth Rate (2019-2024)
Figure 34. Mexico Automated Poultry Farm Sales (Units) and Growth Rate (2019-2024)
Figure 35. Europe Automated Poultry Farm Sales and Growth Rate (2019-2024) & (Kilotons)
Figure 36. Europe Automated Poultry Farm Sales Market Share by Country in 2023
Figure 37. Germany Automated Poultry Farm Sales and Growth Rate (2019-2024) & (Kilotons)
Figure 38. France Automated Poultry Farm Sales and Growth Rate (2019-2024) & (Kilotons)
Figure 39. U.K. Automated Poultry Farm Sales and Growth Rate (2019-2024) & (Kilotons)
Figure 40. Italy Automated Poultry Farm Sales and Growth Rate (2019-2024) & (Kilotons)
Figure 41. Russia Automated Poultry Farm Sales and Growth Rate (2019-2024) & (Kilotons)
Figure 42. Asia Pacific Automated Poultry Farm Sales and Growth Rate (Kilotons)
Figure 43. Asia Pacific Automated Poultry Farm Sales Market Share by Region in 2023
Figure 44. China Automated Poultry Farm Sales and Growth Rate (2019-2024) & (Kilotons)
Figure 45. Japan Automated Poultry Farm Sales and Growth Rate (2019-2024) & (Kilotons)
Figure 46. South Korea Automated Poultry Farm Sales and Growth Rate (2019-2024) & (Kilotons)
Figure 47. India Automated Poultry Farm Sales and Growth Rate (2019-2024) & (Kilotons)
Figure 48. Southeast Asia Automated Poultry Farm Sales and Growth Rate (2019-2024) & (Kilotons)
Figure 49. South America Automated Poultry Farm Sales and Growth Rate (Kilotons)
Figure 50. South America Automated Poultry Farm Sales Market Share by Country in 2023
Figure 51. Brazil Automated Poultry Farm Sales and Growth Rate (2019-2024) & (Kilotons)
Figure 52. Argentina Automated Poultry Farm Sales and Growth Rate (2019-2024) & (Kilotons)
Figure 53. Columbia Automated Poultry Farm Sales and Growth Rate (2019-2024) & (Kilotons)
Figure 54. Middle East and Africa Automated Poultry Farm Sales and Growth Rate (Kilotons)
Figure 55. Middle East and Africa Automated Poultry Farm Sales Market Share by Region in 2023
Figure 56. Saudi Arabia Automated Poultry Farm Sales and Growth Rate (2019-2024) & (Kilotons)
Figure 57. UAE Automated Poultry Farm Sales and Growth Rate (2019-2024) & (Kilotons)
Figure 58. Egypt Automated Poultry Farm Sales and Growth Rate (2019-2024) & (Kilotons)
Figure 59. Nigeria Automated Poultry Farm Sales and Growth Rate (2019-2024) & (Kilotons)
Figure 60. South Africa Automated Poultry Farm Sales and Growth Rate (2019-2024) & (Kilotons)
Figure 61. Global Automated Poultry Farm Sales Forecast by Volume (2019-2030) & (Kilotons)
Figure 62. Global Automated Poultry Farm Market Size Forecast by Value (2019-2030) & (M USD)
Figure 63. Global Automated Poultry Farm Sales Market Share Forecast by Type (2025-2030)
Figure 64. Global Automated Poultry Farm Market Share Forecast by Type (2025-2030)
Figure 65. Global Automated Poultry Farm Sales Forecast by Application (2025-2030)
Figure 66. Global Automated Poultry Farm Market Share Forecast by Application (2025-2030)
")
