The Embedded Security Devices market encompasses a range of hardware-based security solutions that protect digital assets, sensitive information, and communications from cyber threats and unauthorized access. These devices integrate cryptographic functions, secure key storage, and authentication mechanisms to enhance data protection. Common categories include Secure Elements (eSE), Embedded SIMs, Trusted Platform Modules (TPM), Hardware Security Modules (HSM), and Hardware Tokens. These technologies are widely used in consumer electronics, automotive, healthcare, industrial IoT, and smart grid applications.
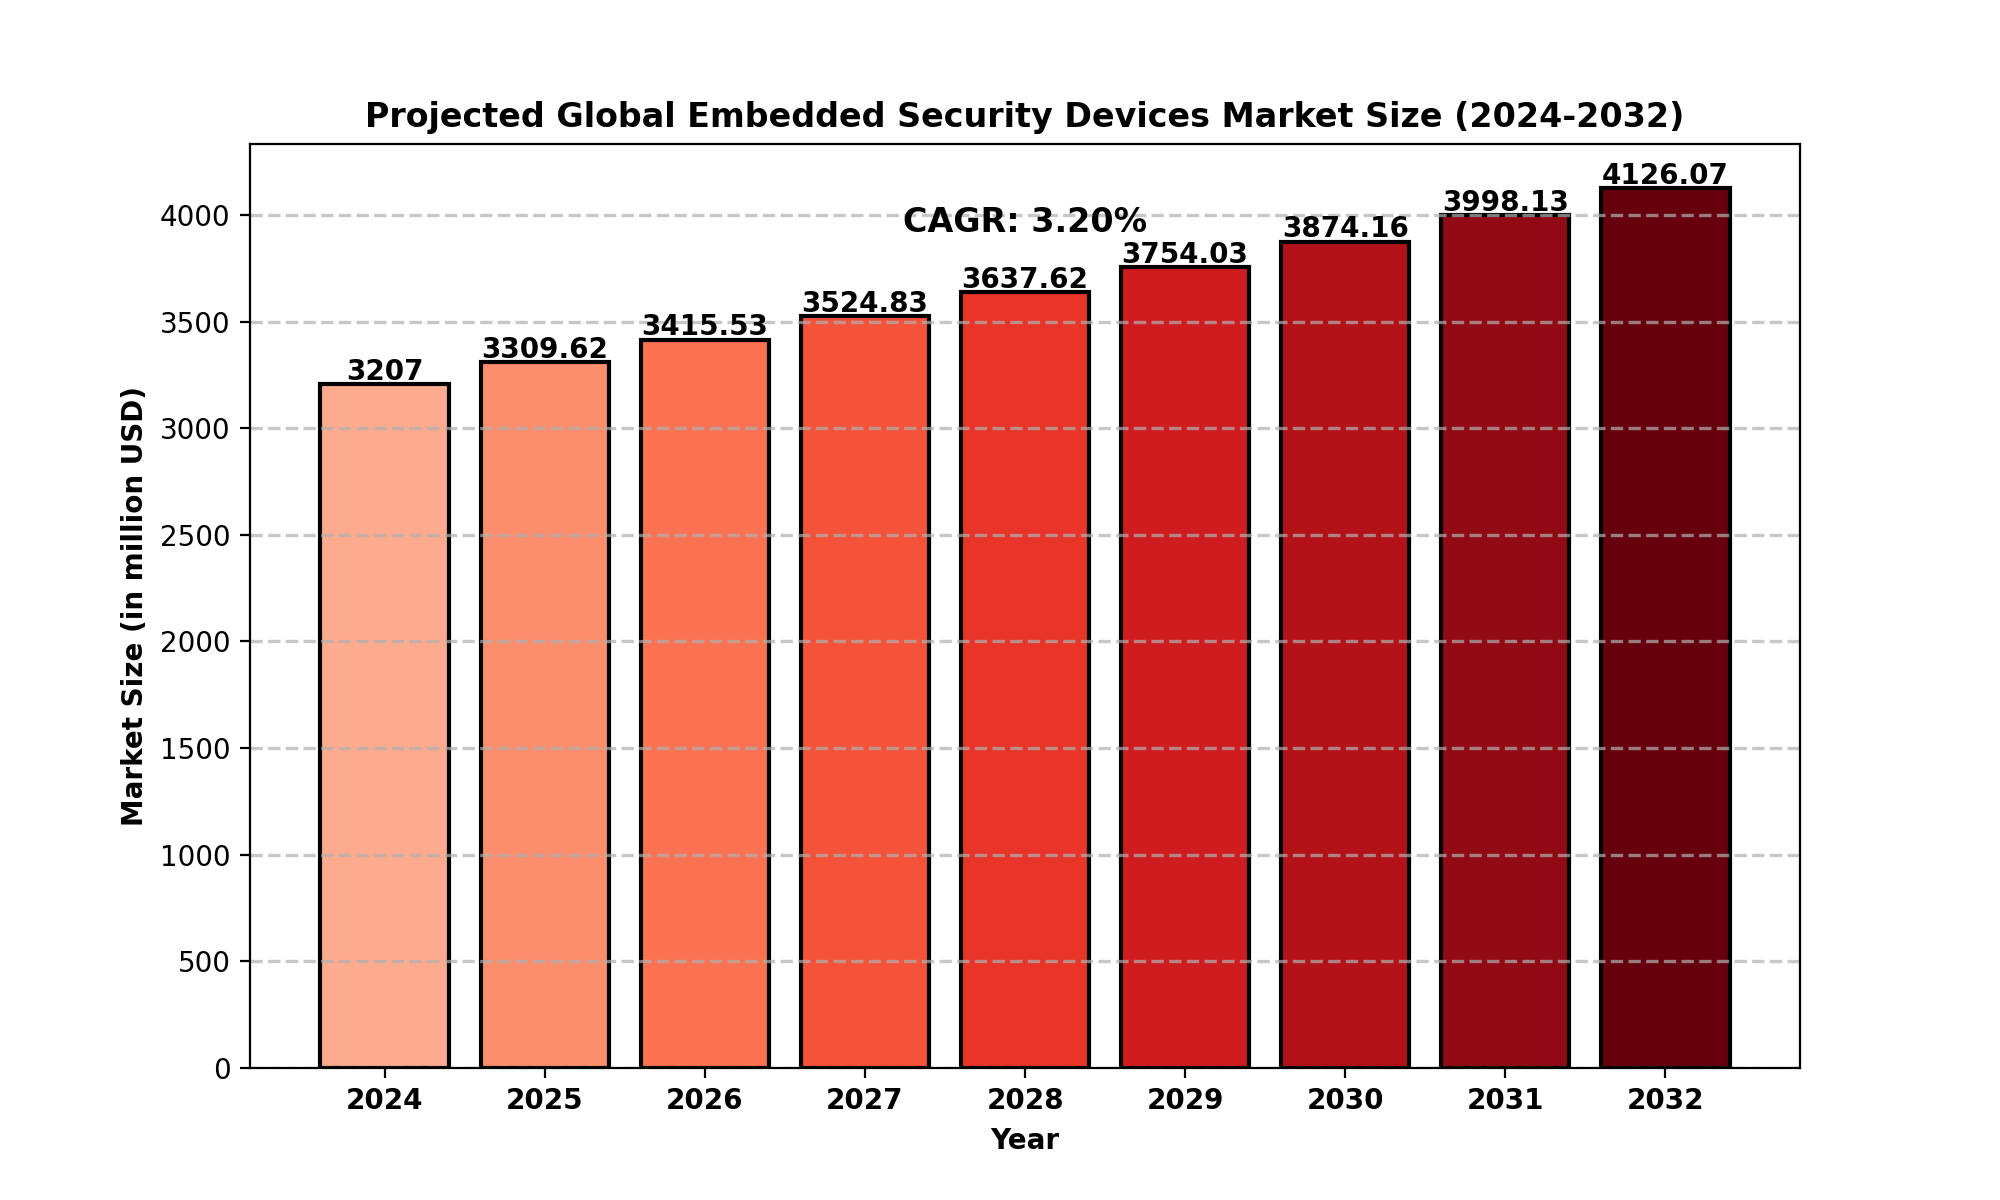
Market Size
As of 2024, the global Embedded Security Devices market is valued at approximately USD 3,207 million, with projections estimating a rise to USD 4,126.07 million by 2032, reflecting a Compound Annual Growth Rate (CAGR) of 3.20%.
-
North America: USD 882.12 million in 2024, with a CAGR of 2.74%
-
Europe, Asia-Pacific, South America, and MEA also showcase promising growth potential.
Market Dynamics (Drivers, Restraints, Opportunities, and Challenges)
Drivers
-
Rising Cybersecurity Threats – The increasing number of cyberattacks on financial transactions, healthcare data, and intellectual property fuels demand for embedded security solutions.
-
Adoption of IoT and Smart Devices – The proliferation of smart homes, wearables, and connected vehicles boosts the need for integrated security solutions.
-
Regulatory Compliance and Data Protection Laws – Governments worldwide enforce stringent cybersecurity and data protection regulations, driving adoption.
-
Advancements in Automotive Security – The shift towards autonomous and connected vehicles necessitates robust security mechanisms.
Restraints
-
High Implementation Costs – Initial deployment and integration expenses deter small and medium enterprises (SMEs).
-
Complexity in Deployment – Managing encryption, authentication, and secure key storage across diverse applications poses challenges.
Opportunities
-
Expansion of 5G and Edge Computing – Accelerates demand for embedded security to protect data at the edge.
-
Integration with AI and Machine Learning – Enhancing real-time threat detection and mitigation strategies.
Challenges
-
Evolving Cyber Threats – Sophisticated hacking techniques demand continuous updates and improvements.
-
Interoperability Issues – Ensuring compatibility across different hardware and software platforms remains a challenge.
Regional Analysis
-
North America – Market driven by stringent regulatory policies, high adoption of IoT, and increased cyber threats.
-
Europe – Strong presence of cybersecurity initiatives, particularly in financial and healthcare sectors.
-
Asia-Pacific – Fastest-growing region due to increasing smartphone penetration and industrial automation.
-
South America & MEA – Emerging markets witnessing gradual adoption of embedded security technologies.
Competitor Analysis
The market features several key players competing based on technology innovation, product portfolio, and market reach:
-
NXP Semiconductors – Leading provider of embedded security solutions for IoT, automotive, and industrial applications.
-
Infineon Technologies – Specializes in secure microcontrollers and Trusted Platform Modules.
-
STMicroelectronics – Offers a wide range of secure element solutions.
-
Gemalto (Thales Group) – Focuses on SIM-based and banking security solutions.
-
Samsung, Intel, Microchip, and Renesas Electronics are also key players shaping the industry.
Market Segmentation (by Application)
-
Smartphones, Tablets, and Wearables – Secure mobile transactions, biometric authentication, and mobile payments.
-
Automotive – Keyless entry systems, digital car keys, and vehicle-to-vehicle communication security.
-
PCs & Servers – Hardware-based authentication and encryption.
-
Others – Industrial IoT, healthcare devices, and government ID security.
Market Segmentation (by Type)
-
Embedded Secure Element (eSE) & Embedded SIM – Used in mobile and IoT applications for authentication.
-
Trusted Platform Module (TPM) – Provides hardware-based security for PCs, servers, and embedded systems.
Key Companies
-
NXP Semiconductors
-
Infineon Technologies
-
STMicroelectronics
-
Gemalto (Thales Group)
-
IDEMIA
-
Maxim Integrated
-
Renesas Electronics Corporation
-
Microchip Technology Inc.
-
Samsung Electronics
-
Intel Corporation
-
Nuvoton Technology Corporation
Geographic Segmentation
-
North America (USA, Canada, Mexico)
-
Europe (Germany, UK, France, Russia, Italy, Rest of Europe)
-
Asia-Pacific (China, Japan, South Korea, India, Southeast Asia, Rest of Asia-Pacific)
-
South America (Brazil, Argentina, Colombia, Rest of South America)
-
Middle East & Africa (Saudi Arabia, UAE, Egypt, Nigeria, South Africa, Rest of MEA)
FAQ Section
What is the current market size of the Embedded Security Devices Market?
- The global Embedded Security Devices market is valued at USD 3,207 million in 2024 and is projected to reach USD 4,258.10 million by 2032.
Which are the key companies operating in the Embedded Security Devices Market?
- Major players include NXP Semiconductors, Infineon Technologies, STMicroelectronics, Gemalto (Thales Group), Samsung Electronics, Intel Corporation, and Renesas Electronics Corporation.
What are the key growth drivers in the Embedded Security Devices Market?
- Key growth drivers include rising cyber threats, IoT expansion, regulatory compliance, and advancements in automotive security.
Which regions dominate the Embedded Security Devices Market?
- North America, Europe, and Asia-Pacific are the leading regions, with North America holding a significant market share.
What are the emerging trends in the Embedded Security Devices Market?
- Trends include the integration of AI for real-time security, the adoption of 5G, and the expansion of embedded security in IoT applications.
Key Benefits of This Market Research:
-
Industry drivers, restraints, and opportunities covered in the study
-
Neutral perspective on the market performance
-
Recent industry trends and developments
-
Competitive landscape & strategies of key players
-
Potential & niche segments and regions exhibiting promising growth covered
-
Historical, current, and projected market size, in terms of value
-
In-depth analysis of the Embedded Security Devices Market
-
Overview of the regional outlook of the Embedded Security Devices Market:
Key Reasons to Buy this Report:
-
Access to date statistics compiled by our researchers. These provide you with historical and forecast data, which is analyzed to tell you why your market is set to change
-
This enables you to anticipate market changes to remain ahead of your competitors
-
You will be able to copy data from the Excel spreadsheet straight into your marketing plans, business presentations, or other strategic documents
-
The concise analysis, clear graph, and table format will enable you to pinpoint the information you require quickly
-
Provision of market value data for each segment and sub-segment
-
Indicates the region and segment that is expected to witness the fastest growth as well as to dominate the market
-
Analysis by geography highlighting the consumption of the product/service in the region as well as indicating the factors that are affecting the market within each region
-
Competitive landscape which incorporates the market ranking of the major players, along with new service/product launches, partnerships, business expansions, and acquisitions in the past five years of companies profiled
-
Extensive company profiles comprising of company overview, company insights, product benchmarking, and SWOT analysis for the major market players
-
The current as well as the future market outlook of the industry concerning recent developments which involve growth opportunities and drivers as well as challenges and restraints of both emerging as well as developed regions
-
Includes in-depth analysis of the market from various perspectives through Porters five forces analysis
-
Provides insight into the market through Value Chain
-
Market dynamics scenario, along with growth opportunities of the market in the years to come
-
6-month post-sales analyst support
Customization of the Report
Chapter Outline
-
Chapter 1 mainly introduces the statistical scope of the report, market division standards, and market research methods.
-
Chapter 2 is an executive summary of different market segments (by region, product type, application, etc), including the market size of each market segment, future development potential, and so on. It offers a high-level view of the current state of the Embedded Security Devices Market and its likely evolution in the short to mid-term, and long term.
-
Chapter 3 makes a detailed analysis of the market's competitive landscape of the market and provides the market share, capacity, output, price, latest development plan, merger, and acquisition information of the main manufacturers in the market.
-
Chapter 4 is the analysis of the whole market industrial chain, including the upstream and downstream of the industry, as well as Porter's five forces analysis.
-
Chapter 5 introduces the latest developments of the market, the driving factors and restrictive factors of the market, the challenges and risks faced by manufacturers in the industry, and the analysis of relevant policies in the industry.
-
Chapter 6 provides the analysis of various market segments according to product types, covering the market size and development potential of each market segment, to help readers find the blue ocean market in different market segments.
-
Chapter 7 provides the analysis of various market segments according to application, covering the market size and development potential of each market segment, to help readers find the blue ocean market in different downstream markets.
-
Chapter 8 provides a quantitative analysis of the market size and development potential of each region from the consumer side and its main countries and introduces the market development, future development prospects, market space, and capacity of each country in the world.
-
Chapter 9 shares the main producing countries of Embedded Security Devices, their output value, profit level, regional supply, production capacity layout, etc. from the supply side.
-
Chapter 10 introduces the basic situation of the main companies in the market in detail, including product sales revenue, sales volume, price, gross profit margin, market share, product introduction, recent development, etc.
-
Chapter 11 provides a quantitative analysis of the market size and development potential of each region during the forecast period.
-
Chapter 12 provides a quantitative analysis of the market size and development potential of each market segment during the forecast period.
-
Chapter 13 is the main points and conclusions of the report.
TABLE OF CONTENTS
Table of Contents
1 Research Methodology and Statistical Scope
1.1 Market Definition and Statistical Scope of Embedded Security Devices
1.2 Key Market Segments
1.2.1 Embedded Security Devices Segment by Type
1.2.2 Embedded Security Devices Segment by Application
1.3 Methodology & Sources of Information
1.3.1 Research Methodology
1.3.2 Research Process
1.3.3 Market Breakdown and Data Triangulation
1.3.4 Base Year
1.3.5 Report Assumptions & Caveats
2 Embedded Security Devices Market Overview
2.1 Global Market Overview
2.1.1 Global Embedded Security Devices Market Size (M USD) Estimates and Forecasts (2019-2032)
2.1.2 Global Embedded Security Devices Sales Estimates and Forecasts (2019-2032)
2.2 Market Segment Executive Summary
2.3 Global Market Size by Region
3 Embedded Security Devices Market Competitive Landscape
3.1 Global Embedded Security Devices Sales by Manufacturers (2019-2025)
3.2 Global Embedded Security Devices Revenue Market Share by Manufacturers (2019-2025)
3.3 Embedded Security Devices Market Share by Company Type (Tier 1, Tier 2, and Tier 3)
3.4 Global Embedded Security Devices Average Price by Manufacturers (2019-2025)
3.5 Manufacturers Embedded Security Devices Sales Sites, Area Served, Product Type
3.6 Embedded Security Devices Market Competitive Situation and Trends
3.6.1 Embedded Security Devices Market Concentration Rate
3.6.2 Global 5 and 10 Largest Embedded Security Devices Players Market Share by Revenue
3.6.3 Mergers & Acquisitions, Expansion
4 Embedded Security Devices Industry Chain Analysis
4.1 Embedded Security Devices Industry Chain Analysis
4.2 Market Overview of Key Raw Materials
4.3 Midstream Market Analysis
4.4 Downstream Customer Analysis
5 The Development and Dynamics of Embedded Security Devices Market
5.1 Key Development Trends
5.2 Driving Factors
5.3 Market Challenges
5.4 Market Restraints
5.5 Industry News
5.5.1 New Product Developments
5.5.2 Mergers & Acquisitions
5.5.3 Expansions
5.5.4 Collaboration/Supply Contracts
5.6 Industry Policies
6 Embedded Security Devices Market Segmentation by Type
6.1 Evaluation Matrix of Segment Market Development Potential (Type)
6.2 Global Embedded Security Devices Sales Market Share by Type (2019-2025)
6.3 Global Embedded Security Devices Market Size Market Share by Type (2019-2025)
6.4 Global Embedded Security Devices Price by Type (2019-2025)
7 Embedded Security Devices Market Segmentation by Application
7.1 Evaluation Matrix of Segment Market Development Potential (Application)
7.2 Global Embedded Security Devices Market Sales by Application (2019-2025)
7.3 Global Embedded Security Devices Market Size (M USD) by Application (2019-2025)
7.4 Global Embedded Security Devices Sales Growth Rate by Application (2019-2025)
8 Embedded Security Devices Market Consumption by Region
8.1 Global Embedded Security Devices Sales by Region
8.1.1 Global Embedded Security Devices Sales by Region
8.1.2 Global Embedded Security Devices Sales Market Share by Region
8.2 North America
8.2.1 North America Embedded Security Devices Sales by Country
8.2.2 U.S.
8.2.3 Canada
8.2.4 Mexico
8.3 Europe
8.3.1 Europe Embedded Security Devices Sales by Country
8.3.2 Germany
8.3.3 France
8.3.4 U.K.
8.3.5 Italy
8.3.6 Russia
8.4 Asia Pacific
8.4.1 Asia Pacific Embedded Security Devices Sales by Region
8.4.2 China
8.4.3 Japan
8.4.4 South Korea
8.4.5 India
8.4.6 Southeast Asia
8.5 South America
8.5.1 South America Embedded Security Devices Sales by Country
8.5.2 Brazil
8.5.3 Argentina
8.5.4 Columbia
8.6 Middle East and Africa
8.6.1 Middle East and Africa Embedded Security Devices Sales by Region
8.6.2 Saudi Arabia
8.6.3 UAE
8.6.4 Egypt
8.6.5 Nigeria
8.6.6 South Africa
9 Embedded Security Devices Market Production by Region
9.1 Global Production of Embedded Security Devices by Region (2019-2025)
9.2 Global Embedded Security Devices Revenue Market Share by Region (2019-2025)
9.3 Global Embedded Security Devices Production, Revenue, Price and Gross Margin (2019-2025)
9.4 North America Embedded Security Devices Production
9.4.1 North America Embedded Security Devices Production Growth Rate (2019-2025)
9.4.2 North America Embedded Security Devices Production, Revenue, Price and Gross Margin (2019-2025)
9.5 Europe Embedded Security Devices Production
9.5.1 Europe Embedded Security Devices Production Growth Rate (2019-2025)
9.5.2 Europe Embedded Security Devices Production, Revenue, Price and Gross Margin (2019-2025)
9.6 Japan Embedded Security Devices Production (2019-2025)
9.6.1 Japan Embedded Security Devices Production Growth Rate (2019-2025)
9.6.2 Japan Embedded Security Devices Production, Revenue, Price and Gross Margin (2019-2025)
9.7 China Embedded Security Devices Production (2019-2025)
9.7.1 China Embedded Security Devices Production Growth Rate (2019-2025)
9.7.2 China Embedded Security Devices Production, Revenue, Price and Gross Margin (2019-2025)
10 Key Companies Profile
10.1 NXP Semiconductors
10.1.1 NXP Semiconductors Embedded Security Devices Basic Information
10.1.2 NXP Semiconductors Embedded Security Devices Product Overview
10.1.3 NXP Semiconductors Embedded Security Devices Product Market Performance
10.1.4 NXP Semiconductors Business Overview
10.1.5 NXP Semiconductors Embedded Security Devices SWOT Analysis
10.1.6 NXP Semiconductors Recent Developments
10.2 Infineon
10.2.1 Infineon Embedded Security Devices Basic Information
10.2.2 Infineon Embedded Security Devices Product Overview
10.2.3 Infineon Embedded Security Devices Product Market Performance
10.2.4 Infineon Business Overview
10.2.5 Infineon Embedded Security Devices SWOT Analysis
10.2.6 Infineon Recent Developments
10.3 STMicroelectronics
10.3.1 STMicroelectronics Embedded Security Devices Basic Information
10.3.2 STMicroelectronics Embedded Security Devices Product Overview
10.3.3 STMicroelectronics Embedded Security Devices Product Market Performance
10.3.4 STMicroelectronics Embedded Security Devices SWOT Analysis
10.3.5 STMicroelectronics Business Overview
10.3.6 STMicroelectronics Recent Developments
10.4 Gemalto
10.4.1 Gemalto Embedded Security Devices Basic Information
10.4.2 Gemalto Embedded Security Devices Product Overview
10.4.3 Gemalto Embedded Security Devices Product Market Performance
10.4.4 Gemalto Business Overview
10.4.5 Gemalto Recent Developments
10.5 IDEMIA
10.5.1 IDEMIA Embedded Security Devices Basic Information
10.5.2 IDEMIA Embedded Security Devices Product Overview
10.5.3 IDEMIA Embedded Security Devices Product Market Performance
10.5.4 IDEMIA Business Overview
10.5.5 IDEMIA Recent Developments
10.6 Maxim Integrated
10.6.1 Maxim Integrated Embedded Security Devices Basic Information
10.6.2 Maxim Integrated Embedded Security Devices Product Overview
10.6.3 Maxim Integrated Embedded Security Devices Product Market Performance
10.6.4 Maxim Integrated Business Overview
10.6.5 Maxim Integrated Recent Developments
10.7 Renesas Electronics Corporation.
10.7.1 Renesas Electronics Corporation. Embedded Security Devices Basic Information
10.7.2 Renesas Electronics Corporation. Embedded Security Devices Product Overview
10.7.3 Renesas Electronics Corporation. Embedded Security Devices Product Market Performance
10.7.4 Renesas Electronics Corporation. Business Overview
10.7.5 Renesas Electronics Corporation. Recent Developments
10.8 Microchip
10.8.1 Microchip Embedded Security Devices Basic Information
10.8.2 Microchip Embedded Security Devices Product Overview
10.8.3 Microchip Embedded Security Devices Product Market Performance
10.8.4 Microchip Business Overview
10.8.5 Microchip Recent Developments
10.9 Samsung
10.9.1 Samsung Embedded Security Devices Basic Information
10.9.2 Samsung Embedded Security Devices Product Overview
10.9.3 Samsung Embedded Security Devices Product Market Performance
10.9.4 Samsung Business Overview
10.9.5 Samsung Recent Developments
10.10 Intel
10.10.1 Intel Embedded Security Devices Basic Information
10.10.2 Intel Embedded Security Devices Product Overview
10.10.3 Intel Embedded Security Devices Product Market Performance
10.10.4 Intel Business Overview
10.10.5 Intel Recent Developments
10.11 Nuvoton Technology Corporation
10.11.1 Nuvoton Technology Corporation Embedded Security Devices Basic Information
10.11.2 Nuvoton Technology Corporation Embedded Security Devices Product Overview
10.11.3 Nuvoton Technology Corporation Embedded Security Devices Product Market Performance
10.11.4 Nuvoton Technology Corporation Business Overview
10.11.5 Nuvoton Technology Corporation Recent Developments
11 Embedded Security Devices Market Forecast by Region
11.1 Global Embedded Security Devices Market Size Forecast
11.2 Global Embedded Security Devices Market Forecast by Region
11.2.1 North America Market Size Forecast by Country
11.2.2 Europe Embedded Security Devices Market Size Forecast by Country
11.2.3 Asia Pacific Embedded Security Devices Market Size Forecast by Region
11.2.4 South America Embedded Security Devices Market Size Forecast by Country
11.2.5 Middle East and Africa Forecasted Consumption of Embedded Security Devices by Country
12 Forecast Market by Type and by Application (2025-2032)
12.1 Global Embedded Security Devices Market Forecast by Type (2025-2032)
12.1.1 Global Forecasted Sales of Embedded Security Devices by Type (2025-2032)
12.1.2 Global Embedded Security Devices Market Size Forecast by Type (2025-2032)
12.1.3 Global Forecasted Price of Embedded Security Devices by Type (2025-2032)
12.2 Global Embedded Security Devices Market Forecast by Application (2025-2032)
12.2.1 Global Embedded Security Devices Sales (K Units) Forecast by Application
12.2.2 Global Embedded Security Devices Market Size (M USD) Forecast by Application (2025-2032)
13 Conclusion and Key Findings
LIST OF TABLES & FIGURES
List of Tables
Table 1. Introduction of the Type
Table 2. Introduction of the Application
Table 3. Market Size (M USD) Segment Executive Summary
Table 4. Embedded Security Devices Market Size Comparison by Region (M USD)
Table 5. Global Embedded Security Devices Sales (K Units) by Manufacturers (2019-2025)
Table 6. Global Embedded Security Devices Sales Market Share by Manufacturers (2019-2025)
Table 7. Global Embedded Security Devices Revenue (M USD) by Manufacturers (2019-2025)
Table 8. Global Embedded Security Devices Revenue Share by Manufacturers (2019-2025)
Table 9. Company Type (Tier 1, Tier 2, and Tier 3) & (based on the Revenue in Embedded Security Devices as of 2022)
Table 10. Global Market Embedded Security Devices Average Price (USD/Unit) of Key Manufacturers (2019-2025)
Table 11. Manufacturers Embedded Security Devices Sales Sites and Area Served
Table 12. Manufacturers Embedded Security Devices Product Type
Table 13. Global Embedded Security Devices Manufacturers Market Concentration Ratio (CR5 and HHI)
Table 14. Mergers & Acquisitions, Expansion Plans
Table 15. Industry Chain Map of Embedded Security Devices
Table 16. Market Overview of Key Raw Materials
Table 17. Midstream Market Analysis
Table 18. Downstream Customer Analysis
Table 19. Key Development Trends
Table 20. Driving Factors
Table 21. Embedded Security Devices Market Challenges
Table 22. Global Embedded Security Devices Sales by Type (K Units)
Table 23. Global Embedded Security Devices Market Size by Type (M USD)
Table 24. Global Embedded Security Devices Sales (K Units) by Type (2019-2025)
Table 25. Global Embedded Security Devices Sales Market Share by Type (2019-2025)
Table 26. Global Embedded Security Devices Market Size (M USD) by Type (2019-2025)
Table 27. Global Embedded Security Devices Market Size Share by Type (2019-2025)
Table 28. Global Embedded Security Devices Price (USD/Unit) by Type (2019-2025)
Table 29. Global Embedded Security Devices Sales (K Units) by Application
Table 30. Global Embedded Security Devices Market Size by Application
Table 31. Global Embedded Security Devices Sales by Application (2019-2025) & (K Units)
Table 32. Global Embedded Security Devices Sales Market Share by Application (2019-2025)
Table 33. Global Embedded Security Devices Sales by Application (2019-2025) & (M USD)
Table 34. Global Embedded Security Devices Market Share by Application (2019-2025)
Table 35. Global Embedded Security Devices Sales Growth Rate by Application (2019-2025)
Table 36. Global Embedded Security Devices Sales by Region (2019-2025) & (K Units)
Table 37. Global Embedded Security Devices Sales Market Share by Region (2019-2025)
Table 38. North America Embedded Security Devices Sales by Country (2019-2025) & (K Units)
Table 39. Europe Embedded Security Devices Sales by Country (2019-2025) & (K Units)
Table 40. Asia Pacific Embedded Security Devices Sales by Region (2019-2025) & (K Units)
Table 41. South America Embedded Security Devices Sales by Country (2019-2025) & (K Units)
Table 42. Middle East and Africa Embedded Security Devices Sales by Region (2019-2025) & (K Units)
Table 43. Global Embedded Security Devices Production (K Units) by Region (2019-2025)
Table 44. Global Embedded Security Devices Revenue (US$ Million) by Region (2019-2025)
Table 45. Global Embedded Security Devices Revenue Market Share by Region (2019-2025)
Table 46. Global Embedded Security Devices Production (K Units), Revenue (US$ Million), Price (USD/Unit) and Gross Margin (2019-2025)
Table 47. North America Embedded Security Devices Production (K Units), Revenue (US$ Million), Price (USD/Unit) and Gross Margin (2019-2025)
Table 48. Europe Embedded Security Devices Production (K Units), Revenue (US$ Million), Price (USD/Unit) and Gross Margin (2019-2025)
Table 49. Japan Embedded Security Devices Production (K Units), Revenue (US$ Million), Price (USD/Unit) and Gross Margin (2019-2025)
Table 50. China Embedded Security Devices Production (K Units), Revenue (US$ Million), Price (USD/Unit) and Gross Margin (2019-2025)
Table 51. NXP Semiconductors Embedded Security Devices Basic Information
Table 52. NXP Semiconductors Embedded Security Devices Product Overview
Table 53. NXP Semiconductors Embedded Security Devices Sales (K Units), Revenue (M USD), Price (USD/Unit) and Gross Margin (2019-2025)
Table 54. NXP Semiconductors Business Overview
Table 55. NXP Semiconductors Embedded Security Devices SWOT Analysis
Table 56. NXP Semiconductors Recent Developments
Table 57. Infineon Embedded Security Devices Basic Information
Table 58. Infineon Embedded Security Devices Product Overview
Table 59. Infineon Embedded Security Devices Sales (K Units), Revenue (M USD), Price (USD/Unit) and Gross Margin (2019-2025)
Table 60. Infineon Business Overview
Table 61. Infineon Embedded Security Devices SWOT Analysis
Table 62. Infineon Recent Developments
Table 63. STMicroelectronics Embedded Security Devices Basic Information
Table 64. STMicroelectronics Embedded Security Devices Product Overview
Table 65. STMicroelectronics Embedded Security Devices Sales (K Units), Revenue (M USD), Price (USD/Unit) and Gross Margin (2019-2025)
Table 66. STMicroelectronics Embedded Security Devices SWOT Analysis
Table 67. STMicroelectronics Business Overview
Table 68. STMicroelectronics Recent Developments
Table 69. Gemalto Embedded Security Devices Basic Information
Table 70. Gemalto Embedded Security Devices Product Overview
Table 71. Gemalto Embedded Security Devices Sales (K Units), Revenue (M USD), Price (USD/Unit) and Gross Margin (2019-2025)
Table 72. Gemalto Business Overview
Table 73. Gemalto Recent Developments
Table 74. IDEMIA Embedded Security Devices Basic Information
Table 75. IDEMIA Embedded Security Devices Product Overview
Table 76. IDEMIA Embedded Security Devices Sales (K Units), Revenue (M USD), Price (USD/Unit) and Gross Margin (2019-2025)
Table 77. IDEMIA Business Overview
Table 78. IDEMIA Recent Developments
Table 79. Maxim Integrated Embedded Security Devices Basic Information
Table 80. Maxim Integrated Embedded Security Devices Product Overview
Table 81. Maxim Integrated Embedded Security Devices Sales (K Units), Revenue (M USD), Price (USD/Unit) and Gross Margin (2019-2025)
Table 82. Maxim Integrated Business Overview
Table 83. Maxim Integrated Recent Developments
Table 84. Renesas Electronics Corporation. Embedded Security Devices Basic Information
Table 85. Renesas Electronics Corporation. Embedded Security Devices Product Overview
Table 86. Renesas Electronics Corporation. Embedded Security Devices Sales (K Units), Revenue (M USD), Price (USD/Unit) and Gross Margin (2019-2025)
Table 87. Renesas Electronics Corporation. Business Overview
Table 88. Renesas Electronics Corporation. Recent Developments
Table 89. Microchip Embedded Security Devices Basic Information
Table 90. Microchip Embedded Security Devices Product Overview
Table 91. Microchip Embedded Security Devices Sales (K Units), Revenue (M USD), Price (USD/Unit) and Gross Margin (2019-2025)
Table 92. Microchip Business Overview
Table 93. Microchip Recent Developments
Table 94. Samsung Embedded Security Devices Basic Information
Table 95. Samsung Embedded Security Devices Product Overview
Table 96. Samsung Embedded Security Devices Sales (K Units), Revenue (M USD), Price (USD/Unit) and Gross Margin (2019-2025)
Table 97. Samsung Business Overview
Table 98. Samsung Recent Developments
Table 99. Intel Embedded Security Devices Basic Information
Table 100. Intel Embedded Security Devices Product Overview
Table 101. Intel Embedded Security Devices Sales (K Units), Revenue (M USD), Price (USD/Unit) and Gross Margin (2019-2025)
Table 102. Intel Business Overview
Table 103. Intel Recent Developments
Table 104. Nuvoton Technology Corporation Embedded Security Devices Basic Information
Table 105. Nuvoton Technology Corporation Embedded Security Devices Product Overview
Table 106. Nuvoton Technology Corporation Embedded Security Devices Sales (K Units), Revenue (M USD), Price (USD/Unit) and Gross Margin (2019-2025)
Table 107. Nuvoton Technology Corporation Business Overview
Table 108. Nuvoton Technology Corporation Recent Developments
Table 109. Global Embedded Security Devices Sales Forecast by Region (2025-2032) & (K Units)
Table 110. Global Embedded Security Devices Market Size Forecast by Region (2025-2032) & (M USD)
Table 111. North America Embedded Security Devices Sales Forecast by Country (2025-2032) & (K Units)
Table 112. North America Embedded Security Devices Market Size Forecast by Country (2025-2032) & (M USD)
Table 113. Europe Embedded Security Devices Sales Forecast by Country (2025-2032) & (K Units)
Table 114. Europe Embedded Security Devices Market Size Forecast by Country (2025-2032) & (M USD)
Table 115. Asia Pacific Embedded Security Devices Sales Forecast by Region (2025-2032) & (K Units)
Table 116. Asia Pacific Embedded Security Devices Market Size Forecast by Region (2025-2032) & (M USD)
Table 117. South America Embedded Security Devices Sales Forecast by Country (2025-2032) & (K Units)
Table 118. South America Embedded Security Devices Market Size Forecast by Country (2025-2032) & (M USD)
Table 119. Middle East and Africa Embedded Security Devices Consumption Forecast by Country (2025-2032) & (Units)
Table 120. Middle East and Africa Embedded Security Devices Market Size Forecast by Country (2025-2032) & (M USD)
Table 121. Global Embedded Security Devices Sales Forecast by Type (2025-2032) & (K Units)
Table 122. Global Embedded Security Devices Market Size Forecast by Type (2025-2032) & (M USD)
Table 123. Global Embedded Security Devices Price Forecast by Type (2025-2032) & (USD/Unit)
Table 124. Global Embedded Security Devices Sales (K Units) Forecast by Application (2025-2032)
Table 125. Global Embedded Security Devices Market Size Forecast by Application (2025-2032) & (M USD)
List of Figures
Figure 1. Product Picture of Embedded Security Devices
Figure 2. Data Triangulation
Figure 3. Key Caveats
Figure 4. Global Embedded Security Devices Market Size (M USD), 2019-2032
Figure 5. Global Embedded Security Devices Market Size (M USD) (2019-2032)
Figure 6. Global Embedded Security Devices Sales (K Units) & (2019-2032)
Figure 7. Evaluation Matrix of Segment Market Development Potential (Type)
Figure 8. Evaluation Matrix of Segment Market Development Potential (Application)
Figure 9. Evaluation Matrix of Regional Market Development Potential
Figure 10. Embedded Security Devices Market Size by Country (M USD)
Figure 11. Embedded Security Devices Sales Share by Manufacturers in 2023
Figure 12. Global Embedded Security Devices Revenue Share by Manufacturers in 2023
Figure 13. Embedded Security Devices Market Share by Company Type (Tier 1, Tier 2 and Tier 3): 2023
Figure 14. Global Market Embedded Security Devices Average Price (USD/Unit) of Key Manufacturers in 2023
Figure 15. The Global 5 and 10 Largest Players: Market Share by Embedded Security Devices Revenue in 2023
Figure 16. Evaluation Matrix of Segment Market Development Potential (Type)
Figure 17. Global Embedded Security Devices Market Share by Type
Figure 18. Sales Market Share of Embedded Security Devices by Type (2019-2025)
Figure 19. Sales Market Share of Embedded Security Devices by Type in 2023
Figure 20. Market Size Share of Embedded Security Devices by Type (2019-2025)
Figure 21. Market Size Market Share of Embedded Security Devices by Type in 2023
Figure 22. Evaluation Matrix of Segment Market Development Potential (Application)
Figure 23. Global Embedded Security Devices Market Share by Application
Figure 24. Global Embedded Security Devices Sales Market Share by Application (2019-2025)
Figure 25. Global Embedded Security Devices Sales Market Share by Application in 2023
Figure 26. Global Embedded Security Devices Market Share by Application (2019-2025)
Figure 27. Global Embedded Security Devices Market Share by Application in 2023
Figure 28. Global Embedded Security Devices Sales Growth Rate by Application (2019-2025)
Figure 29. Global Embedded Security Devices Sales Market Share by Region (2019-2025)
Figure 30. North America Embedded Security Devices Sales and Growth Rate (2019-2025) & (K Units)
Figure 31. North America Embedded Security Devices Sales Market Share by Country in 2023
Figure 32. U.S. Embedded Security Devices Sales and Growth Rate (2019-2025) & (K Units)
Figure 33. Canada Embedded Security Devices Sales (K Units) and Growth Rate (2019-2025)
Figure 34. Mexico Embedded Security Devices Sales (Units) and Growth Rate (2019-2025)
Figure 35. Europe Embedded Security Devices Sales and Growth Rate (2019-2025) & (K Units)
Figure 36. Europe Embedded Security Devices Sales Market Share by Country in 2023
Figure 37. Germany Embedded Security Devices Sales and Growth Rate (2019-2025) & (K Units)
Figure 38. France Embedded Security Devices Sales and Growth Rate (2019-2025) & (K Units)
Figure 39. U.K. Embedded Security Devices Sales and Growth Rate (2019-2025) & (K Units)
Figure 40. Italy Embedded Security Devices Sales and Growth Rate (2019-2025) & (K Units)
Figure 41. Russia Embedded Security Devices Sales and Growth Rate (2019-2025) & (K Units)
Figure 42. Asia Pacific Embedded Security Devices Sales and Growth Rate (K Units)
Figure 43. Asia Pacific Embedded Security Devices Sales Market Share by Region in 2023
Figure 44. China Embedded Security Devices Sales and Growth Rate (2019-2025) & (K Units)
Figure 45. Japan Embedded Security Devices Sales and Growth Rate (2019-2025) & (K Units)
Figure 46. South Korea Embedded Security Devices Sales and Growth Rate (2019-2025) & (K Units)
Figure 47. India Embedded Security Devices Sales and Growth Rate (2019-2025) & (K Units)
Figure 48. Southeast Asia Embedded Security Devices Sales and Growth Rate (2019-2025) & (K Units)
Figure 49. South America Embedded Security Devices Sales and Growth Rate (K Units)
Figure 50. South America Embedded Security Devices Sales Market Share by Country in 2023
Figure 51. Brazil Embedded Security Devices Sales and Growth Rate (2019-2025) & (K Units)
Figure 52. Argentina Embedded Security Devices Sales and Growth Rate (2019-2025) & (K Units)
Figure 53. Columbia Embedded Security Devices Sales and Growth Rate (2019-2025) & (K Units)
Figure 54. Middle East and Africa Embedded Security Devices Sales and Growth Rate (K Units)
Figure 55. Middle East and Africa Embedded Security Devices Sales Market Share by Region in 2023
Figure 56. Saudi Arabia Embedded Security Devices Sales and Growth Rate (2019-2025) & (K Units)
Figure 57. UAE Embedded Security Devices Sales and Growth Rate (2019-2025) & (K Units)
Figure 58. Egypt Embedded Security Devices Sales and Growth Rate (2019-2025) & (K Units)
Figure 59. Nigeria Embedded Security Devices Sales and Growth Rate (2019-2025) & (K Units)
Figure 60. South Africa Embedded Security Devices Sales and Growth Rate (2019-2025) & (K Units)
Figure 61. Global Embedded Security Devices Production Market Share by Region (2019-2025)
Figure 62. North America Embedded Security Devices Production (K Units) Growth Rate (2019-2025)
Figure 63. Europe Embedded Security Devices Production (K Units) Growth Rate (2019-2025)
Figure 64. Japan Embedded Security Devices Production (K Units) Growth Rate (2019-2025)
Figure 65. China Embedded Security Devices Production (K Units) Growth Rate (2019-2025)
Figure 66. Global Embedded Security Devices Sales Forecast by Volume (2019-2032) & (K Units)
Figure 67. Global Embedded Security Devices Market Size Forecast by Value (2019-2032) & (M USD)
Figure 68. Global Embedded Security Devices Sales Market Share Forecast by Type (2025-2032)
Figure 69. Global Embedded Security Devices Market Share Forecast by Type (2025-2032)
Figure 70. Global Embedded Security Devices Sales Forecast by Application (2025-2032)
Figure 71. Global Embedded Security Devices Market Share Forecast by Application (2025-2032)

