Ferro Silicon Zirconium is a specialized ferroalloy composed primarily of silicon (Si) and zirconium (Zr), with minor elements like iron. It is widely used as an inoculant in the production of ductile iron and cast iron, significantly improving their mechanical properties, strength, and microstructure. By refining grain size and reducing impurities, Ferro Silicon Zirconium enhances casting quality, making it an essential material in automotive, industrial machinery, and infrastructure applications.
Market Size
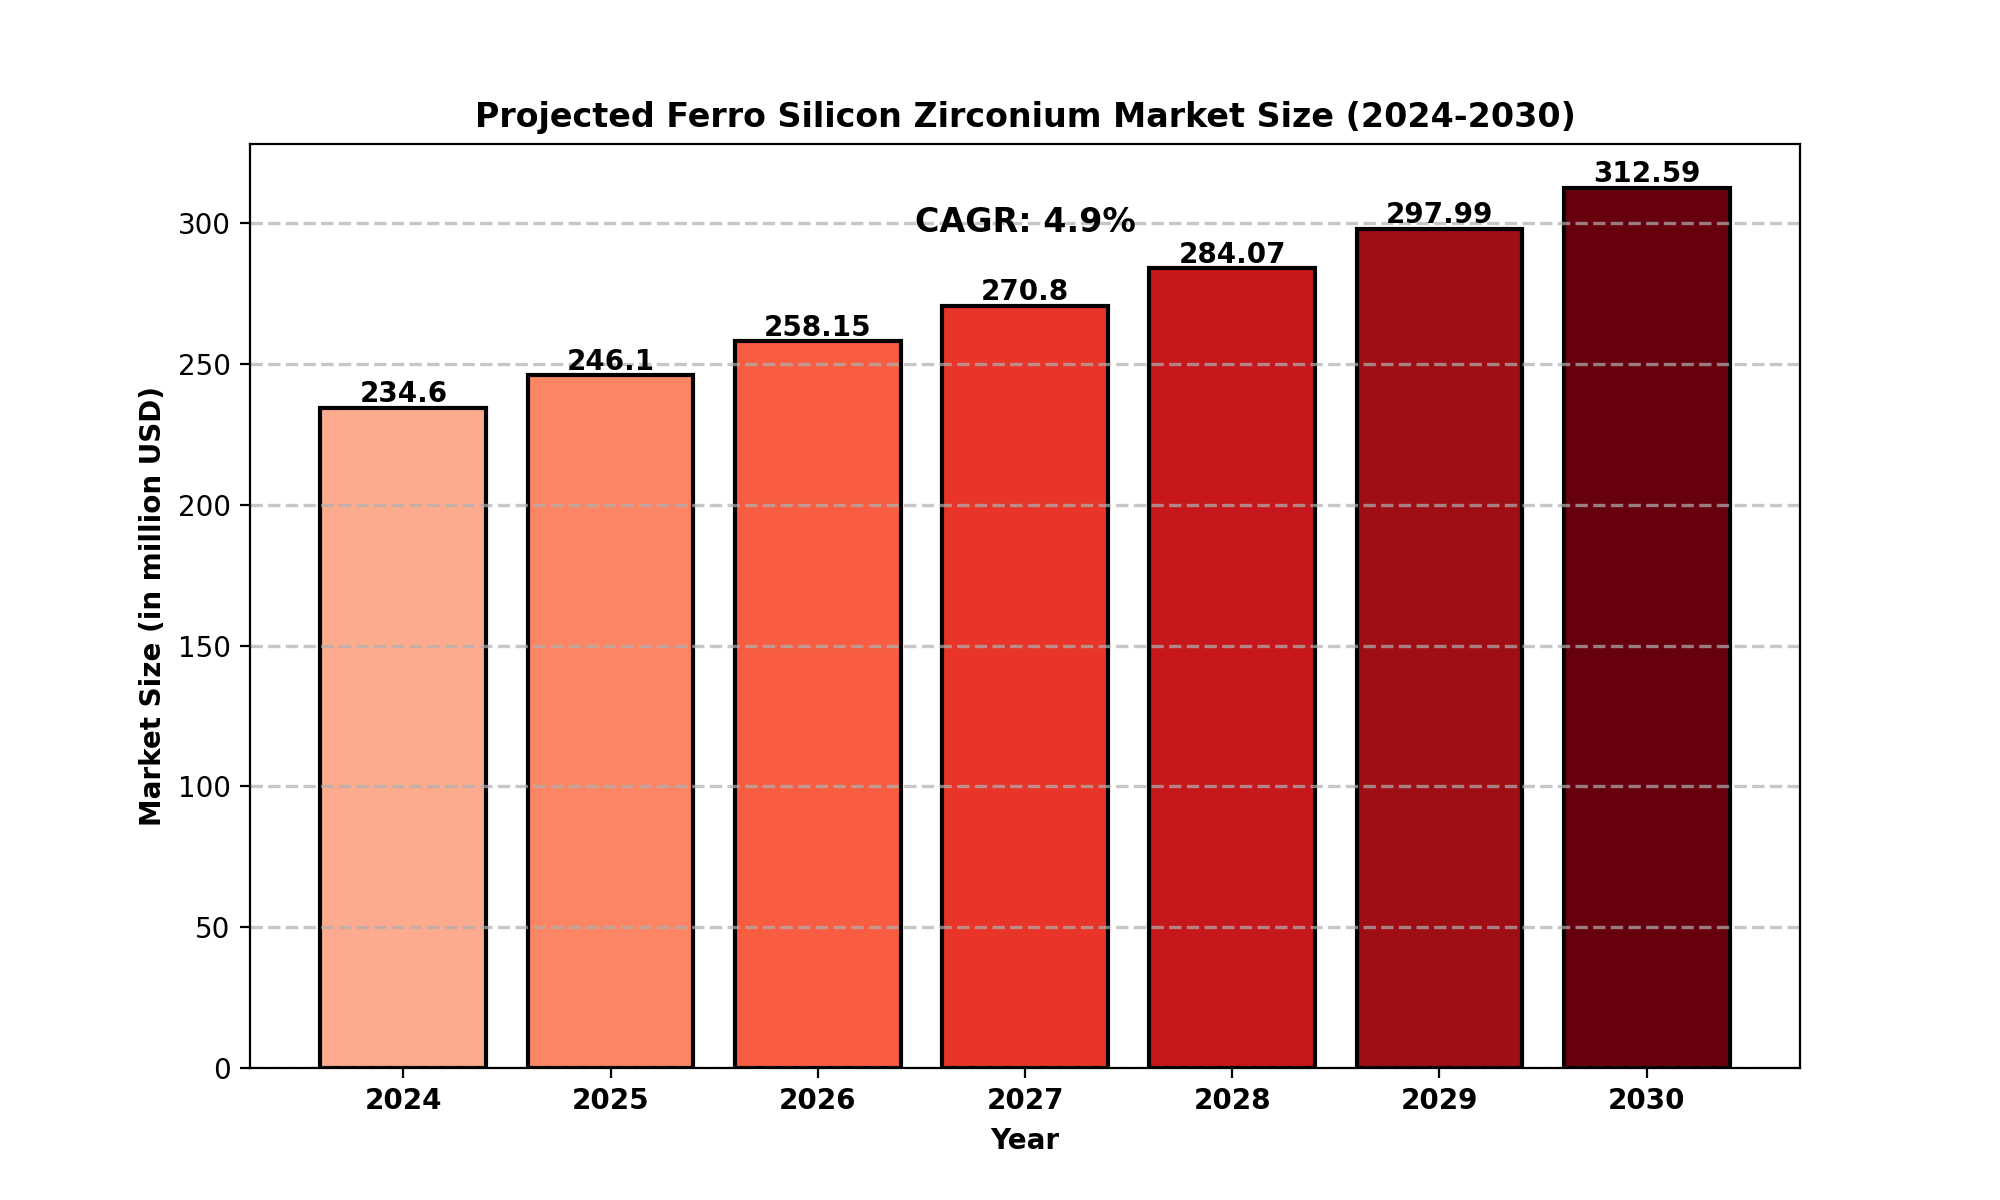
The global Ferro Silicon Zirconium market was valued at US$ 234.6 million in 2024 and is projected to reach US$ 312.5 million by 2030, growing at a CAGR of 4.9% during the forecast period.
In the United States, the market was valued at US$ 52.3 million in 2024 and is expected to reach US$ 67.5 million by 2030, with a CAGR of 4.3%.
The production volume in 2023 reached 85,000 metric tons, with Asia-Pacific and Europe accounting for 70% of global demand. Ductile iron casting remains the dominant end-user sector, comprising 75% of total consumption, while gray iron casting contributes 20%. The standard-grade segment (30-40% Si, 40-50% Zr) holds a 65% market share, and high-purity grades are experiencing an annual growth rate of 6%.
Market Dynamics (Drivers, Restraints, Opportunities, and Challenges)
Drivers
-
Growing Demand for Ductile Iron: The expanding automotive and industrial machinery sectors are driving the increased use of ductile iron, boosting demand for Ferro Silicon Zirconium.
-
Infrastructure Development: Rising investments in construction and heavy machinery are fueling market growth.
-
Advancements in Casting Technology: Increased adoption of fine-grain inoculants and nano-sized inoculants enhances casting efficiency and mechanical properties.
-
Electric Vehicle (EV) Growth: The transition to EVs is propelling demand for specialized Ferro Silicon Zirconium formulations for lightweight components.
Restraints
-
Raw Material Price Volatility: Supply chain disruptions led to 5% price fluctuations in 2023, impacting profitability.
-
Environmental Regulations: Stringent regulations on ferroalloy production pose compliance challenges.
Opportunities
-
Increased Use in Thin-Walled Castings: The demand for thin-walled ductile iron castings grew by 15% in 2023, highlighting lightweighting trends in automotive applications.
-
Recycling Initiatives: Recycling of zirconium-containing casting waste increased by 12% year-over-year, presenting sustainability opportunities.
Challenges
-
Supply Chain Constraints: Geopolitical instability and raw material scarcity may disrupt production.
-
Competition from Alternative Inoculants: Substitute materials may pose a threat to market expansion.
Regional Analysis
North America
Europe
-
Strong presence of automotive manufacturing in Germany, France, and the UK is driving market growth.
-
Stringent environmental regulations are encouraging innovation in eco-friendly Ferro Silicon Zirconium production.
Asia-Pacific
-
Dominates the market with China, Japan, and India leading in production and consumption.
-
Increased R&D investments in nano-inoculants are enhancing market potential.
South America & Middle East and Africa (MEA)
Competitor Analysis
Key Companies
Market Segmentation (by Type)
-
Zr45%-55%
-
Zr35%-45%
-
Zr30%-40%
Market Segmentation (by Application)
-
Welding Material
-
Spraying
-
Powder Metallurgy
Geographic Segmentation
-
North America (USA, Canada, Mexico)
-
Europe (Germany, UK, France, Russia, Italy, Rest of Europe)
-
Asia-Pacific (China, Japan, South Korea, India, Southeast Asia, Rest of Asia-Pacific)
-
South America (Brazil, Argentina, Columbia, Rest of South America)
-
Middle East & Africa (Saudi Arabia, UAE, Egypt, Nigeria, South Africa, Rest of MEA)
FAQ
What is the current market size of the Ferro Silicon Zirconium industry?
- The market was valued at US$ 234.6 million in 2024 and is projected to grow to US$ 312.8 million by 2030, at a CAGR of 4.9%.
Which are the key companies operating in the Ferro Silicon Zirconium market?
- Key players include Nizi International, Tennant Metallurgical Group, Stanford Advanced Materials, METCAST SERVICES, Anyang Cheegoole, Bisley & Company Pty, and Mainborn GmbH.
What are the key growth drivers in the Ferro Silicon Zirconium market?
- Growth is driven by expanding ductile iron production, increasing demand in automotive and industrial machinery, and technological advancements in casting efficiency.
Which regions dominate the Ferro Silicon Zirconium market?
- Asia-Pacific and Europe account for 70% of global demand, with China, Germany, and India leading consumption and production.
What are the emerging trends in the Ferro Silicon Zirconium market?
-
Increased use of fine grain inoculants (10% demand increase in 2023)
-
Rising adoption of nano-sized inoculants (20% growth in R&D investment in 2023)
-
Growth in lightweight thin-walled ductile iron castings (15% increase in demand)
Key Benefits of This Market Research:
- Industry drivers, restraints, and opportunities covered in the study
- Neutral perspective on the market performance
- Recent industry trends and developments
- Competitive landscape & strategies of key players
- Potential & niche segments and regions exhibiting promising growth covered
- Historical, current, and projected market size, in terms of value
- In-depth analysis of the Ferro Silicon Zirconium Market
- Overview of the regional outlook of the Ferro Silicon Zirconium Market:
Key Reasons to Buy this Report:
- Access to date statistics compiled by our researchers. These provide you with historical and forecast data, which is analyzed to tell you why your market is set to change
- This enables you to anticipate market changes to remain ahead of your competitors
- You will be able to copy data from the Excel spreadsheet straight into your marketing plans, business presentations, or other strategic documents
- The concise analysis, clear graph, and table format will enable you to pinpoint the information you require quickly
- Provision of market value (USD Billion) data for each segment and sub-segment
- Indicates the region and segment that is expected to witness the fastest growth as well as to dominate the market
- Analysis by geography highlighting the consumption of the product/service in the region as well as indicating the factors that are affecting the market within each region
- Competitive landscape which incorporates the market ranking of the major players, along with new service/product launches, partnerships, business expansions, and acquisitions in the past five years of companies profiled
- Extensive company profiles comprising of company overview, company insights, product benchmarking, and SWOT analysis for the major market players
- The current as well as the future market outlook of the industry concerning recent developments which involve growth opportunities and drivers as well as challenges and restraints of both emerging as well as developed regions
- Includes in-depth analysis of the market from various perspectives through Porter.
TABLE OF CONTENTS
Table of Contents
1 Research Methodology and Statistical Scope
1.1 Market Definition and Statistical Scope of Ferro Silicon Zirconium
1.2 Key Market Segments
1.2.1 Ferro Silicon Zirconium Segment by Type
1.2.2 Ferro Silicon Zirconium Segment by Application
1.3 Methodology & Sources of Information
1.3.1 Research Methodology
1.3.2 Research Process
1.3.3 Market Breakdown and Data Triangulation
1.3.4 Base Year
1.3.5 Report Assumptions & Caveats
2 Ferro Silicon Zirconium Market Overview
2.1 Global Market Overview
2.1.1 Global Ferro Silicon Zirconium Market Size (M USD) Estimates and Forecasts (2019-2030)
2.1.2 Global Ferro Silicon Zirconium Sales Estimates and Forecasts (2019-2030)
2.2 Market Segment Executive Summary
2.3 Global Market Size by Region
3 Ferro Silicon Zirconium Market Competitive Landscape
3.1 Global Ferro Silicon Zirconium Sales by Manufacturers (2019-2024)
3.2 Global Ferro Silicon Zirconium Revenue Market Share by Manufacturers (2019-2024)
3.3 Ferro Silicon Zirconium Market Share by Company Type (Tier 1, Tier 2, and Tier 3)
3.4 Global Ferro Silicon Zirconium Average Price by Manufacturers (2019-2024)
3.5 Manufacturers Ferro Silicon Zirconium Sales Sites, Area Served, Product Type
3.6 Ferro Silicon Zirconium Market Competitive Situation and Trends
3.6.1 Ferro Silicon Zirconium Market Concentration Rate
3.6.2 Global 5 and 10 Largest Ferro Silicon Zirconium Players Market Share by Revenue
3.6.3 Mergers & Acquisitions, Expansion
4 Ferro Silicon Zirconium Industry Chain Analysis
4.1 Ferro Silicon Zirconium Industry Chain Analysis
4.2 Market Overview of Key Raw Materials
4.3 Midstream Market Analysis
4.4 Downstream Customer Analysis
5 The Development and Dynamics of Ferro Silicon Zirconium Market
5.1 Key Development Trends
5.2 Driving Factors
5.3 Market Challenges
5.4 Market Restraints
5.5 Industry News
5.5.1 New Product Developments
5.5.2 Mergers & Acquisitions
5.5.3 Expansions
5.5.4 Collaboration/Supply Contracts
5.6 Industry Policies
6 Ferro Silicon Zirconium Market Segmentation by Type
6.1 Evaluation Matrix of Segment Market Development Potential (Type)
6.2 Global Ferro Silicon Zirconium Sales Market Share by Type (2019-2024)
6.3 Global Ferro Silicon Zirconium Market Size Market Share by Type (2019-2024)
6.4 Global Ferro Silicon Zirconium Price by Type (2019-2024)
7 Ferro Silicon Zirconium Market Segmentation by Application
7.1 Evaluation Matrix of Segment Market Development Potential (Application)
7.2 Global Ferro Silicon Zirconium Market Sales by Application (2019-2024)
7.3 Global Ferro Silicon Zirconium Market Size (M USD) by Application (2019-2024)
7.4 Global Ferro Silicon Zirconium Sales Growth Rate by Application (2019-2024)
8 Ferro Silicon Zirconium Market Segmentation by Region
8.1 Global Ferro Silicon Zirconium Sales by Region
8.1.1 Global Ferro Silicon Zirconium Sales by Region
8.1.2 Global Ferro Silicon Zirconium Sales Market Share by Region
8.2 North America
8.2.1 North America Ferro Silicon Zirconium Sales by Country
8.2.2 U.S.
8.2.3 Canada
8.2.4 Mexico
8.3 Europe
8.3.1 Europe Ferro Silicon Zirconium Sales by Country
8.3.2 Germany
8.3.3 France
8.3.4 U.K.
8.3.5 Italy
8.3.6 Russia
8.4 Asia Pacific
8.4.1 Asia Pacific Ferro Silicon Zirconium Sales by Region
8.4.2 China
8.4.3 Japan
8.4.4 South Korea
8.4.5 India
8.4.6 Southeast Asia
8.5 South America
8.5.1 South America Ferro Silicon Zirconium Sales by Country
8.5.2 Brazil
8.5.3 Argentina
8.5.4 Columbia
8.6 Middle East and Africa
8.6.1 Middle East and Africa Ferro Silicon Zirconium Sales by Region
8.6.2 Saudi Arabia
8.6.3 UAE
8.6.4 Egypt
8.6.5 Nigeria
8.6.6 South Africa
9 Key Companies Profile
9.1 Nizi International
9.1.1 Nizi International Ferro Silicon Zirconium Basic Information
9.1.2 Nizi International Ferro Silicon Zirconium Product Overview
9.1.3 Nizi International Ferro Silicon Zirconium Product Market Performance
9.1.4 Nizi International Business Overview
9.1.5 Nizi International Ferro Silicon Zirconium SWOT Analysis
9.1.6 Nizi International Recent Developments
9.2 Tennant Metallurgical Group
9.2.1 Tennant Metallurgical Group Ferro Silicon Zirconium Basic Information
9.2.2 Tennant Metallurgical Group Ferro Silicon Zirconium Product Overview
9.2.3 Tennant Metallurgical Group Ferro Silicon Zirconium Product Market Performance
9.2.4 Tennant Metallurgical Group Business Overview
9.2.5 Tennant Metallurgical Group Ferro Silicon Zirconium SWOT Analysis
9.2.6 Tennant Metallurgical Group Recent Developments
9.3 Stanford Advanced Materials
9.3.1 Stanford Advanced Materials Ferro Silicon Zirconium Basic Information
9.3.2 Stanford Advanced Materials Ferro Silicon Zirconium Product Overview
9.3.3 Stanford Advanced Materials Ferro Silicon Zirconium Product Market Performance
9.3.4 Stanford Advanced Materials Ferro Silicon Zirconium SWOT Analysis
9.3.5 Stanford Advanced Materials Business Overview
9.3.6 Stanford Advanced Materials Recent Developments
9.4 METCAST SERVICES
9.4.1 METCAST SERVICES Ferro Silicon Zirconium Basic Information
9.4.2 METCAST SERVICES Ferro Silicon Zirconium Product Overview
9.4.3 METCAST SERVICES Ferro Silicon Zirconium Product Market Performance
9.4.4 METCAST SERVICES Business Overview
9.4.5 METCAST SERVICES Recent Developments
9.5 Anyang Cheegoole
9.5.1 Anyang Cheegoole Ferro Silicon Zirconium Basic Information
9.5.2 Anyang Cheegoole Ferro Silicon Zirconium Product Overview
9.5.3 Anyang Cheegoole Ferro Silicon Zirconium Product Market Performance
9.5.4 Anyang Cheegoole Business Overview
9.5.5 Anyang Cheegoole Recent Developments
9.6 Bisley and Company Pty
9.6.1 Bisley and Company Pty Ferro Silicon Zirconium Basic Information
9.6.2 Bisley and Company Pty Ferro Silicon Zirconium Product Overview
9.6.3 Bisley and Company Pty Ferro Silicon Zirconium Product Market Performance
9.6.4 Bisley and Company Pty Business Overview
9.6.5 Bisley and Company Pty Recent Developments
9.7 Mainborn GmbH
9.7.1 Mainborn GmbH Ferro Silicon Zirconium Basic Information
9.7.2 Mainborn GmbH Ferro Silicon Zirconium Product Overview
9.7.3 Mainborn GmbH Ferro Silicon Zirconium Product Market Performance
9.7.4 Mainborn GmbH Business Overview
9.7.5 Mainborn GmbH Recent Developments
10 Ferro Silicon Zirconium Market Forecast by Region
10.1 Global Ferro Silicon Zirconium Market Size Forecast
10.2 Global Ferro Silicon Zirconium Market Forecast by Region
10.2.1 North America Market Size Forecast by Country
10.2.2 Europe Ferro Silicon Zirconium Market Size Forecast by Country
10.2.3 Asia Pacific Ferro Silicon Zirconium Market Size Forecast by Region
10.2.4 South America Ferro Silicon Zirconium Market Size Forecast by Country
10.2.5 Middle East and Africa Forecasted Consumption of Ferro Silicon Zirconium by Country
11 Forecast Market by Type and by Application (2025-2030)
11.1 Global Ferro Silicon Zirconium Market Forecast by Type (2025-2030)
11.1.1 Global Forecasted Sales of Ferro Silicon Zirconium by Type (2025-2030)
11.1.2 Global Ferro Silicon Zirconium Market Size Forecast by Type (2025-2030)
11.1.3 Global Forecasted Price of Ferro Silicon Zirconium by Type (2025-2030)
11.2 Global Ferro Silicon Zirconium Market Forecast by Application (2025-2030)
11.2.1 Global Ferro Silicon Zirconium Sales (Kilotons) Forecast by Application
11.2.2 Global Ferro Silicon Zirconium Market Size (M USD) Forecast by Application (2025-2030)
12 Conclusion and Key Findings
LIST OF TABLES & FIGURES
List of Tables
Table 1. Introduction of the Type
Table 2. Introduction of the Application
Table 3. Market Size (M USD) Segment Executive Summary
Table 4. Ferro Silicon Zirconium Market Size Comparison by Region (M USD)
Table 5. Global Ferro Silicon Zirconium Sales (Kilotons) by Manufacturers (2019-2024)
Table 6. Global Ferro Silicon Zirconium Sales Market Share by Manufacturers (2019-2024)
Table 7. Global Ferro Silicon Zirconium Revenue (M USD) by Manufacturers (2019-2024)
Table 8. Global Ferro Silicon Zirconium Revenue Share by Manufacturers (2019-2024)
Table 9. Company Type (Tier 1, Tier 2, and Tier 3) & (based on the Revenue in Ferro Silicon Zirconium as of 2022)
Table 10. Global Market Ferro Silicon Zirconium Average Price (USD/Ton) of Key Manufacturers (2019-2024)
Table 11. Manufacturers Ferro Silicon Zirconium Sales Sites and Area Served
Table 12. Manufacturers Ferro Silicon Zirconium Product Type
Table 13. Global Ferro Silicon Zirconium Manufacturers Market Concentration Ratio (CR5 and HHI)
Table 14. Mergers & Acquisitions, Expansion Plans
Table 15. Industry Chain Map of Ferro Silicon Zirconium
Table 16. Market Overview of Key Raw Materials
Table 17. Midstream Market Analysis
Table 18. Downstream Customer Analysis
Table 19. Key Development Trends
Table 20. Driving Factors
Table 21. Ferro Silicon Zirconium Market Challenges
Table 22. Global Ferro Silicon Zirconium Sales by Type (Kilotons)
Table 23. Global Ferro Silicon Zirconium Market Size by Type (M USD)
Table 24. Global Ferro Silicon Zirconium Sales (Kilotons) by Type (2019-2024)
Table 25. Global Ferro Silicon Zirconium Sales Market Share by Type (2019-2024)
Table 26. Global Ferro Silicon Zirconium Market Size (M USD) by Type (2019-2024)
Table 27. Global Ferro Silicon Zirconium Market Size Share by Type (2019-2024)
Table 28. Global Ferro Silicon Zirconium Price (USD/Ton) by Type (2019-2024)
Table 29. Global Ferro Silicon Zirconium Sales (Kilotons) by Application
Table 30. Global Ferro Silicon Zirconium Market Size by Application
Table 31. Global Ferro Silicon Zirconium Sales by Application (2019-2024) & (Kilotons)
Table 32. Global Ferro Silicon Zirconium Sales Market Share by Application (2019-2024)
Table 33. Global Ferro Silicon Zirconium Sales by Application (2019-2024) & (M USD)
Table 34. Global Ferro Silicon Zirconium Market Share by Application (2019-2024)
Table 35. Global Ferro Silicon Zirconium Sales Growth Rate by Application (2019-2024)
Table 36. Global Ferro Silicon Zirconium Sales by Region (2019-2024) & (Kilotons)
Table 37. Global Ferro Silicon Zirconium Sales Market Share by Region (2019-2024)
Table 38. North America Ferro Silicon Zirconium Sales by Country (2019-2024) & (Kilotons)
Table 39. Europe Ferro Silicon Zirconium Sales by Country (2019-2024) & (Kilotons)
Table 40. Asia Pacific Ferro Silicon Zirconium Sales by Region (2019-2024) & (Kilotons)
Table 41. South America Ferro Silicon Zirconium Sales by Country (2019-2024) & (Kilotons)
Table 42. Middle East and Africa Ferro Silicon Zirconium Sales by Region (2019-2024) & (Kilotons)
Table 43. Nizi International Ferro Silicon Zirconium Basic Information
Table 44. Nizi International Ferro Silicon Zirconium Product Overview
Table 45. Nizi International Ferro Silicon Zirconium Sales (Kilotons), Revenue (M USD), Price (USD/Ton) and Gross Margin (2019-2024)
Table 46. Nizi International Business Overview
Table 47. Nizi International Ferro Silicon Zirconium SWOT Analysis
Table 48. Nizi International Recent Developments
Table 49. Tennant Metallurgical Group Ferro Silicon Zirconium Basic Information
Table 50. Tennant Metallurgical Group Ferro Silicon Zirconium Product Overview
Table 51. Tennant Metallurgical Group Ferro Silicon Zirconium Sales (Kilotons), Revenue (M USD), Price (USD/Ton) and Gross Margin (2019-2024)
Table 52. Tennant Metallurgical Group Business Overview
Table 53. Tennant Metallurgical Group Ferro Silicon Zirconium SWOT Analysis
Table 54. Tennant Metallurgical Group Recent Developments
Table 55. Stanford Advanced Materials Ferro Silicon Zirconium Basic Information
Table 56. Stanford Advanced Materials Ferro Silicon Zirconium Product Overview
Table 57. Stanford Advanced Materials Ferro Silicon Zirconium Sales (Kilotons), Revenue (M USD), Price (USD/Ton) and Gross Margin (2019-2024)
Table 58. Stanford Advanced Materials Ferro Silicon Zirconium SWOT Analysis
Table 59. Stanford Advanced Materials Business Overview
Table 60. Stanford Advanced Materials Recent Developments
Table 61. METCAST SERVICES Ferro Silicon Zirconium Basic Information
Table 62. METCAST SERVICES Ferro Silicon Zirconium Product Overview
Table 63. METCAST SERVICES Ferro Silicon Zirconium Sales (Kilotons), Revenue (M USD), Price (USD/Ton) and Gross Margin (2019-2024)
Table 64. METCAST SERVICES Business Overview
Table 65. METCAST SERVICES Recent Developments
Table 66. Anyang Cheegoole Ferro Silicon Zirconium Basic Information
Table 67. Anyang Cheegoole Ferro Silicon Zirconium Product Overview
Table 68. Anyang Cheegoole Ferro Silicon Zirconium Sales (Kilotons), Revenue (M USD), Price (USD/Ton) and Gross Margin (2019-2024)
Table 69. Anyang Cheegoole Business Overview
Table 70. Anyang Cheegoole Recent Developments
Table 71. Bisley and Company Pty Ferro Silicon Zirconium Basic Information
Table 72. Bisley and Company Pty Ferro Silicon Zirconium Product Overview
Table 73. Bisley and Company Pty Ferro Silicon Zirconium Sales (Kilotons), Revenue (M USD), Price (USD/Ton) and Gross Margin (2019-2024)
Table 74. Bisley and Company Pty Business Overview
Table 75. Bisley and Company Pty Recent Developments
Table 76. Mainborn GmbH Ferro Silicon Zirconium Basic Information
Table 77. Mainborn GmbH Ferro Silicon Zirconium Product Overview
Table 78. Mainborn GmbH Ferro Silicon Zirconium Sales (Kilotons), Revenue (M USD), Price (USD/Ton) and Gross Margin (2019-2024)
Table 79. Mainborn GmbH Business Overview
Table 80. Mainborn GmbH Recent Developments
Table 81. Global Ferro Silicon Zirconium Sales Forecast by Region (2025-2030) & (Kilotons)
Table 82. Global Ferro Silicon Zirconium Market Size Forecast by Region (2025-2030) & (M USD)
Table 83. North America Ferro Silicon Zirconium Sales Forecast by Country (2025-2030) & (Kilotons)
Table 84. North America Ferro Silicon Zirconium Market Size Forecast by Country (2025-2030) & (M USD)
Table 85. Europe Ferro Silicon Zirconium Sales Forecast by Country (2025-2030) & (Kilotons)
Table 86. Europe Ferro Silicon Zirconium Market Size Forecast by Country (2025-2030) & (M USD)
Table 87. Asia Pacific Ferro Silicon Zirconium Sales Forecast by Region (2025-2030) & (Kilotons)
Table 88. Asia Pacific Ferro Silicon Zirconium Market Size Forecast by Region (2025-2030) & (M USD)
Table 89. South America Ferro Silicon Zirconium Sales Forecast by Country (2025-2030) & (Kilotons)
Table 90. South America Ferro Silicon Zirconium Market Size Forecast by Country (2025-2030) & (M USD)
Table 91. Middle East and Africa Ferro Silicon Zirconium Consumption Forecast by Country (2025-2030) & (Units)
Table 92. Middle East and Africa Ferro Silicon Zirconium Market Size Forecast by Country (2025-2030) & (M USD)
Table 93. Global Ferro Silicon Zirconium Sales Forecast by Type (2025-2030) & (Kilotons)
Table 94. Global Ferro Silicon Zirconium Market Size Forecast by Type (2025-2030) & (M USD)
Table 95. Global Ferro Silicon Zirconium Price Forecast by Type (2025-2030) & (USD/Ton)
Table 96. Global Ferro Silicon Zirconium Sales (Kilotons) Forecast by Application (2025-2030)
Table 97. Global Ferro Silicon Zirconium Market Size Forecast by Application (2025-2030) & (M USD)
List of Figures
Figure 1. Product Picture of Ferro Silicon Zirconium
Figure 2. Data Triangulation
Figure 3. Key Caveats
Figure 4. Global Ferro Silicon Zirconium Market Size (M USD), 2019-2030
Figure 5. Global Ferro Silicon Zirconium Market Size (M USD) (2019-2030)
Figure 6. Global Ferro Silicon Zirconium Sales (Kilotons) & (2019-2030)
Figure 7. Evaluation Matrix of Segment Market Development Potential (Type)
Figure 8. Evaluation Matrix of Segment Market Development Potential (Application)
Figure 9. Evaluation Matrix of Regional Market Development Potential
Figure 10. Ferro Silicon Zirconium Market Size by Country (M USD)
Figure 11. Ferro Silicon Zirconium Sales Share by Manufacturers in 2023
Figure 12. Global Ferro Silicon Zirconium Revenue Share by Manufacturers in 2023
Figure 13. Ferro Silicon Zirconium Market Share by Company Type (Tier 1, Tier 2 and Tier 3): 2023
Figure 14. Global Market Ferro Silicon Zirconium Average Price (USD/Ton) of Key Manufacturers in 2023
Figure 15. The Global 5 and 10 Largest Players: Market Share by Ferro Silicon Zirconium Revenue in 2023
Figure 16. Evaluation Matrix of Segment Market Development Potential (Type)
Figure 17. Global Ferro Silicon Zirconium Market Share by Type
Figure 18. Sales Market Share of Ferro Silicon Zirconium by Type (2019-2024)
Figure 19. Sales Market Share of Ferro Silicon Zirconium by Type in 2023
Figure 20. Market Size Share of Ferro Silicon Zirconium by Type (2019-2024)
Figure 21. Market Size Market Share of Ferro Silicon Zirconium by Type in 2023
Figure 22. Evaluation Matrix of Segment Market Development Potential (Application)
Figure 23. Global Ferro Silicon Zirconium Market Share by Application
Figure 24. Global Ferro Silicon Zirconium Sales Market Share by Application (2019-2024)
Figure 25. Global Ferro Silicon Zirconium Sales Market Share by Application in 2023
Figure 26. Global Ferro Silicon Zirconium Market Share by Application (2019-2024)
Figure 27. Global Ferro Silicon Zirconium Market Share by Application in 2023
Figure 28. Global Ferro Silicon Zirconium Sales Growth Rate by Application (2019-2024)
Figure 29. Global Ferro Silicon Zirconium Sales Market Share by Region (2019-2024)
Figure 30. North America Ferro Silicon Zirconium Sales and Growth Rate (2019-2024) & (Kilotons)
Figure 31. North America Ferro Silicon Zirconium Sales Market Share by Country in 2023
Figure 32. U.S. Ferro Silicon Zirconium Sales and Growth Rate (2019-2024) & (Kilotons)
Figure 33. Canada Ferro Silicon Zirconium Sales (Kilotons) and Growth Rate (2019-2024)
Figure 34. Mexico Ferro Silicon Zirconium Sales (Units) and Growth Rate (2019-2024)
Figure 35. Europe Ferro Silicon Zirconium Sales and Growth Rate (2019-2024) & (Kilotons)
Figure 36. Europe Ferro Silicon Zirconium Sales Market Share by Country in 2023
Figure 37. Germany Ferro Silicon Zirconium Sales and Growth Rate (2019-2024) & (Kilotons)
Figure 38. France Ferro Silicon Zirconium Sales and Growth Rate (2019-2024) & (Kilotons)
Figure 39. U.K. Ferro Silicon Zirconium Sales and Growth Rate (2019-2024) & (Kilotons)
Figure 40. Italy Ferro Silicon Zirconium Sales and Growth Rate (2019-2024) & (Kilotons)
Figure 41. Russia Ferro Silicon Zirconium Sales and Growth Rate (2019-2024) & (Kilotons)
Figure 42. Asia Pacific Ferro Silicon Zirconium Sales and Growth Rate (Kilotons)
Figure 43. Asia Pacific Ferro Silicon Zirconium Sales Market Share by Region in 2023
Figure 44. China Ferro Silicon Zirconium Sales and Growth Rate (2019-2024) & (Kilotons)
Figure 45. Japan Ferro Silicon Zirconium Sales and Growth Rate (2019-2024) & (Kilotons)
Figure 46. South Korea Ferro Silicon Zirconium Sales and Growth Rate (2019-2024) & (Kilotons)
Figure 47. India Ferro Silicon Zirconium Sales and Growth Rate (2019-2024) & (Kilotons)
Figure 48. Southeast Asia Ferro Silicon Zirconium Sales and Growth Rate (2019-2024) & (Kilotons)
Figure 49. South America Ferro Silicon Zirconium Sales and Growth Rate (Kilotons)
Figure 50. South America Ferro Silicon Zirconium Sales Market Share by Country in 2023
Figure 51. Brazil Ferro Silicon Zirconium Sales and Growth Rate (2019-2024) & (Kilotons)
Figure 52. Argentina Ferro Silicon Zirconium Sales and Growth Rate (2019-2024) & (Kilotons)
Figure 53. Columbia Ferro Silicon Zirconium Sales and Growth Rate (2019-2024) & (Kilotons)
Figure 54. Middle East and Africa Ferro Silicon Zirconium Sales and Growth Rate (Kilotons)
Figure 55. Middle East and Africa Ferro Silicon Zirconium Sales Market Share by Region in 2023
Figure 56. Saudi Arabia Ferro Silicon Zirconium Sales and Growth Rate (2019-2024) & (Kilotons)
Figure 57. UAE Ferro Silicon Zirconium Sales and Growth Rate (2019-2024) & (Kilotons)
Figure 58. Egypt Ferro Silicon Zirconium Sales and Growth Rate (2019-2024) & (Kilotons)
Figure 59. Nigeria Ferro Silicon Zirconium Sales and Growth Rate (2019-2024) & (Kilotons)
Figure 60. South Africa Ferro Silicon Zirconium Sales and Growth Rate (2019-2024) & (Kilotons)
Figure 61. Global Ferro Silicon Zirconium Sales Forecast by Volume (2019-2030) & (Kilotons)
Figure 62. Global Ferro Silicon Zirconium Market Size Forecast by Value (2019-2030) & (M USD)
Figure 63. Global Ferro Silicon Zirconium Sales Market Share Forecast by Type (2025-2030)
Figure 64. Global Ferro Silicon Zirconium Market Share Forecast by Type (2025-2030)
Figure 65. Global Ferro Silicon Zirconium Sales Forecast by Application (2025-2030)
Figure 66. Global Ferro Silicon Zirconium Market Share Forecast by Application (2025-2030)
")
