Hydrological Engineering Services refers to the application of hydrological technologies and engineering principles to manage and utilize water resources effectively. These services play a crucial role in water conservancy projects, water resource management, and environmental protection. Key aspects include hydrological surveys, hydrological analysis, water quality monitoring, and hydrological engineering design. This market is integral to sustainable water management, urban planning, and infrastructure development.
Market Size
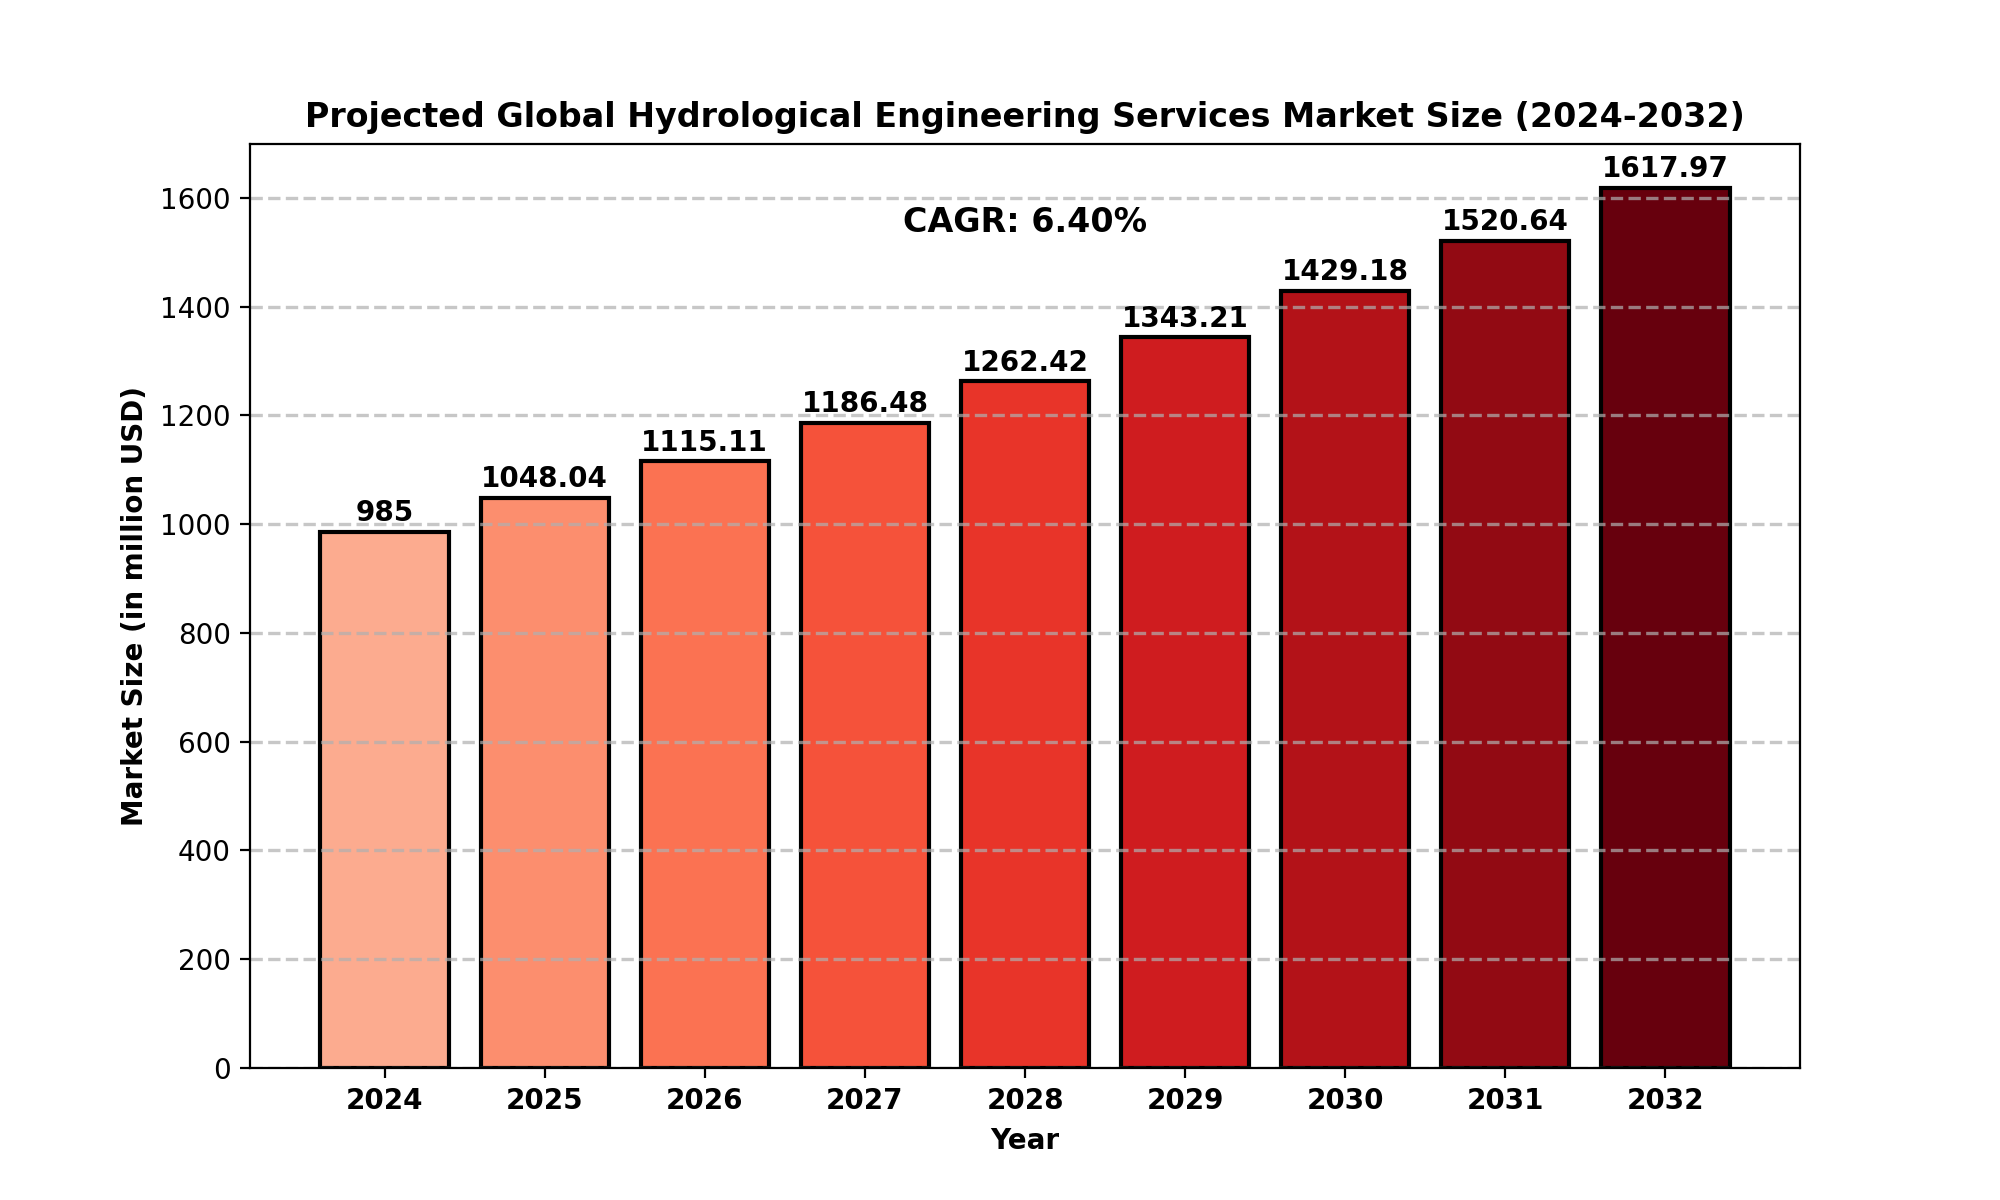
The global Hydrological Engineering Services market was valued at USD 985 million in 2024 and is projected to grow to USD 1,617.97 million by 2032, reflecting a CAGR of 6.40% during the forecast period.
North America alone is estimated to hold a market share of USD 285.59 million in 2024, growing at a CAGR of 5.49% from 2025 to 2032.
The increasing demand for sustainable water resource management and government initiatives for environmental conservation contribute significantly to this growth.
Market Dynamics
Drivers
-
Rising Concerns for Water Scarcity: Increasing global water scarcity has led to a surge in demand for hydrological engineering services to optimize water usage.
-
Government Regulations: Strict regulations and initiatives regarding water conservation and pollution control drive market growth.
-
Urbanization & Infrastructure Development: Rapid urbanization and smart city projects are increasing the need for efficient water resource management.
-
Technological Advancements: AI and IoT-based hydrological monitoring systems are revolutionizing the industry.
Restraints
-
High Initial Investment: Implementing advanced hydrological engineering solutions requires significant capital.
-
Lack of Awareness: Many developing nations still lack awareness regarding the importance of hydrological engineering services.
-
Complex Regulatory Frameworks: Stringent environmental regulations may hinder market expansion.
Opportunities
-
Integration of AI & Big Data Analytics: The use of advanced data analytics and AI-driven predictive models can enhance hydrological forecasting.
-
Emerging Markets in Asia-Pacific: Increasing investments in water infrastructure create growth opportunities in the region.
-
Public-Private Partnerships (PPP): Governments partnering with private firms for water management projects will drive market expansion.
Challenges
-
Climate Change Impact: Unpredictable climate changes affect water availability and demand, creating uncertainty in hydrological planning.
-
Data Privacy & Security Risks: The use of cloud-based hydrological monitoring systems raises concerns about data security.
Regional Analysis
North America
-
Market size: USD 285.59 million in 2024.
-
Strong regulatory frameworks and high investment in water conservation projects drive growth.
-
Key players include WSP, Hydro Inc., and Jones & Wagener.
Europe
-
Strong emphasis on environmental sustainability and smart water management systems.
-
Germany, UK, and France lead the market with ongoing hydrological research initiatives.
Asia-Pacific
-
Rapid urbanization and industrialization increase demand for hydrological services.
-
China, India, and Japan invest heavily in water resource management projects.
South America & Middle East/Africa
Competitor Analysis
The Hydrological Engineering Services market features a competitive landscape with key players adopting strategies like mergers, acquisitions, and partnerships to expand their market presence.
Key Companies
Market Segmentation (by Type)
-
Groundwater and Water Services
-
Water Quality Monitoring Services
-
Surface Water Measurement Services
-
Water Treatment Services
Market Segmentation (by Application)
-
Municipal
-
Geology
-
Mining
-
Water Treatment
-
Others
Geographic Segmentation
-
North America (USA, Canada, Mexico)
-
Europe (Germany, UK, France, Russia, Italy, Rest of Europe)
-
Asia-Pacific (China, Japan, South Korea, India, Southeast Asia, Rest of Asia-Pacific)
-
South America (Brazil, Argentina, Colombia, Rest of South America)
-
Middle East & Africa (Saudi Arabia, UAE, Egypt, Nigeria, South Africa, Rest of MEA)
FAQs
1. What is the current market size of the Hydrological Engineering Services market?
- The market is valued at USD 985 million in 2024 and is projected to reach USD 1,721.52 million by 2032.
2. Which companies dominate the Hydrological Engineering Services market?
- Key players include Arup, WSP, Hydro Inc., Gomez and Sullivan Engineers, and Jones & Wagener.
3. What are the key growth drivers in the Hydrological Engineering Services market?
- The market is driven by water scarcity concerns, government regulations, urbanization, and technological advancements.
4. Which regions dominate the Hydrological Engineering Services market?
- North America, Europe, and Asia-Pacific lead the market due to strong regulatory frameworks and investments in water infrastructure.
5. What are the emerging trends in the Hydrological Engineering Services market?
- Emerging trends include AI-based hydrological forecasting, IoT-enabled water monitoring, and public-private partnerships for water resource management.
Key Benefits of This Market Research:
-
Industry drivers, restraints, and opportunities covered in the study
-
Neutral perspective on the market performance
-
Recent industry trends and developments
-
Competitive landscape & strategies of key players
-
Potential & niche segments and regions exhibiting promising growth covered
-
Historical, current, and projected market size, in terms of value
-
In-depth analysis of the Hydrological Engineering Services Market
-
Overview of the regional outlook of the Hydrological Engineering Services Market:
Key Reasons to Buy this Report:
-
Access to date statistics compiled by our researchers. These provide you with historical and forecast data, which is analyzed to tell you why your market is set to change
-
This enables you to anticipate market changes to remain ahead of your competitors
-
You will be able to copy data from the Excel spreadsheet straight into your marketing plans, business presentations, or other strategic documents
-
The concise analysis, clear graph, and table format will enable you to pinpoint the information you require quickly
-
Provision of market value data for each segment and sub-segment
-
Indicates the region and segment that is expected to witness the fastest growth as well as to dominate the market
-
Analysis by geography highlighting the consumption of the product/service in the region as well as indicating the factors that are affecting the market within each region
-
Competitive landscape which incorporates the market ranking of the major players, along with new service/product launches, partnerships, business expansions, and acquisitions in the past five years of companies profiled
-
Extensive company profiles comprising of company overview, company insights, product benchmarking, and SWOT analysis for the major market players
-
The current as well as the future market outlook of the industry concerning recent developments which involve growth opportunities and drivers as well as challenges and restraints of both emerging as well as developed regions
-
Includes in-depth analysis of the market from various perspectives through Porters five forces analysis
-
Provides insight into the market through Value Chain
-
Market dynamics scenario, along with growth opportunities of the market in the years to come
-
6-month post-sales analyst support
Customization of the Report
Chapter Outline
-
Chapter 1 mainly introduces the statistical scope of the report, market division standards, and market research methods.
-
Chapter 2 is an executive summary of different market segments (by region, product type, application, etc), including the market size of each market segment, future development potential, and so on. It offers a high-level view of the current state of the Hydrological Engineering Services Market and its likely evolution in the short to mid-term, and long term.
-
Chapter 3 makes a detailed analysis of the market's competitive landscape of the market and provides the market share, capacity, output, price, latest development plan, merger, and acquisition information of the main manufacturers in the market.
-
Chapter 4 is the analysis of the whole market industrial chain, including the upstream and downstream of the industry, as well as Porter's five forces analysis.
-
Chapter 5 introduces the latest developments of the market, the driving factors and restrictive factors of the market, the challenges and risks faced by manufacturers in the industry, and the analysis of relevant policies in the industry.
-
Chapter 6 provides the analysis of various market segments according to product types, covering the market size and development potential of each market segment, to help readers find the blue ocean market in different market segments.
-
Chapter 7 provides the analysis of various market segments according to application, covering the market size and development potential of each market segment, to help readers find the blue ocean market in different downstream markets.
-
Chapter 8 provides a quantitative analysis of the market size and development potential of each region from the consumer side and its main countries and introduces the market development, future development prospects, market space, and capacity of each country in the world.
-
Chapter 9 shares the main producing countries of Hydrological Engineering Services, their output value, profit level, regional supply, production capacity layout, etc. from the supply side.
-
Chapter 10 introduces the basic situation of the main companies in the market in detail, including product sales revenue, sales volume, price, gross profit margin, market share, product introduction, recent development, etc.
-
Chapter 11 provides a quantitative analysis of the market size and development potential of each region during the forecast period.
-
Chapter 12 provides a quantitative analysis of the market size and development potential of each market segment during the forecast period.
-
Chapter 13 is the main points and conclusions of the report.
TABLE OF CONTENTS
Table of Contents
1 Research Methodology and Statistical Scope
1.1 Market Definition and Statistical Scope of Hydrological Engineering Services
1.2 Key Market Segments
1.2.1 Hydrological Engineering Services Segment by Type
1.2.2 Hydrological Engineering Services Segment by Application
1.3 Methodology & Sources of Information
1.3.1 Research Methodology
1.3.2 Research Process
1.3.3 Market Breakdown and Data Triangulation
1.3.4 Base Year
1.3.5 Report Assumptions & Caveats
2 Hydrological Engineering Services Market Overview
2.1 Global Market Overview
2.2 Market Segment Executive Summary
2.3 Global Market Size by Region
3 Hydrological Engineering Services Market Competitive Landscape
3.1 Global Hydrological Engineering Services Revenue Market Share by Company (2019-2025)
3.2 Hydrological Engineering Services Market Share by Company Type (Tier 1, Tier 2, and Tier 3)
3.3 Company Hydrological Engineering Services Market Size Sites, Area Served, Product Type
3.4 Hydrological Engineering Services Market Competitive Situation and Trends
3.4.1 Hydrological Engineering Services Market Concentration Rate
3.4.2 Global 5 and 10 Largest Hydrological Engineering Services Players Market Share by Revenue
3.4.3 Mergers & Acquisitions, Expansion
4 Hydrological Engineering Services Value Chain Analysis
4.1 Hydrological Engineering Services Value Chain Analysis
4.2 Midstream Market Analysis
4.3 Downstream Customer Analysis
5 The Development and Dynamics of Hydrological Engineering Services Market
5.1 Key Development Trends
5.2 Driving Factors
5.3 Market Challenges
5.4 Market Restraints
5.5 Industry News
5.5.1 Mergers & Acquisitions
5.5.2 Expansions
5.5.3 Collaboration/Supply Contracts
5.6 Industry Policies
6 Hydrological Engineering Services Market Segmentation by Type
6.1 Evaluation Matrix of Segment Market Development Potential (Type)
6.2 Global Hydrological Engineering Services Market Size Market Share by Type (2019-2025)
6.3 Global Hydrological Engineering Services Market Size Growth Rate by Type (2019-2025)
7 Hydrological Engineering Services Market Segmentation by Application
7.1 Evaluation Matrix of Segment Market Development Potential (Application)
7.2 Global Hydrological Engineering Services Market Size (M USD) by Application (2019-2025)
7.3 Global Hydrological Engineering Services Market Size Growth Rate by Application (2019-2025)
8 Hydrological Engineering Services Market Segmentation by Region
8.1 Global Hydrological Engineering Services Market Size by Region
8.1.1 Global Hydrological Engineering Services Market Size by Region
8.1.2 Global Hydrological Engineering Services Market Size Market Share by Region
8.2 North America
8.2.1 North America Hydrological Engineering Services Market Size by Country
8.2.2 U.S.
8.2.3 Canada
8.2.4 Mexico
8.3 Europe
8.3.1 Europe Hydrological Engineering Services Market Size by Country
8.3.2 Germany
8.3.3 France
8.3.4 U.K.
8.3.5 Italy
8.3.6 Russia
8.4 Asia Pacific
8.4.1 Asia Pacific Hydrological Engineering Services Market Size by Region
8.4.2 China
8.4.3 Japan
8.4.4 South Korea
8.4.5 India
8.4.6 Southeast Asia
8.5 South America
8.5.1 South America Hydrological Engineering Services Market Size by Country
8.5.2 Brazil
8.5.3 Argentina
8.5.4 Columbia
8.6 Middle East and Africa
8.6.1 Middle East and Africa Hydrological Engineering Services Market Size by Region
8.6.2 Saudi Arabia
8.6.3 UAE
8.6.4 Egypt
8.6.5 Nigeria
8.6.6 South Africa
9 Key Companies Profile
9.1 Arup
9.1.1 Arup Hydrological Engineering Services Basic Information
9.1.2 Arup Hydrological Engineering Services Product Overview
9.1.3 Arup Hydrological Engineering Services Product Market Performance
9.1.4 Arup Hydrological Engineering Services SWOT Analysis
9.1.5 Arup Business Overview
9.1.6 Arup Recent Developments
9.2 Pattle Delamore Partners
9.2.1 Pattle Delamore Partners Hydrological Engineering Services Basic Information
9.2.2 Pattle Delamore Partners Hydrological Engineering Services Product Overview
9.2.3 Pattle Delamore Partners Hydrological Engineering Services Product Market Performance
9.2.4 Pattle Delamore Partners Hydrological Engineering Services SWOT Analysis
9.2.5 Pattle Delamore Partners Business Overview
9.2.6 Pattle Delamore Partners Recent Developments
9.3 JE Fuller
9.3.1 JE Fuller Hydrological Engineering Services Basic Information
9.3.2 JE Fuller Hydrological Engineering Services Product Overview
9.3.3 JE Fuller Hydrological Engineering Services Product Market Performance
9.3.4 JE Fuller Hydrological Engineering Services SWOT Analysis
9.3.5 JE Fuller Business Overview
9.3.6 JE Fuller Recent Developments
9.4 OSKA Consulting Group
9.4.1 OSKA Consulting Group Hydrological Engineering Services Basic Information
9.4.2 OSKA Consulting Group Hydrological Engineering Services Product Overview
9.4.3 OSKA Consulting Group Hydrological Engineering Services Product Market Performance
9.4.4 OSKA Consulting Group Business Overview
9.4.5 OSKA Consulting Group Recent Developments
9.5 Suvastu Engineering
9.5.1 Suvastu Engineering Hydrological Engineering Services Basic Information
9.5.2 Suvastu Engineering Hydrological Engineering Services Product Overview
9.5.3 Suvastu Engineering Hydrological Engineering Services Product Market Performance
9.5.4 Suvastu Engineering Business Overview
9.5.5 Suvastu Engineering Recent Developments
9.6 Construction Journal
9.6.1 Construction Journal Hydrological Engineering Services Basic Information
9.6.2 Construction Journal Hydrological Engineering Services Product Overview
9.6.3 Construction Journal Hydrological Engineering Services Product Market Performance
9.6.4 Construction Journal Business Overview
9.6.5 Construction Journal Recent Developments
9.7 Clarkebond
9.7.1 Clarkebond Hydrological Engineering Services Basic Information
9.7.2 Clarkebond Hydrological Engineering Services Product Overview
9.7.3 Clarkebond Hydrological Engineering Services Product Market Performance
9.7.4 Clarkebond Business Overview
9.7.5 Clarkebond Recent Developments
9.8 Mannvit
9.8.1 Mannvit Hydrological Engineering Services Basic Information
9.8.2 Mannvit Hydrological Engineering Services Product Overview
9.8.3 Mannvit Hydrological Engineering Services Product Market Performance
9.8.4 Mannvit Business Overview
9.8.5 Mannvit Recent Developments
9.9 Turner Group
9.9.1 Turner Group Hydrological Engineering Services Basic Information
9.9.2 Turner Group Hydrological Engineering Services Product Overview
9.9.3 Turner Group Hydrological Engineering Services Product Market Performance
9.9.4 Turner Group Business Overview
9.9.5 Turner Group Recent Developments
9.10 ProDESIGN
9.10.1 ProDESIGN Hydrological Engineering Services Basic Information
9.10.2 ProDESIGN Hydrological Engineering Services Product Overview
9.10.3 ProDESIGN Hydrological Engineering Services Product Market Performance
9.10.4 ProDESIGN Business Overview
9.10.5 ProDESIGN Recent Developments
9.11 Jones and Wagener
9.11.1 Jones and Wagener Hydrological Engineering Services Basic Information
9.11.2 Jones and Wagener Hydrological Engineering Services Product Overview
9.11.3 Jones and Wagener Hydrological Engineering Services Product Market Performance
9.11.4 Jones and Wagener Business Overview
9.11.5 Jones and Wagener Recent Developments
9.12 Hydro
9.12.1 Hydro Hydrological Engineering Services Basic Information
9.12.2 Hydro Hydrological Engineering Services Product Overview
9.12.3 Hydro Hydrological Engineering Services Product Market Performance
9.12.4 Hydro Business Overview
9.12.5 Hydro Recent Developments
9.13 Inc
9.13.1 Inc Hydrological Engineering Services Basic Information
9.13.2 Inc Hydrological Engineering Services Product Overview
9.13.3 Inc Hydrological Engineering Services Product Market Performance
9.13.4 Inc Business Overview
9.13.5 Inc Recent Developments
9.14 WSP
9.14.1 WSP Hydrological Engineering Services Basic Information
9.14.2 WSP Hydrological Engineering Services Product Overview
9.14.3 WSP Hydrological Engineering Services Product Market Performance
9.14.4 WSP Business Overview
9.14.5 WSP Recent Developments
9.15 Gomez and Sullivan Engineers
9.15.1 Gomez and Sullivan Engineers Hydrological Engineering Services Basic Information
9.15.2 Gomez and Sullivan Engineers Hydrological Engineering Services Product Overview
9.15.3 Gomez and Sullivan Engineers Hydrological Engineering Services Product Market Performance
9.15.4 Gomez and Sullivan Engineers Business Overview
9.15.5 Gomez and Sullivan Engineers Recent Developments
10 Hydrological Engineering Services Regional Market Forecast
10.1 Global Hydrological Engineering Services Market Size Forecast
10.2 Global Hydrological Engineering Services Market Forecast by Region
10.2.1 North America Market Size Forecast by Country
10.2.2 Europe Hydrological Engineering Services Market Size Forecast by Country
10.2.3 Asia Pacific Hydrological Engineering Services Market Size Forecast by Region
10.2.4 South America Hydrological Engineering Services Market Size Forecast by Country
10.2.5 Middle East and Africa Forecasted Consumption of Hydrological Engineering Services by Country
11 Forecast Market by Type and by Application (2025-2032)
11.1 Global Hydrological Engineering Services Market Forecast by Type (2025-2032)
11.2 Global Hydrological Engineering Services Market Forecast by Application (2025-2032)
12 Conclusion and Key Findings
LIST OF TABLES & FIGURES
List of Tables
Table 1. Introduction of the Type
Table 2. Introduction of the Application
Table 3. Market Size (M USD) Segment Executive Summary
Table 4. Hydrological Engineering Services Market Size Comparison by Region (M USD)
Table 5. Global Hydrological Engineering Services Revenue (M USD) by Company (2019-2025)
Table 6. Global Hydrological Engineering Services Revenue Share by Company (2019-2025)
Table 7. Company Type (Tier 1, Tier 2, and Tier 3) & (based on the Revenue in Hydrological Engineering Services as of 2022)
Table 8. Company Hydrological Engineering Services Market Size Sites and Area Served
Table 9. Company Hydrological Engineering Services Product Type
Table 10. Global Hydrological Engineering Services Company Market Concentration Ratio (CR5 and HHI)
Table 11. Mergers & Acquisitions, Expansion Plans
Table 12. Value Chain Map of Hydrological Engineering Services
Table 13. Midstream Market Analysis
Table 14. Downstream Customer Analysis
Table 15. Key Development Trends
Table 16. Driving Factors
Table 17. Hydrological Engineering Services Market Challenges
Table 18. Global Hydrological Engineering Services Market Size by Type (M USD)
Table 19. Global Hydrological Engineering Services Market Size (M USD) by Type (2019-2025)
Table 20. Global Hydrological Engineering Services Market Size Share by Type (2019-2025)
Table 21. Global Hydrological Engineering Services Market Size Growth Rate by Type (2019-2025)
Table 22. Global Hydrological Engineering Services Market Size by Application
Table 23. Global Hydrological Engineering Services Market Size by Application (2019-2025) & (M USD)
Table 24. Global Hydrological Engineering Services Market Share by Application (2019-2025)
Table 25. Global Hydrological Engineering Services Market Size Growth Rate by Application (2019-2025)
Table 26. Global Hydrological Engineering Services Market Size by Region (2019-2025) & (M USD)
Table 27. Global Hydrological Engineering Services Market Size Market Share by Region (2019-2025)
Table 28. North America Hydrological Engineering Services Market Size by Country (2019-2025) & (M USD)
Table 29. Europe Hydrological Engineering Services Market Size by Country (2019-2025) & (M USD)
Table 30. Asia Pacific Hydrological Engineering Services Market Size by Region (2019-2025) & (M USD)
Table 31. South America Hydrological Engineering Services Market Size by Country (2019-2025) & (M USD)
Table 32. Middle East and Africa Hydrological Engineering Services Market Size by Region (2019-2025) & (M USD)
Table 33. Arup Hydrological Engineering Services Basic Information
Table 34. Arup Hydrological Engineering Services Product Overview
Table 35. Arup Hydrological Engineering Services Revenue (M USD) and Gross Margin (2019-2025)
Table 36. Arup Hydrological Engineering Services SWOT Analysis
Table 37. Arup Business Overview
Table 38. Arup Recent Developments
Table 39. Pattle Delamore Partners Hydrological Engineering Services Basic Information
Table 40. Pattle Delamore Partners Hydrological Engineering Services Product Overview
Table 41. Pattle Delamore Partners Hydrological Engineering Services Revenue (M USD) and Gross Margin (2019-2025)
Table 42. Pattle Delamore Partners Hydrological Engineering Services SWOT Analysis
Table 43. Pattle Delamore Partners Business Overview
Table 44. Pattle Delamore Partners Recent Developments
Table 45. JE Fuller Hydrological Engineering Services Basic Information
Table 46. JE Fuller Hydrological Engineering Services Product Overview
Table 47. JE Fuller Hydrological Engineering Services Revenue (M USD) and Gross Margin (2019-2025)
Table 48. JE Fuller Hydrological Engineering Services SWOT Analysis
Table 49. JE Fuller Business Overview
Table 50. JE Fuller Recent Developments
Table 51. OSKA Consulting Group Hydrological Engineering Services Basic Information
Table 52. OSKA Consulting Group Hydrological Engineering Services Product Overview
Table 53. OSKA Consulting Group Hydrological Engineering Services Revenue (M USD) and Gross Margin (2019-2025)
Table 54. OSKA Consulting Group Business Overview
Table 55. OSKA Consulting Group Recent Developments
Table 56. Suvastu Engineering Hydrological Engineering Services Basic Information
Table 57. Suvastu Engineering Hydrological Engineering Services Product Overview
Table 58. Suvastu Engineering Hydrological Engineering Services Revenue (M USD) and Gross Margin (2019-2025)
Table 59. Suvastu Engineering Business Overview
Table 60. Suvastu Engineering Recent Developments
Table 61. Construction Journal Hydrological Engineering Services Basic Information
Table 62. Construction Journal Hydrological Engineering Services Product Overview
Table 63. Construction Journal Hydrological Engineering Services Revenue (M USD) and Gross Margin (2019-2025)
Table 64. Construction Journal Business Overview
Table 65. Construction Journal Recent Developments
Table 66. Clarkebond Hydrological Engineering Services Basic Information
Table 67. Clarkebond Hydrological Engineering Services Product Overview
Table 68. Clarkebond Hydrological Engineering Services Revenue (M USD) and Gross Margin (2019-2025)
Table 69. Clarkebond Business Overview
Table 70. Clarkebond Recent Developments
Table 71. Mannvit Hydrological Engineering Services Basic Information
Table 72. Mannvit Hydrological Engineering Services Product Overview
Table 73. Mannvit Hydrological Engineering Services Revenue (M USD) and Gross Margin (2019-2025)
Table 74. Mannvit Business Overview
Table 75. Mannvit Recent Developments
Table 76. Turner Group Hydrological Engineering Services Basic Information
Table 77. Turner Group Hydrological Engineering Services Product Overview
Table 78. Turner Group Hydrological Engineering Services Revenue (M USD) and Gross Margin (2019-2025)
Table 79. Turner Group Business Overview
Table 80. Turner Group Recent Developments
Table 81. ProDESIGN Hydrological Engineering Services Basic Information
Table 82. ProDESIGN Hydrological Engineering Services Product Overview
Table 83. ProDESIGN Hydrological Engineering Services Revenue (M USD) and Gross Margin (2019-2025)
Table 84. ProDESIGN Business Overview
Table 85. ProDESIGN Recent Developments
Table 86. Jones and Wagener Hydrological Engineering Services Basic Information
Table 87. Jones and Wagener Hydrological Engineering Services Product Overview
Table 88. Jones and Wagener Hydrological Engineering Services Revenue (M USD) and Gross Margin (2019-2025)
Table 89. Jones and Wagener Business Overview
Table 90. Jones and Wagener Recent Developments
Table 91. Hydro Hydrological Engineering Services Basic Information
Table 92. Hydro Hydrological Engineering Services Product Overview
Table 93. Hydro Hydrological Engineering Services Revenue (M USD) and Gross Margin (2019-2025)
Table 94. Hydro Business Overview
Table 95. Hydro Recent Developments
Table 96. Inc Hydrological Engineering Services Basic Information
Table 97. Inc Hydrological Engineering Services Product Overview
Table 98. Inc Hydrological Engineering Services Revenue (M USD) and Gross Margin (2019-2025)
Table 99. Inc Business Overview
Table 100. Inc Recent Developments
Table 101. WSP Hydrological Engineering Services Basic Information
Table 102. WSP Hydrological Engineering Services Product Overview
Table 103. WSP Hydrological Engineering Services Revenue (M USD) and Gross Margin (2019-2025)
Table 104. WSP Business Overview
Table 105. WSP Recent Developments
Table 106. Gomez and Sullivan Engineers Hydrological Engineering Services Basic Information
Table 107. Gomez and Sullivan Engineers Hydrological Engineering Services Product Overview
Table 108. Gomez and Sullivan Engineers Hydrological Engineering Services Revenue (M USD) and Gross Margin (2019-2025)
Table 109. Gomez and Sullivan Engineers Business Overview
Table 110. Gomez and Sullivan Engineers Recent Developments
Table 111. Global Hydrological Engineering Services Market Size Forecast by Region (2025-2032) & (M USD)
Table 112. North America Hydrological Engineering Services Market Size Forecast by Country (2025-2032) & (M USD)
Table 113. Europe Hydrological Engineering Services Market Size Forecast by Country (2025-2032) & (M USD)
Table 114. Asia Pacific Hydrological Engineering Services Market Size Forecast by Region (2025-2032) & (M USD)
Table 115. South America Hydrological Engineering Services Market Size Forecast by Country (2025-2032) & (M USD)
Table 116. Middle East and Africa Hydrological Engineering Services Market Size Forecast by Country (2025-2032) & (M USD)
Table 117. Global Hydrological Engineering Services Market Size Forecast by Type (2025-2032) & (M USD)
Table 118. Global Hydrological Engineering Services Market Size Forecast by Application (2025-2032) & (M USD)
List of Figures
Figure 1. Industrial Chain of Hydrological Engineering Services
Figure 2. Data Triangulation
Figure 3. Key Caveats
Figure 4. Global Hydrological Engineering Services Market Size (M USD), 2019-2032
Figure 5. Global Hydrological Engineering Services Market Size (M USD) (2019-2032)
Figure 6. Evaluation Matrix of Segment Market Development Potential (Type)
Figure 7. Evaluation Matrix of Segment Market Development Potential (Application)
Figure 8. Evaluation Matrix of Regional Market Development Potential
Figure 9. Hydrological Engineering Services Market Size by Country (M USD)
Figure 10. Global Hydrological Engineering Services Revenue Share by Company in 2023
Figure 11. Hydrological Engineering Services Market Share by Company Type (Tier 1, Tier 2 and Tier 3): 2023
Figure 12. The Global 5 and 10 Largest Players: Market Share by Hydrological Engineering Services Revenue in 2023
Figure 13. Evaluation Matrix of Segment Market Development Potential (Type)
Figure 14. Global Hydrological Engineering Services Market Share by Type
Figure 15. Market Size Share of Hydrological Engineering Services by Type (2019-2025)
Figure 16. Market Size Market Share of Hydrological Engineering Services by Type in 2022
Figure 17. Global Hydrological Engineering Services Market Size Growth Rate by Type (2019-2025)
Figure 18. Evaluation Matrix of Segment Market Development Potential (Application)
Figure 19. Global Hydrological Engineering Services Market Share by Application
Figure 20. Global Hydrological Engineering Services Market Share by Application (2019-2025)
Figure 21. Global Hydrological Engineering Services Market Share by Application in 2022
Figure 22. Global Hydrological Engineering Services Market Size Growth Rate by Application (2019-2025)
Figure 23. Global Hydrological Engineering Services Market Size Market Share by Region (2019-2025)
Figure 24. North America Hydrological Engineering Services Market Size and Growth Rate (2019-2025) & (M USD)
Figure 25. North America Hydrological Engineering Services Market Size Market Share by Country in 2023
Figure 26. U.S. Hydrological Engineering Services Market Size and Growth Rate (2019-2025) & (M USD)
Figure 27. Canada Hydrological Engineering Services Market Size (M USD) and Growth Rate (2019-2025)
Figure 28. Mexico Hydrological Engineering Services Market Size (Units) and Growth Rate (2019-2025)
Figure 29. Europe Hydrological Engineering Services Market Size and Growth Rate (2019-2025) & (M USD)
Figure 30. Europe Hydrological Engineering Services Market Size Market Share by Country in 2023
Figure 31. Germany Hydrological Engineering Services Market Size and Growth Rate (2019-2025) & (M USD)
Figure 32. France Hydrological Engineering Services Market Size and Growth Rate (2019-2025) & (M USD)
Figure 33. U.K. Hydrological Engineering Services Market Size and Growth Rate (2019-2025) & (M USD)
Figure 34. Italy Hydrological Engineering Services Market Size and Growth Rate (2019-2025) & (M USD)
Figure 35. Russia Hydrological Engineering Services Market Size and Growth Rate (2019-2025) & (M USD)
Figure 36. Asia Pacific Hydrological Engineering Services Market Size and Growth Rate (M USD)
Figure 37. Asia Pacific Hydrological Engineering Services Market Size Market Share by Region in 2023
Figure 38. China Hydrological Engineering Services Market Size and Growth Rate (2019-2025) & (M USD)
Figure 39. Japan Hydrological Engineering Services Market Size and Growth Rate (2019-2025) & (M USD)
Figure 40. South Korea Hydrological Engineering Services Market Size and Growth Rate (2019-2025) & (M USD)
Figure 41. India Hydrological Engineering Services Market Size and Growth Rate (2019-2025) & (M USD)
Figure 42. Southeast Asia Hydrological Engineering Services Market Size and Growth Rate (2019-2025) & (M USD)
Figure 43. South America Hydrological Engineering Services Market Size and Growth Rate (M USD)
Figure 44. South America Hydrological Engineering Services Market Size Market Share by Country in 2023
Figure 45. Brazil Hydrological Engineering Services Market Size and Growth Rate (2019-2025) & (M USD)
Figure 46. Argentina Hydrological Engineering Services Market Size and Growth Rate (2019-2025) & (M USD)
Figure 47. Columbia Hydrological Engineering Services Market Size and Growth Rate (2019-2025) & (M USD)
Figure 48. Middle East and Africa Hydrological Engineering Services Market Size and Growth Rate (M USD)
Figure 49. Middle East and Africa Hydrological Engineering Services Market Size Market Share by Region in 2023
Figure 50. Saudi Arabia Hydrological Engineering Services Market Size and Growth Rate (2019-2025) & (M USD)
Figure 51. UAE Hydrological Engineering Services Market Size and Growth Rate (2019-2025) & (M USD)
Figure 52. Egypt Hydrological Engineering Services Market Size and Growth Rate (2019-2025) & (M USD)
Figure 53. Nigeria Hydrological Engineering Services Market Size and Growth Rate (2019-2025) & (M USD)
Figure 54. South Africa Hydrological Engineering Services Market Size and Growth Rate (2019-2025) & (M USD)
Figure 55. Global Hydrological Engineering Services Market Size Forecast by Value (2019-2032) & (M USD)
Figure 56. Global Hydrological Engineering Services Market Share Forecast by Type (2025-2032)
Figure 57. Global Hydrological Engineering Services Market Share Forecast by Application (2025-2032)

