Hydrolyzed Vegetable Protein (HVP) is a flavor-enhancing ingredient derived from plant-based sources such as soy, wheat, and corn. It is created by breaking down vegetable proteins into their component amino acids through acid hydrolysis, enzymatic hydrolysis, or fermentation. HVP is commonly used in processed foods, snacks, soups, and seasonings to enhance umami flavor.
Market Size
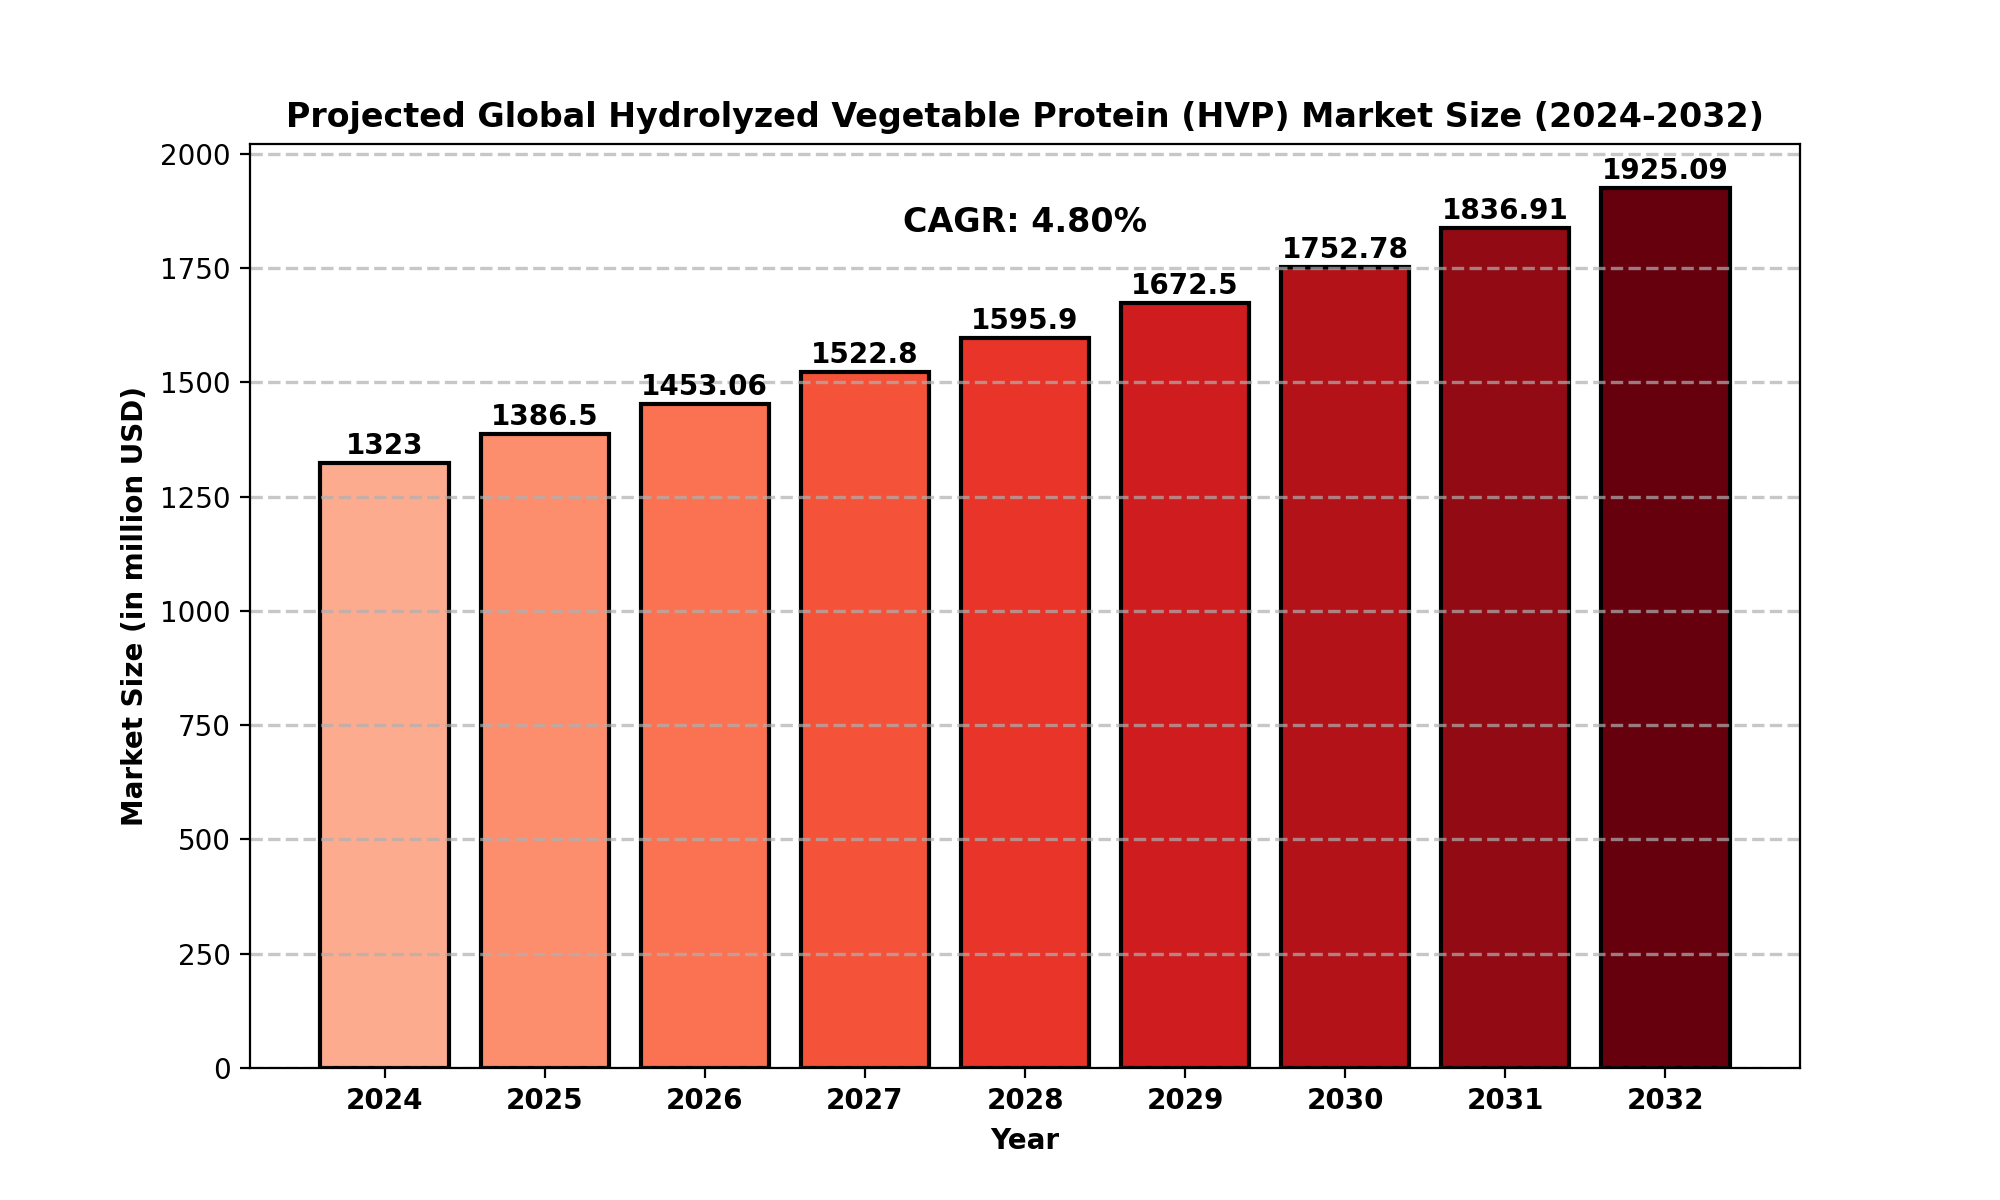
The global Hydrolyzed Vegetable Protein (HVP) market was valued at USD 1,323 million in 2024 and is projected to grow to USD 1,925.09 million by 2032, reflecting a CAGR of 4.80% over the forecast period.
-
North America accounted for a significant portion of the market, with a valuation of USD 373.69 million in 2024 and a CAGR of 4.11% from 2025 to 2032.
-
Increasing demand for plant-based protein sources, driven by changing dietary preferences and the growth of the vegan and vegetarian population, is fueling the market’s expansion.
Market Dynamics (Drivers, Restraints, Opportunities, and Challenges)
Drivers
-
Growing Demand for Processed and Convenience Foods: The rise in fast-paced lifestyles has increased the consumption of ready-to-eat meals and snacks, where HVP serves as a crucial flavor enhancer.
-
Increased Adoption of Plant-Based Diets: The surge in vegetarian and vegan consumers is driving demand for plant-based protein alternatives, boosting HVP sales.
-
Rising Popularity of Umami Flavors in Food Products: Consumers are increasingly looking for richer and deeper taste experiences, which has led to greater utilization of HVP in the food industry.
Restraints
-
Health Concerns Related to MSG and Sodium Content: Some HVP products contain high sodium and monosodium glutamate (MSG), leading to health concerns among consumers.
-
Strict Regulatory Compliance: Different countries impose stringent regulations regarding food additives, which can pose challenges for HVP manufacturers.
Opportunities
-
Innovation in Clean Label and Organic HVP: The demand for organic and non-GMO HVP is growing, presenting a major opportunity for manufacturers to cater to health-conscious consumers.
-
Expansion in Emerging Markets: Countries in Asia-Pacific, Latin America, and Africa are witnessing rapid urbanization and changing food consumption habits, making them potential growth markets for HVP.
Challenges
-
Availability of Alternative Flavor Enhancers: Competition from natural flavoring agents such as yeast extract and hydrolyzed yeast poses a challenge to HVP market expansion.
-
Fluctuations in Raw Material Prices: The cost of raw materials such as soy and wheat can impact HVP production costs and pricing.
Regional Analysis
North America
-
The largest regional market, driven by strong demand from the processed food sector.
-
The U.S. leads the market due to well-established food processing industries and increasing demand for clean-label ingredients.
Europe
-
Rising demand for plant-based foods and alternative protein sources.
-
Stringent food safety regulations impact market dynamics, encouraging innovation in organic and non-GMO HVP.
Asia-Pacific
-
The fastest-growing region, driven by increased consumption of processed foods in countries like China, India, and Japan.
-
Growing preference for savory seasonings in traditional cuisines contributes to market growth.
South America
Middle East and Africa
Competitor Analysis
Key Players in the Global HVP Market:
-
Shanghai Aipu
-
Baoding Weijia
-
MCLS China
-
Baoding Xinweikang
-
Shandong Zhonghui
-
Baoding Weiqun
-
Qingzhou Zhongkang
-
Qinhuangdao Jinwei
These companies focus on product innovation, strategic collaborations, and expanding distribution networks to strengthen their market presence.
Market Segmentation (by Application)
-
Meat Products: Used as a meat substitute and flavor enhancer in processed meats.
-
Convenience Foods and Snacks: Added in ready-to-eat and packaged food products to boost taste.
-
Household Seasoning: Used as a common ingredient in sauces, bouillons, and condiments.
-
Others: Includes applications in pet food, soups, and pharmaceutical formulations.
Market Segmentation (by Type)
Geographic Segmentation
-
North America (USA, Canada, Mexico)
-
Europe (Germany, UK, France, Russia, Italy, Rest of Europe)
-
Asia-Pacific (China, Japan, South Korea, India, Southeast Asia, Rest of Asia-Pacific)
-
South America (Brazil, Argentina, Colombia, Rest of South America)
-
Middle East and Africa (Saudi Arabia, UAE, Egypt, Nigeria, South Africa, Rest of MEA)
FAQ
What is the current market size of the Hydrolyzed Vegetable Protein (HVP) market?
- The global HVP market was valued at USD 1,323 million in 2024 and is expected to grow to USD 2,017.49 million by 2032.
Which companies are key players in the HVP market?
- Some of the leading players include Shanghai Aipu, Baoding Weijia, MCLS China, Baoding Xinweikang, and Shandong Zhonghui.
What are the main growth drivers of the HVP market?
- Key growth drivers include increased demand for processed and convenience foods, rising popularity of plant-based diets, and the growing preference for umami flavors.
Which region dominates the HVP market?
- North America is the largest market, followed by Asia-Pacific, which is the fastest-growing region.
What are the emerging trends in the HVP market?
- Emerging trends include the shift towards clean-label and organic HVP, increased use in plant-based protein products, and innovation in flavor-enhancing applications.
Key Benefits of This Market Research:
-
Industry drivers, restraints, and opportunities covered in the study
-
Neutral perspective on the market performance
-
Recent industry trends and developments
-
Competitive landscape & strategies of key players
-
Potential & niche segments and regions exhibiting promising growth covered
-
Historical, current, and projected market size, in terms of value
-
In-depth analysis of the Hydrolyzed Vegetable Protein (HVP) Market
-
Overview of the regional outlook of the Hydrolyzed Vegetable Protein (HVP) Market:
Key Reasons to Buy this Report:
-
Access to date statistics compiled by our researchers. These provide you with historical and forecast data, which is analyzed to tell you why your market is set to change
-
This enables you to anticipate market changes to remain ahead of your competitors
-
You will be able to copy data from the Excel spreadsheet straight into your marketing plans, business presentations, or other strategic documents
-
The concise analysis, clear graph, and table format will enable you to pinpoint the information you require quickly
-
Provision of market value data for each segment and sub-segment
-
Indicates the region and segment that is expected to witness the fastest growth as well as to dominate the market
-
Analysis by geography highlighting the consumption of the product/service in the region as well as indicating the factors that are affecting the market within each region
-
Competitive landscape which incorporates the market ranking of the major players, along with new service/product launches, partnerships, business expansions, and acquisitions in the past five years of companies profiled
-
Extensive company profiles comprising of company overview, company insights, product benchmarking, and SWOT analysis for the major market players
-
The current as well as the future market outlook of the industry concerning recent developments which involve growth opportunities and drivers as well as challenges and restraints of both emerging as well as developed regions
-
Includes in-depth analysis of the market from various perspectives through Porters five forces analysis
-
Provides insight into the market through Value Chain
-
Market dynamics scenario, along with growth opportunities of the market in the years to come
-
6-month post-sales analyst support
Customization of the Report
Chapter Outline
-
Chapter 1 mainly introduces the statistical scope of the report, market division standards, and market research methods.
-
Chapter 2 is an executive summary of different market segments (by region, product type, application, etc), including the market size of each market segment, future development potential, and so on. It offers a high-level view of the current state of the Hydrolyzed Vegetable Protein (HVP) Market and its likely evolution in the short to mid-term, and long term.
-
Chapter 3 makes a detailed analysis of the market's competitive landscape of the market and provides the market share, capacity, output, price, latest development plan, merger, and acquisition information of the main manufacturers in the market.
-
Chapter 4 is the analysis of the whole market industrial chain, including the upstream and downstream of the industry, as well as Porter's five forces analysis.
-
Chapter 5 introduces the latest developments of the market, the driving factors and restrictive factors of the market, the challenges and risks faced by manufacturers in the industry, and the analysis of relevant policies in the industry.
-
Chapter 6 provides the analysis of various market segments according to product types, covering the market size and development potential of each market segment, to help readers find the blue ocean market in different market segments.
-
Chapter 7 provides the analysis of various market segments according to application, covering the market size and development potential of each market segment, to help readers find the blue ocean market in different downstream markets.
-
Chapter 8 provides a quantitative analysis of the market size and development potential of each region from the consumer side and its main countries and introduces the market development, future development prospects, market space, and capacity of each country in the world.
-
Chapter 9 shares the main producing countries of Hydrolyzed Vegetable Protein (HVP), their output value, profit level, regional supply, production capacity layout, etc. from the supply side.
-
Chapter 10 introduces the basic situation of the main companies in the market in detail, including product sales revenue, sales volume, price, gross profit margin, market share, product introduction, recent development, etc.
-
Chapter 11 provides a quantitative analysis of the market size and development potential of each region during the forecast period.
-
Chapter 12 provides a quantitative analysis of the market size and development potential of each market segment during the forecast period.
-
Chapter 13 is the main points and conclusions of the report.
TABLE OF CONTENTS
Table of Contents
1 Research Methodology and Statistical Scope
1.1 Market Definition and Statistical Scope of Hydrolyzed Vegetable Protein (HVP)
1.2 Key Market Segments
1.2.1 Hydrolyzed Vegetable Protein (HVP) Segment by Type
1.2.2 Hydrolyzed Vegetable Protein (HVP) Segment by Application
1.3 Methodology & Sources of Information
1.3.1 Research Methodology
1.3.2 Research Process
1.3.3 Market Breakdown and Data Triangulation
1.3.4 Base Year
1.3.5 Report Assumptions & Caveats
2 Hydrolyzed Vegetable Protein (HVP) Market Overview
2.1 Global Market Overview
2.1.1 Global Hydrolyzed Vegetable Protein (HVP) Market Size (M USD) Estimates and Forecasts (2019-2032)
2.1.2 Global Hydrolyzed Vegetable Protein (HVP) Sales Estimates and Forecasts (2019-2032)
2.2 Market Segment Executive Summary
2.3 Global Market Size by Region
3 Hydrolyzed Vegetable Protein (HVP) Market Competitive Landscape
3.1 Global Hydrolyzed Vegetable Protein (HVP) Sales by Manufacturers (2019-2025)
3.2 Global Hydrolyzed Vegetable Protein (HVP) Revenue Market Share by Manufacturers (2019-2025)
3.3 Hydrolyzed Vegetable Protein (HVP) Market Share by Company Type (Tier 1, Tier 2, and Tier 3)
3.4 Global Hydrolyzed Vegetable Protein (HVP) Average Price by Manufacturers (2019-2025)
3.5 Manufacturers Hydrolyzed Vegetable Protein (HVP) Sales Sites, Area Served, Product Type
3.6 Hydrolyzed Vegetable Protein (HVP) Market Competitive Situation and Trends
3.6.1 Hydrolyzed Vegetable Protein (HVP) Market Concentration Rate
3.6.2 Global 5 and 10 Largest Hydrolyzed Vegetable Protein (HVP) Players Market Share by Revenue
3.6.3 Mergers & Acquisitions, Expansion
4 Hydrolyzed Vegetable Protein (HVP) Industry Chain Analysis
4.1 Hydrolyzed Vegetable Protein (HVP) Industry Chain Analysis
4.2 Market Overview of Key Raw Materials
4.3 Midstream Market Analysis
4.4 Downstream Customer Analysis
5 The Development and Dynamics of Hydrolyzed Vegetable Protein (HVP) Market
5.1 Key Development Trends
5.2 Driving Factors
5.3 Market Challenges
5.4 Market Restraints
5.5 Industry News
5.5.1 New Product Developments
5.5.2 Mergers & Acquisitions
5.5.3 Expansions
5.5.4 Collaboration/Supply Contracts
5.6 Industry Policies
6 Hydrolyzed Vegetable Protein (HVP) Market Segmentation by Type
6.1 Evaluation Matrix of Segment Market Development Potential (Type)
6.2 Global Hydrolyzed Vegetable Protein (HVP) Sales Market Share by Type (2019-2025)
6.3 Global Hydrolyzed Vegetable Protein (HVP) Market Size Market Share by Type (2019-2025)
6.4 Global Hydrolyzed Vegetable Protein (HVP) Price by Type (2019-2025)
7 Hydrolyzed Vegetable Protein (HVP) Market Segmentation by Application
7.1 Evaluation Matrix of Segment Market Development Potential (Application)
7.2 Global Hydrolyzed Vegetable Protein (HVP) Market Sales by Application (2019-2025)
7.3 Global Hydrolyzed Vegetable Protein (HVP) Market Size (M USD) by Application (2019-2025)
7.4 Global Hydrolyzed Vegetable Protein (HVP) Sales Growth Rate by Application (2019-2025)
8 Hydrolyzed Vegetable Protein (HVP) Market Consumption by Region
8.1 Global Hydrolyzed Vegetable Protein (HVP) Sales by Region
8.1.1 Global Hydrolyzed Vegetable Protein (HVP) Sales by Region
8.1.2 Global Hydrolyzed Vegetable Protein (HVP) Sales Market Share by Region
8.2 North America
8.2.1 North America Hydrolyzed Vegetable Protein (HVP) Sales by Country
8.2.2 U.S.
8.2.3 Canada
8.2.4 Mexico
8.3 Europe
8.3.1 Europe Hydrolyzed Vegetable Protein (HVP) Sales by Country
8.3.2 Germany
8.3.3 France
8.3.4 U.K.
8.3.5 Italy
8.3.6 Russia
8.4 Asia Pacific
8.4.1 Asia Pacific Hydrolyzed Vegetable Protein (HVP) Sales by Region
8.4.2 China
8.4.3 Japan
8.4.4 South Korea
8.4.5 India
8.4.6 Southeast Asia
8.5 South America
8.5.1 South America Hydrolyzed Vegetable Protein (HVP) Sales by Country
8.5.2 Brazil
8.5.3 Argentina
8.5.4 Columbia
8.6 Middle East and Africa
8.6.1 Middle East and Africa Hydrolyzed Vegetable Protein (HVP) Sales by Region
8.6.2 Saudi Arabia
8.6.3 UAE
8.6.4 Egypt
8.6.5 Nigeria
8.6.6 South Africa
9 Hydrolyzed Vegetable Protein (HVP) Market Production by Region
9.1 Global Production of Hydrolyzed Vegetable Protein (HVP) by Region (2019-2025)
9.2 Global Hydrolyzed Vegetable Protein (HVP) Revenue Market Share by Region (2019-2025)
9.3 Global Hydrolyzed Vegetable Protein (HVP) Production, Revenue, Price and Gross Margin (2019-2025)
9.4 North America Hydrolyzed Vegetable Protein (HVP) Production
9.4.1 North America Hydrolyzed Vegetable Protein (HVP) Production Growth Rate (2019-2025)
9.4.2 North America Hydrolyzed Vegetable Protein (HVP) Production, Revenue, Price and Gross Margin (2019-2025)
9.5 Europe Hydrolyzed Vegetable Protein (HVP) Production
9.5.1 Europe Hydrolyzed Vegetable Protein (HVP) Production Growth Rate (2019-2025)
9.5.2 Europe Hydrolyzed Vegetable Protein (HVP) Production, Revenue, Price and Gross Margin (2019-2025)
9.6 Japan Hydrolyzed Vegetable Protein (HVP) Production (2019-2025)
9.6.1 Japan Hydrolyzed Vegetable Protein (HVP) Production Growth Rate (2019-2025)
9.6.2 Japan Hydrolyzed Vegetable Protein (HVP) Production, Revenue, Price and Gross Margin (2019-2025)
9.7 China Hydrolyzed Vegetable Protein (HVP) Production (2019-2025)
9.7.1 China Hydrolyzed Vegetable Protein (HVP) Production Growth Rate (2019-2025)
9.7.2 China Hydrolyzed Vegetable Protein (HVP) Production, Revenue, Price and Gross Margin (2019-2025)
10 Key Companies Profile
10.1 Shanghai Aipu
10.1.1 Shanghai Aipu Hydrolyzed Vegetable Protein (HVP) Basic Information
10.1.2 Shanghai Aipu Hydrolyzed Vegetable Protein (HVP) Product Overview
10.1.3 Shanghai Aipu Hydrolyzed Vegetable Protein (HVP) Product Market Performance
10.1.4 Shanghai Aipu Business Overview
10.1.5 Shanghai Aipu Hydrolyzed Vegetable Protein (HVP) SWOT Analysis
10.1.6 Shanghai Aipu Recent Developments
10.2 Baoding Weijia
10.2.1 Baoding Weijia Hydrolyzed Vegetable Protein (HVP) Basic Information
10.2.2 Baoding Weijia Hydrolyzed Vegetable Protein (HVP) Product Overview
10.2.3 Baoding Weijia Hydrolyzed Vegetable Protein (HVP) Product Market Performance
10.2.4 Baoding Weijia Business Overview
10.2.5 Baoding Weijia Hydrolyzed Vegetable Protein (HVP) SWOT Analysis
10.2.6 Baoding Weijia Recent Developments
10.3 MCLS China
10.3.1 MCLS China Hydrolyzed Vegetable Protein (HVP) Basic Information
10.3.2 MCLS China Hydrolyzed Vegetable Protein (HVP) Product Overview
10.3.3 MCLS China Hydrolyzed Vegetable Protein (HVP) Product Market Performance
10.3.4 MCLS China Hydrolyzed Vegetable Protein (HVP) SWOT Analysis
10.3.5 MCLS China Business Overview
10.3.6 MCLS China Recent Developments
10.4 Baoding Xinweikang
10.4.1 Baoding Xinweikang Hydrolyzed Vegetable Protein (HVP) Basic Information
10.4.2 Baoding Xinweikang Hydrolyzed Vegetable Protein (HVP) Product Overview
10.4.3 Baoding Xinweikang Hydrolyzed Vegetable Protein (HVP) Product Market Performance
10.4.4 Baoding Xinweikang Business Overview
10.4.5 Baoding Xinweikang Recent Developments
10.5 Shandong Zhonghui
10.5.1 Shandong Zhonghui Hydrolyzed Vegetable Protein (HVP) Basic Information
10.5.2 Shandong Zhonghui Hydrolyzed Vegetable Protein (HVP) Product Overview
10.5.3 Shandong Zhonghui Hydrolyzed Vegetable Protein (HVP) Product Market Performance
10.5.4 Shandong Zhonghui Business Overview
10.5.5 Shandong Zhonghui Recent Developments
10.6 Baoding Weiqun
10.6.1 Baoding Weiqun Hydrolyzed Vegetable Protein (HVP) Basic Information
10.6.2 Baoding Weiqun Hydrolyzed Vegetable Protein (HVP) Product Overview
10.6.3 Baoding Weiqun Hydrolyzed Vegetable Protein (HVP) Product Market Performance
10.6.4 Baoding Weiqun Business Overview
10.6.5 Baoding Weiqun Recent Developments
10.7 Qingzhou Zhongkang
10.7.1 Qingzhou Zhongkang Hydrolyzed Vegetable Protein (HVP) Basic Information
10.7.2 Qingzhou Zhongkang Hydrolyzed Vegetable Protein (HVP) Product Overview
10.7.3 Qingzhou Zhongkang Hydrolyzed Vegetable Protein (HVP) Product Market Performance
10.7.4 Qingzhou Zhongkang Business Overview
10.7.5 Qingzhou Zhongkang Recent Developments
10.8 Qinhuangdao Jinwei
10.8.1 Qinhuangdao Jinwei Hydrolyzed Vegetable Protein (HVP) Basic Information
10.8.2 Qinhuangdao Jinwei Hydrolyzed Vegetable Protein (HVP) Product Overview
10.8.3 Qinhuangdao Jinwei Hydrolyzed Vegetable Protein (HVP) Product Market Performance
10.8.4 Qinhuangdao Jinwei Business Overview
10.8.5 Qinhuangdao Jinwei Recent Developments
11 Hydrolyzed Vegetable Protein (HVP) Market Forecast by Region
11.1 Global Hydrolyzed Vegetable Protein (HVP) Market Size Forecast
11.2 Global Hydrolyzed Vegetable Protein (HVP) Market Forecast by Region
11.2.1 North America Market Size Forecast by Country
11.2.2 Europe Hydrolyzed Vegetable Protein (HVP) Market Size Forecast by Country
11.2.3 Asia Pacific Hydrolyzed Vegetable Protein (HVP) Market Size Forecast by Region
11.2.4 South America Hydrolyzed Vegetable Protein (HVP) Market Size Forecast by Country
11.2.5 Middle East and Africa Forecasted Consumption of Hydrolyzed Vegetable Protein (HVP) by Country
12 Forecast Market by Type and by Application (2025-2032)
12.1 Global Hydrolyzed Vegetable Protein (HVP) Market Forecast by Type (2025-2032)
12.1.1 Global Forecasted Sales of Hydrolyzed Vegetable Protein (HVP) by Type (2025-2032)
12.1.2 Global Hydrolyzed Vegetable Protein (HVP) Market Size Forecast by Type (2025-2032)
12.1.3 Global Forecasted Price of Hydrolyzed Vegetable Protein (HVP) by Type (2025-2032)
12.2 Global Hydrolyzed Vegetable Protein (HVP) Market Forecast by Application (2025-2032)
12.2.1 Global Hydrolyzed Vegetable Protein (HVP) Sales (K MT) Forecast by Application
12.2.2 Global Hydrolyzed Vegetable Protein (HVP) Market Size (M USD) Forecast by Application (2025-2032)
13 Conclusion and Key Findings
LIST OF TABLES & FIGURES
List of Tables
Table 1. Introduction of the Type
Table 2. Introduction of the Application
Table 3. Market Size (M USD) Segment Executive Summary
Table 4. Hydrolyzed Vegetable Protein (HVP) Market Size Comparison by Region (M USD)
Table 5. Global Hydrolyzed Vegetable Protein (HVP) Sales (K MT) by Manufacturers (2019-2025)
Table 6. Global Hydrolyzed Vegetable Protein (HVP) Sales Market Share by Manufacturers (2019-2025)
Table 7. Global Hydrolyzed Vegetable Protein (HVP) Revenue (M USD) by Manufacturers (2019-2025)
Table 8. Global Hydrolyzed Vegetable Protein (HVP) Revenue Share by Manufacturers (2019-2025)
Table 9. Company Type (Tier 1, Tier 2, and Tier 3) & (based on the Revenue in Hydrolyzed Vegetable Protein (HVP) as of 2022)
Table 10. Global Market Hydrolyzed Vegetable Protein (HVP) Average Price (USD/MT) of Key Manufacturers (2019-2025)
Table 11. Manufacturers Hydrolyzed Vegetable Protein (HVP) Sales Sites and Area Served
Table 12. Manufacturers Hydrolyzed Vegetable Protein (HVP) Product Type
Table 13. Global Hydrolyzed Vegetable Protein (HVP) Manufacturers Market Concentration Ratio (CR5 and HHI)
Table 14. Mergers & Acquisitions, Expansion Plans
Table 15. Industry Chain Map of Hydrolyzed Vegetable Protein (HVP)
Table 16. Market Overview of Key Raw Materials
Table 17. Midstream Market Analysis
Table 18. Downstream Customer Analysis
Table 19. Key Development Trends
Table 20. Driving Factors
Table 21. Hydrolyzed Vegetable Protein (HVP) Market Challenges
Table 22. Global Hydrolyzed Vegetable Protein (HVP) Sales by Type (K MT)
Table 23. Global Hydrolyzed Vegetable Protein (HVP) Market Size by Type (M USD)
Table 24. Global Hydrolyzed Vegetable Protein (HVP) Sales (K MT) by Type (2019-2025)
Table 25. Global Hydrolyzed Vegetable Protein (HVP) Sales Market Share by Type (2019-2025)
Table 26. Global Hydrolyzed Vegetable Protein (HVP) Market Size (M USD) by Type (2019-2025)
Table 27. Global Hydrolyzed Vegetable Protein (HVP) Market Size Share by Type (2019-2025)
Table 28. Global Hydrolyzed Vegetable Protein (HVP) Price (USD/MT) by Type (2019-2025)
Table 29. Global Hydrolyzed Vegetable Protein (HVP) Sales (K MT) by Application
Table 30. Global Hydrolyzed Vegetable Protein (HVP) Market Size by Application
Table 31. Global Hydrolyzed Vegetable Protein (HVP) Sales by Application (2019-2025) & (K MT)
Table 32. Global Hydrolyzed Vegetable Protein (HVP) Sales Market Share by Application (2019-2025)
Table 33. Global Hydrolyzed Vegetable Protein (HVP) Sales by Application (2019-2025) & (M USD)
Table 34. Global Hydrolyzed Vegetable Protein (HVP) Market Share by Application (2019-2025)
Table 35. Global Hydrolyzed Vegetable Protein (HVP) Sales Growth Rate by Application (2019-2025)
Table 36. Global Hydrolyzed Vegetable Protein (HVP) Sales by Region (2019-2025) & (K MT)
Table 37. Global Hydrolyzed Vegetable Protein (HVP) Sales Market Share by Region (2019-2025)
Table 38. North America Hydrolyzed Vegetable Protein (HVP) Sales by Country (2019-2025) & (K MT)
Table 39. Europe Hydrolyzed Vegetable Protein (HVP) Sales by Country (2019-2025) & (K MT)
Table 40. Asia Pacific Hydrolyzed Vegetable Protein (HVP) Sales by Region (2019-2025) & (K MT)
Table 41. South America Hydrolyzed Vegetable Protein (HVP) Sales by Country (2019-2025) & (K MT)
Table 42. Middle East and Africa Hydrolyzed Vegetable Protein (HVP) Sales by Region (2019-2025) & (K MT)
Table 43. Global Hydrolyzed Vegetable Protein (HVP) Production (K MT) by Region (2019-2025)
Table 44. Global Hydrolyzed Vegetable Protein (HVP) Revenue (US$ Million) by Region (2019-2025)
Table 45. Global Hydrolyzed Vegetable Protein (HVP) Revenue Market Share by Region (2019-2025)
Table 46. Global Hydrolyzed Vegetable Protein (HVP) Production (K MT), Revenue (US$ Million), Price (USD/MT) and Gross Margin (2019-2025)
Table 47. North America Hydrolyzed Vegetable Protein (HVP) Production (K MT), Revenue (US$ Million), Price (USD/MT) and Gross Margin (2019-2025)
Table 48. Europe Hydrolyzed Vegetable Protein (HVP) Production (K MT), Revenue (US$ Million), Price (USD/MT) and Gross Margin (2019-2025)
Table 49. Japan Hydrolyzed Vegetable Protein (HVP) Production (K MT), Revenue (US$ Million), Price (USD/MT) and Gross Margin (2019-2025)
Table 50. China Hydrolyzed Vegetable Protein (HVP) Production (K MT), Revenue (US$ Million), Price (USD/MT) and Gross Margin (2019-2025)
Table 51. Shanghai Aipu Hydrolyzed Vegetable Protein (HVP) Basic Information
Table 52. Shanghai Aipu Hydrolyzed Vegetable Protein (HVP) Product Overview
Table 53. Shanghai Aipu Hydrolyzed Vegetable Protein (HVP) Sales (K MT), Revenue (M USD), Price (USD/MT) and Gross Margin (2019-2025)
Table 54. Shanghai Aipu Business Overview
Table 55. Shanghai Aipu Hydrolyzed Vegetable Protein (HVP) SWOT Analysis
Table 56. Shanghai Aipu Recent Developments
Table 57. Baoding Weijia Hydrolyzed Vegetable Protein (HVP) Basic Information
Table 58. Baoding Weijia Hydrolyzed Vegetable Protein (HVP) Product Overview
Table 59. Baoding Weijia Hydrolyzed Vegetable Protein (HVP) Sales (K MT), Revenue (M USD), Price (USD/MT) and Gross Margin (2019-2025)
Table 60. Baoding Weijia Business Overview
Table 61. Baoding Weijia Hydrolyzed Vegetable Protein (HVP) SWOT Analysis
Table 62. Baoding Weijia Recent Developments
Table 63. MCLS China Hydrolyzed Vegetable Protein (HVP) Basic Information
Table 64. MCLS China Hydrolyzed Vegetable Protein (HVP) Product Overview
Table 65. MCLS China Hydrolyzed Vegetable Protein (HVP) Sales (K MT), Revenue (M USD), Price (USD/MT) and Gross Margin (2019-2025)
Table 66. MCLS China Hydrolyzed Vegetable Protein (HVP) SWOT Analysis
Table 67. MCLS China Business Overview
Table 68. MCLS China Recent Developments
Table 69. Baoding Xinweikang Hydrolyzed Vegetable Protein (HVP) Basic Information
Table 70. Baoding Xinweikang Hydrolyzed Vegetable Protein (HVP) Product Overview
Table 71. Baoding Xinweikang Hydrolyzed Vegetable Protein (HVP) Sales (K MT), Revenue (M USD), Price (USD/MT) and Gross Margin (2019-2025)
Table 72. Baoding Xinweikang Business Overview
Table 73. Baoding Xinweikang Recent Developments
Table 74. Shandong Zhonghui Hydrolyzed Vegetable Protein (HVP) Basic Information
Table 75. Shandong Zhonghui Hydrolyzed Vegetable Protein (HVP) Product Overview
Table 76. Shandong Zhonghui Hydrolyzed Vegetable Protein (HVP) Sales (K MT), Revenue (M USD), Price (USD/MT) and Gross Margin (2019-2025)
Table 77. Shandong Zhonghui Business Overview
Table 78. Shandong Zhonghui Recent Developments
Table 79. Baoding Weiqun Hydrolyzed Vegetable Protein (HVP) Basic Information
Table 80. Baoding Weiqun Hydrolyzed Vegetable Protein (HVP) Product Overview
Table 81. Baoding Weiqun Hydrolyzed Vegetable Protein (HVP) Sales (K MT), Revenue (M USD), Price (USD/MT) and Gross Margin (2019-2025)
Table 82. Baoding Weiqun Business Overview
Table 83. Baoding Weiqun Recent Developments
Table 84. Qingzhou Zhongkang Hydrolyzed Vegetable Protein (HVP) Basic Information
Table 85. Qingzhou Zhongkang Hydrolyzed Vegetable Protein (HVP) Product Overview
Table 86. Qingzhou Zhongkang Hydrolyzed Vegetable Protein (HVP) Sales (K MT), Revenue (M USD), Price (USD/MT) and Gross Margin (2019-2025)
Table 87. Qingzhou Zhongkang Business Overview
Table 88. Qingzhou Zhongkang Recent Developments
Table 89. Qinhuangdao Jinwei Hydrolyzed Vegetable Protein (HVP) Basic Information
Table 90. Qinhuangdao Jinwei Hydrolyzed Vegetable Protein (HVP) Product Overview
Table 91. Qinhuangdao Jinwei Hydrolyzed Vegetable Protein (HVP) Sales (K MT), Revenue (M USD), Price (USD/MT) and Gross Margin (2019-2025)
Table 92. Qinhuangdao Jinwei Business Overview
Table 93. Qinhuangdao Jinwei Recent Developments
Table 94. Global Hydrolyzed Vegetable Protein (HVP) Sales Forecast by Region (2025-2032) & (K MT)
Table 95. Global Hydrolyzed Vegetable Protein (HVP) Market Size Forecast by Region (2025-2032) & (M USD)
Table 96. North America Hydrolyzed Vegetable Protein (HVP) Sales Forecast by Country (2025-2032) & (K MT)
Table 97. North America Hydrolyzed Vegetable Protein (HVP) Market Size Forecast by Country (2025-2032) & (M USD)
Table 98. Europe Hydrolyzed Vegetable Protein (HVP) Sales Forecast by Country (2025-2032) & (K MT)
Table 99. Europe Hydrolyzed Vegetable Protein (HVP) Market Size Forecast by Country (2025-2032) & (M USD)
Table 100. Asia Pacific Hydrolyzed Vegetable Protein (HVP) Sales Forecast by Region (2025-2032) & (K MT)
Table 101. Asia Pacific Hydrolyzed Vegetable Protein (HVP) Market Size Forecast by Region (2025-2032) & (M USD)
Table 102. South America Hydrolyzed Vegetable Protein (HVP) Sales Forecast by Country (2025-2032) & (K MT)
Table 103. South America Hydrolyzed Vegetable Protein (HVP) Market Size Forecast by Country (2025-2032) & (M USD)
Table 104. Middle East and Africa Hydrolyzed Vegetable Protein (HVP) Consumption Forecast by Country (2025-2032) & (Units)
Table 105. Middle East and Africa Hydrolyzed Vegetable Protein (HVP) Market Size Forecast by Country (2025-2032) & (M USD)
Table 106. Global Hydrolyzed Vegetable Protein (HVP) Sales Forecast by Type (2025-2032) & (K MT)
Table 107. Global Hydrolyzed Vegetable Protein (HVP) Market Size Forecast by Type (2025-2032) & (M USD)
Table 108. Global Hydrolyzed Vegetable Protein (HVP) Price Forecast by Type (2025-2032) & (USD/MT)
Table 109. Global Hydrolyzed Vegetable Protein (HVP) Sales (K MT) Forecast by Application (2025-2032)
Table 110. Global Hydrolyzed Vegetable Protein (HVP) Market Size Forecast by Application (2025-2032) & (M USD)
List of Figures
Figure 1. Product Picture of Hydrolyzed Vegetable Protein (HVP)
Figure 2. Data Triangulation
Figure 3. Key Caveats
Figure 4. Global Hydrolyzed Vegetable Protein (HVP) Market Size (M USD), 2019-2032
Figure 5. Global Hydrolyzed Vegetable Protein (HVP) Market Size (M USD) (2019-2032)
Figure 6. Global Hydrolyzed Vegetable Protein (HVP) Sales (K MT) & (2019-2032)
Figure 7. Evaluation Matrix of Segment Market Development Potential (Type)
Figure 8. Evaluation Matrix of Segment Market Development Potential (Application)
Figure 9. Evaluation Matrix of Regional Market Development Potential
Figure 10. Hydrolyzed Vegetable Protein (HVP) Market Size by Country (M USD)
Figure 11. Hydrolyzed Vegetable Protein (HVP) Sales Share by Manufacturers in 2023
Figure 12. Global Hydrolyzed Vegetable Protein (HVP) Revenue Share by Manufacturers in 2023
Figure 13. Hydrolyzed Vegetable Protein (HVP) Market Share by Company Type (Tier 1, Tier 2 and Tier 3): 2023
Figure 14. Global Market Hydrolyzed Vegetable Protein (HVP) Average Price (USD/MT) of Key Manufacturers in 2023
Figure 15. The Global 5 and 10 Largest Players: Market Share by Hydrolyzed Vegetable Protein (HVP) Revenue in 2023
Figure 16. Evaluation Matrix of Segment Market Development Potential (Type)
Figure 17. Global Hydrolyzed Vegetable Protein (HVP) Market Share by Type
Figure 18. Sales Market Share of Hydrolyzed Vegetable Protein (HVP) by Type (2019-2025)
Figure 19. Sales Market Share of Hydrolyzed Vegetable Protein (HVP) by Type in 2023
Figure 20. Market Size Share of Hydrolyzed Vegetable Protein (HVP) by Type (2019-2025)
Figure 21. Market Size Market Share of Hydrolyzed Vegetable Protein (HVP) by Type in 2023
Figure 22. Evaluation Matrix of Segment Market Development Potential (Application)
Figure 23. Global Hydrolyzed Vegetable Protein (HVP) Market Share by Application
Figure 24. Global Hydrolyzed Vegetable Protein (HVP) Sales Market Share by Application (2019-2025)
Figure 25. Global Hydrolyzed Vegetable Protein (HVP) Sales Market Share by Application in 2023
Figure 26. Global Hydrolyzed Vegetable Protein (HVP) Market Share by Application (2019-2025)
Figure 27. Global Hydrolyzed Vegetable Protein (HVP) Market Share by Application in 2023
Figure 28. Global Hydrolyzed Vegetable Protein (HVP) Sales Growth Rate by Application (2019-2025)
Figure 29. Global Hydrolyzed Vegetable Protein (HVP) Sales Market Share by Region (2019-2025)
Figure 30. North America Hydrolyzed Vegetable Protein (HVP) Sales and Growth Rate (2019-2025) & (K MT)
Figure 31. North America Hydrolyzed Vegetable Protein (HVP) Sales Market Share by Country in 2023
Figure 32. U.S. Hydrolyzed Vegetable Protein (HVP) Sales and Growth Rate (2019-2025) & (K MT)
Figure 33. Canada Hydrolyzed Vegetable Protein (HVP) Sales (K MT) and Growth Rate (2019-2025)
Figure 34. Mexico Hydrolyzed Vegetable Protein (HVP) Sales (Units) and Growth Rate (2019-2025)
Figure 35. Europe Hydrolyzed Vegetable Protein (HVP) Sales and Growth Rate (2019-2025) & (K MT)
Figure 36. Europe Hydrolyzed Vegetable Protein (HVP) Sales Market Share by Country in 2023
Figure 37. Germany Hydrolyzed Vegetable Protein (HVP) Sales and Growth Rate (2019-2025) & (K MT)
Figure 38. France Hydrolyzed Vegetable Protein (HVP) Sales and Growth Rate (2019-2025) & (K MT)
Figure 39. U.K. Hydrolyzed Vegetable Protein (HVP) Sales and Growth Rate (2019-2025) & (K MT)
Figure 40. Italy Hydrolyzed Vegetable Protein (HVP) Sales and Growth Rate (2019-2025) & (K MT)
Figure 41. Russia Hydrolyzed Vegetable Protein (HVP) Sales and Growth Rate (2019-2025) & (K MT)
Figure 42. Asia Pacific Hydrolyzed Vegetable Protein (HVP) Sales and Growth Rate (K MT)
Figure 43. Asia Pacific Hydrolyzed Vegetable Protein (HVP) Sales Market Share by Region in 2023
Figure 44. China Hydrolyzed Vegetable Protein (HVP) Sales and Growth Rate (2019-2025) & (K MT)
Figure 45. Japan Hydrolyzed Vegetable Protein (HVP) Sales and Growth Rate (2019-2025) & (K MT)
Figure 46. South Korea Hydrolyzed Vegetable Protein (HVP) Sales and Growth Rate (2019-2025) & (K MT)
Figure 47. India Hydrolyzed Vegetable Protein (HVP) Sales and Growth Rate (2019-2025) & (K MT)
Figure 48. Southeast Asia Hydrolyzed Vegetable Protein (HVP) Sales and Growth Rate (2019-2025) & (K MT)
Figure 49. South America Hydrolyzed Vegetable Protein (HVP) Sales and Growth Rate (K MT)
Figure 50. South America Hydrolyzed Vegetable Protein (HVP) Sales Market Share by Country in 2023
Figure 51. Brazil Hydrolyzed Vegetable Protein (HVP) Sales and Growth Rate (2019-2025) & (K MT)
Figure 52. Argentina Hydrolyzed Vegetable Protein (HVP) Sales and Growth Rate (2019-2025) & (K MT)
Figure 53. Columbia Hydrolyzed Vegetable Protein (HVP) Sales and Growth Rate (2019-2025) & (K MT)
Figure 54. Middle East and Africa Hydrolyzed Vegetable Protein (HVP) Sales and Growth Rate (K MT)
Figure 55. Middle East and Africa Hydrolyzed Vegetable Protein (HVP) Sales Market Share by Region in 2023
Figure 56. Saudi Arabia Hydrolyzed Vegetable Protein (HVP) Sales and Growth Rate (2019-2025) & (K MT)
Figure 57. UAE Hydrolyzed Vegetable Protein (HVP) Sales and Growth Rate (2019-2025) & (K MT)
Figure 58. Egypt Hydrolyzed Vegetable Protein (HVP) Sales and Growth Rate (2019-2025) & (K MT)
Figure 59. Nigeria Hydrolyzed Vegetable Protein (HVP) Sales and Growth Rate (2019-2025) & (K MT)
Figure 60. South Africa Hydrolyzed Vegetable Protein (HVP) Sales and Growth Rate (2019-2025) & (K MT)
Figure 61. Global Hydrolyzed Vegetable Protein (HVP) Production Market Share by Region (2019-2025)
Figure 62. North America Hydrolyzed Vegetable Protein (HVP) Production (K MT) Growth Rate (2019-2025)
Figure 63. Europe Hydrolyzed Vegetable Protein (HVP) Production (K MT) Growth Rate (2019-2025)
Figure 64. Japan Hydrolyzed Vegetable Protein (HVP) Production (K MT) Growth Rate (2019-2025)
Figure 65. China Hydrolyzed Vegetable Protein (HVP) Production (K MT) Growth Rate (2019-2025)
Figure 66. Global Hydrolyzed Vegetable Protein (HVP) Sales Forecast by Volume (2019-2032) & (K MT)
Figure 67. Global Hydrolyzed Vegetable Protein (HVP) Market Size Forecast by Value (2019-2032) & (M USD)
Figure 68. Global Hydrolyzed Vegetable Protein (HVP) Sales Market Share Forecast by Type (2025-2032)
Figure 69. Global Hydrolyzed Vegetable Protein (HVP) Market Share Forecast by Type (2025-2032)
Figure 70. Global Hydrolyzed Vegetable Protein (HVP) Sales Forecast by Application (2025-2032)
Figure 71. Global Hydrolyzed Vegetable Protein (HVP) Market Share Forecast by Application (2025-2032)
 Market, Global Outlook and Forecast 2025-2032")
