Juice products refer to beverages made by extracting or pressing fruits and vegetables. These beverages can be classified into various categories, including fruit juice, vegetable juice, cold-pressed juices, and fortified or functional juices enriched with vitamins, minerals, and other nutrients. Juice products are widely consumed worldwide as a natural and refreshing alternative to carbonated and artificially flavored drinks.
Market Size
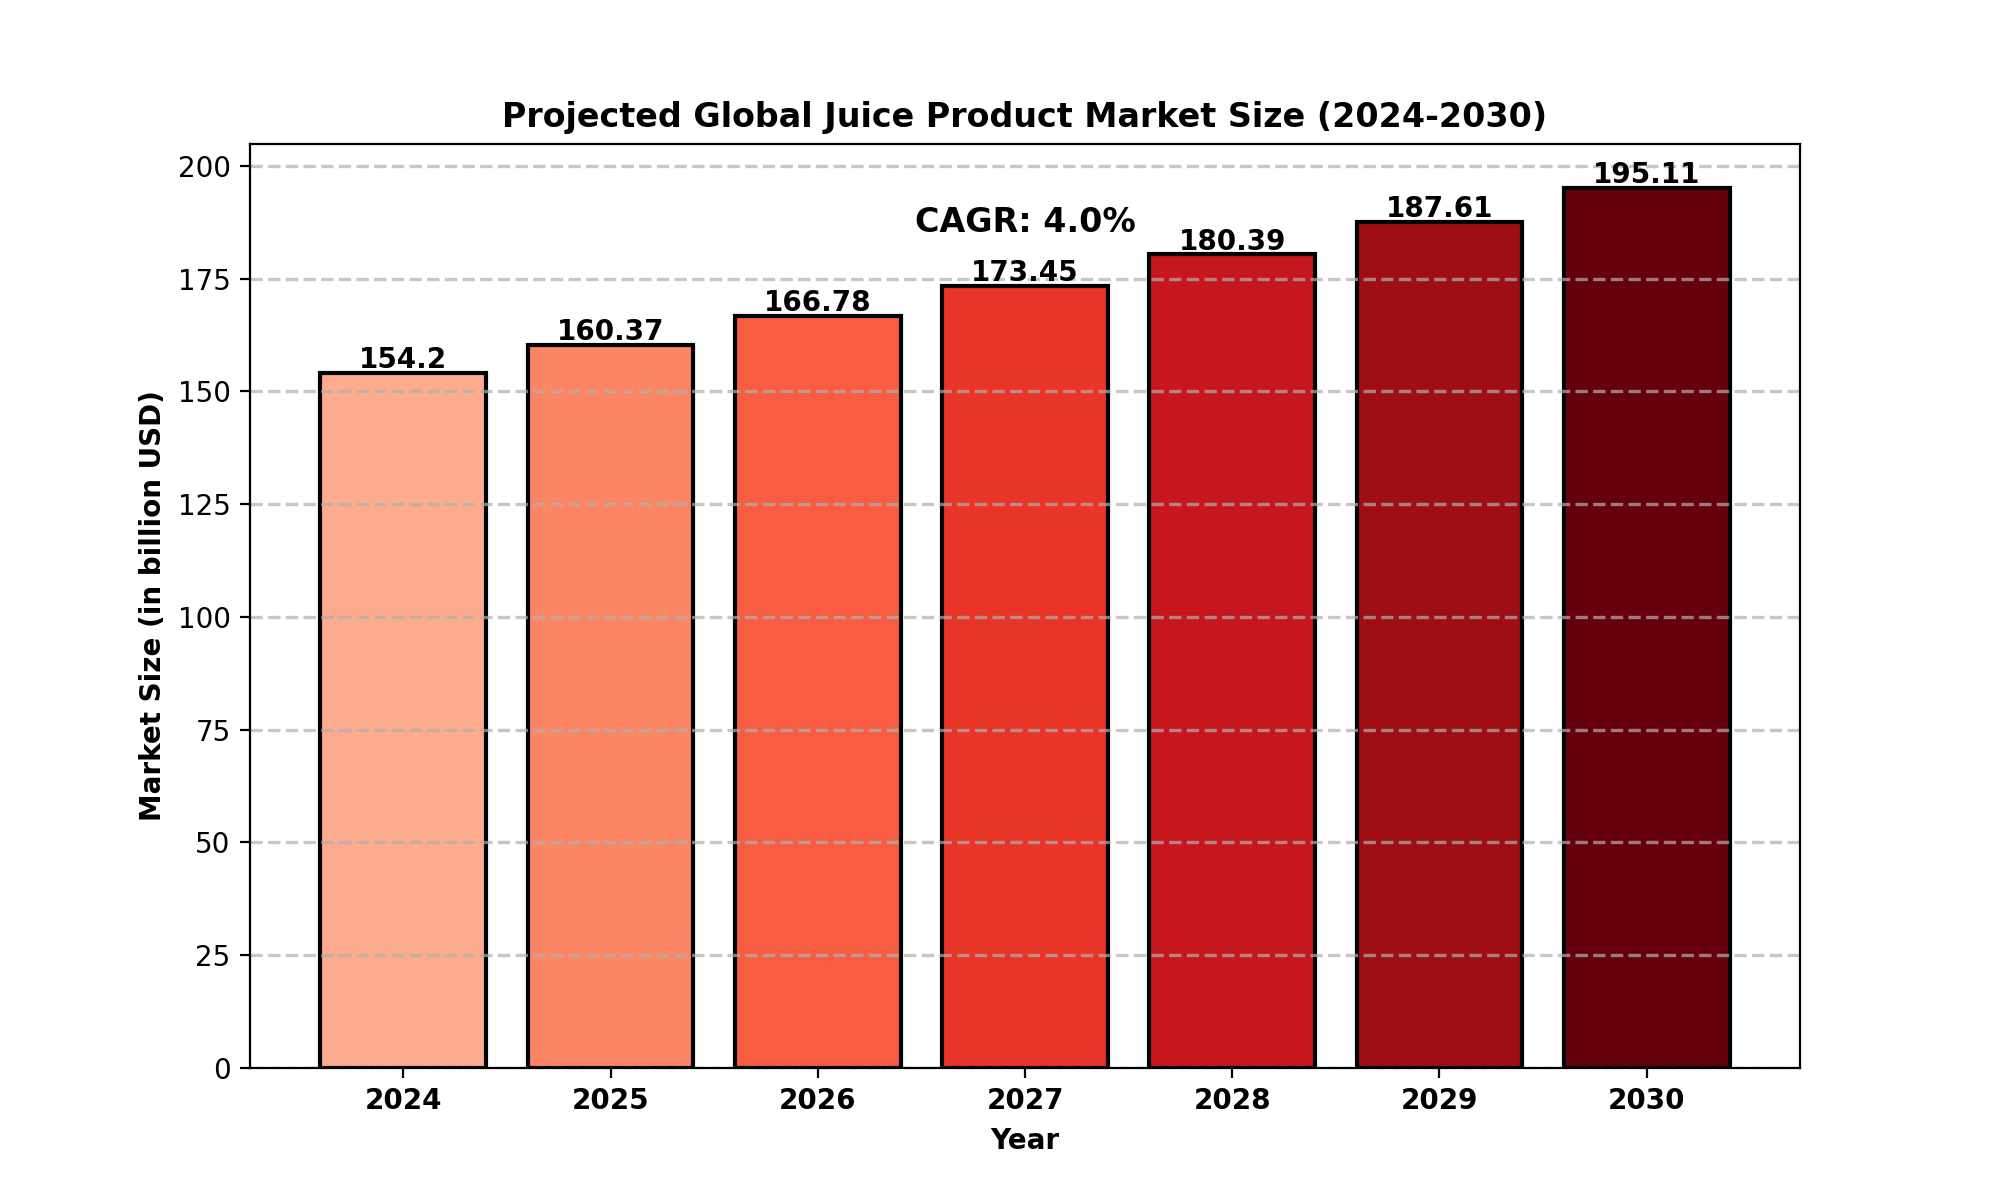
The global juice product market was valued at US$ 154.2 billion in 2024 and is projected to reach US$ 195.1 billion by 2030, growing at a CAGR of 4.0% during the forecast period.
The United States juice product market, in particular, accounted for US$ 34.5 billion in 2024, with expectations to reach US$ 41.2 billion by 2030, growing at a CAGR of 3.0%.
This growth is attributed to the increasing consumer preference for healthier beverage options, rising awareness of nutritional benefits, and the expanding availability of organic and functional juices.
Market Dynamics
Drivers
-
Growing Demand for Natural and Healthy Beverages: Consumers are increasingly opting for natural and organic juices over artificially sweetened drinks.
-
Increasing Popularity of Functional and Fortified Juices: The rise in health-conscious consumers has driven the demand for juice products with added vitamins, minerals, and probiotics.
-
Technological Advancements in Juice Processing: Improved pasteurization techniques and cold-pressed processing methods enhance product shelf life while retaining nutritional content.
-
Rising Disposable Income and Urbanization: Higher disposable incomes and urban lifestyles have led to an increase in juice consumption, particularly in emerging markets.
Restraints
-
High Production Costs: The costs associated with organic juice production and cold-pressed techniques may lead to higher retail prices.
-
Stringent Regulatory Frameworks: Compliance with food safety and labeling regulations across different regions can be challenging for manufacturers.
-
Competition from Carbonated Beverages and Energy Drinks: The presence of alternative beverages with aggressive marketing strategies poses a challenge for juice product sales.
Opportunities
-
Expansion in Emerging Markets: Growing health awareness in Asia-Pacific and Latin America provides lucrative growth opportunities.
-
Development of Innovative Flavors and Blends: New product launches featuring exotic fruit blends and plant-based juices attract more consumers.
-
Sustainability and Eco-Friendly Packaging: The increasing consumer preference for sustainable and recyclable packaging offers opportunities for market growth.
Challenges
-
Short Shelf Life of Fresh Juices: Maintaining freshness while avoiding preservatives remains a major challenge.
-
Fluctuations in Raw Material Prices: Prices of fruits and vegetables fluctuate due to climatic conditions and supply chain disruptions.
Regional Analysis
North America
-
The United States is the largest market, with strong demand for organic and cold-pressed juices.
-
The presence of major players like PepsiCo (Tropicana) and Coca-Cola (Minute Maid) contributes to market dominance.
Europe
-
Countries like Germany, France, and the UK are leading consumers of packaged juice.
-
The European market is witnessing a shift toward reduced-sugar and natural juice options.
Asia-Pacific
South America
Middle East & Africa
Competitive Landscape
Key Players in the Market
-
PepsiCo, Inc.
-
The Coca-Cola Company
-
Nestlé S.A.
-
Del Monte Foods, Inc.
-
Welch Foods Inc.
-
CHC Gourmet Sdn Bhd
-
Jeram Coconut Sdn. Bhd
-
Thomyam Food Industries Sdn. Bhd
-
Strong Group
-
Want-want
-
Hsu Fu Chi
-
Captain Dolphin (M) Sdn Bhd
-
Happy Alliance (M) Sdn Bhd
-
Heinz
-
Cocon Food Industries Sdn Bhd
-
Han Shuo Food
-
Fujian Labixiaoxin
Market Segmentation (by Type)
-
Fruit Juice: Includes 100% fruit juices and fruit juice concentrates.
-
Vegetable Juice: Includes tomato, carrot, beetroot, and mixed vegetable juices.
-
Cold-Pressed Juices: Premium juices with high nutritional value.
-
Fortified Juices: Juices enriched with vitamins, minerals, and probiotics.
Market Segmentation (by Application)
-
Supermarkets and Hypermarkets: The largest distribution channel due to wide product availability.
-
Convenience Stores: Preferred for on-the-go consumption.
-
Online Retailers: Increasing popularity due to convenience and availability of premium juices.
-
Others: Includes specialty stores and health-focused retail outlets.
Geographic Segmentation
-
North America (USA, Canada, Mexico)
-
Europe (Germany, UK, France, Russia, Italy, Rest of Europe)
-
Asia-Pacific (China, Japan, South Korea, India, Southeast Asia, Rest of Asia-Pacific)
-
South America (Brazil, Argentina, Colombia, Rest of South America)
-
Middle East and Africa (Saudi Arabia, UAE, Egypt, Nigeria, South Africa, Rest of MEA)
FAQs
1. What is the current market size of the global Juice Product market?
- The global juice product market was valued at US$ 154.2 billion in 2024 and is projected to reach US$ 194.7 billion by 2030, at a CAGR of 4.0%.
2. Which are the key companies operating in the Juice Product market?
- Major companies include PepsiCo, Coca-Cola, Nestlé, Del Monte Foods, and CHC Gourmet Sdn Bhd, among others.
3. What are the key growth drivers in the Juice Product market?
- The market is driven by increasing health consciousness, demand for organic and functional juices, and innovative product launches.
4. Which regions dominate the Juice Product market?
- North America, Europe, and Asia-Pacific are the leading regions, with the United States and China playing key roles in market expansion.
5. What are the emerging trends in the Juice Product market?
- Trends include the growing popularity of cold-pressed juices, functional beverages, eco-friendly packaging, and plant-based juice blends.
Key Benefits of This Market Research:
- Industry drivers, restraints, and opportunities covered in the study
- Neutral perspective on the market performance
- Recent industry trends and developments
- Competitive landscape & strategies of key players
- Potential & niche segments and regions exhibiting promising growth covered
- Historical, current, and projected market size, in terms of value
- In-depth analysis of the Juice Product Market
- Overview of the regional outlook of the Juice Product Market:
Key Reasons to Buy this Report:
- Access to date statistics compiled by our researchers. These provide you with historical and forecast data, which is analyzed to tell you why your market is set to change
- This enables you to anticipate market changes to remain ahead of your competitors
- You will be able to copy data from the Excel spreadsheet straight into your marketing plans, business presentations, or other strategic documents
- The concise analysis, clear graph, and table format will enable you to pinpoint the information you require quickly
- Provision of market value (USD Billion) data for each segment and sub-segment
- Indicates the region and segment that is expected to witness the fastest growth as well as to dominate the market
- Analysis by geography highlighting the consumption of the product/service in the region as well as indicating the factors that are affecting the market within each region
- Competitive landscape which incorporates the market ranking of the major players, along with new service/product launches, partnerships, business expansions, and acquisitions in the past five years of companies profiled
- Extensive company profiles comprising of company overview, company insights, product benchmarking, and SWOT analysis for the major market players
- The current as well as the future market outlook of the industry concerning recent developments which involve growth opportunities and drivers as well as challenges and restraints of both emerging as well as developed regions
- Includes in-depth analysis of the market from various perspectives through Porter
TABLE OF CONTENTS
Table of Contents
1 Research Methodology and Statistical Scope
1.1 Market Definition and Statistical Scope of Juice Product
1.2 Key Market Segments
1.2.1 Juice Product Segment by Type
1.2.2 Juice Product Segment by Application
1.3 Methodology & Sources of Information
1.3.1 Research Methodology
1.3.2 Research Process
1.3.3 Market Breakdown and Data Triangulation
1.3.4 Base Year
1.3.5 Report Assumptions & Caveats
2 Juice Product Market Overview
2.1 Global Market Overview
2.1.1 Global Juice Product Market Size (M USD) Estimates and Forecasts (2019-2030)
2.1.2 Global Juice Product Sales Estimates and Forecasts (2019-2030)
2.2 Market Segment Executive Summary
2.3 Global Market Size by Region
3 Juice Product Market Competitive Landscape
3.1 Global Juice Product Sales by Manufacturers (2019-2024)
3.2 Global Juice Product Revenue Market Share by Manufacturers (2019-2024)
3.3 Juice Product Market Share by Company Type (Tier 1, Tier 2, and Tier 3)
3.4 Global Juice Product Average Price by Manufacturers (2019-2024)
3.5 Manufacturers Juice Product Sales Sites, Area Served, Product Type
3.6 Juice Product Market Competitive Situation and Trends
3.6.1 Juice Product Market Concentration Rate
3.6.2 Global 5 and 10 Largest Juice Product Players Market Share by Revenue
3.6.3 Mergers & Acquisitions, Expansion
4 Juice Product Industry Chain Analysis
4.1 Juice Product Industry Chain Analysis
4.2 Market Overview of Key Raw Materials
4.3 Midstream Market Analysis
4.4 Downstream Customer Analysis
5 The Development and Dynamics of Juice Product Market
5.1 Key Development Trends
5.2 Driving Factors
5.3 Market Challenges
5.4 Market Restraints
5.5 Industry News
5.5.1 New Product Developments
5.5.2 Mergers & Acquisitions
5.5.3 Expansions
5.5.4 Collaboration/Supply Contracts
5.6 Industry Policies
6 Juice Product Market Segmentation by Type
6.1 Evaluation Matrix of Segment Market Development Potential (Type)
6.2 Global Juice Product Sales Market Share by Type (2019-2024)
6.3 Global Juice Product Market Size Market Share by Type (2019-2024)
6.4 Global Juice Product Price by Type (2019-2024)
7 Juice Product Market Segmentation by Application
7.1 Evaluation Matrix of Segment Market Development Potential (Application)
7.2 Global Juice Product Market Sales by Application (2019-2024)
7.3 Global Juice Product Market Size (M USD) by Application (2019-2024)
7.4 Global Juice Product Sales Growth Rate by Application (2019-2024)
8 Juice Product Market Segmentation by Region
8.1 Global Juice Product Sales by Region
8.1.1 Global Juice Product Sales by Region
8.1.2 Global Juice Product Sales Market Share by Region
8.2 North America
8.2.1 North America Juice Product Sales by Country
8.2.2 U.S.
8.2.3 Canada
8.2.4 Mexico
8.3 Europe
8.3.1 Europe Juice Product Sales by Country
8.3.2 Germany
8.3.3 France
8.3.4 U.K.
8.3.5 Italy
8.3.6 Russia
8.4 Asia Pacific
8.4.1 Asia Pacific Juice Product Sales by Region
8.4.2 China
8.4.3 Japan
8.4.4 South Korea
8.4.5 India
8.4.6 Southeast Asia
8.5 South America
8.5.1 South America Juice Product Sales by Country
8.5.2 Brazil
8.5.3 Argentina
8.5.4 Columbia
8.6 Middle East and Africa
8.6.1 Middle East and Africa Juice Product Sales by Region
8.6.2 Saudi Arabia
8.6.3 UAE
8.6.4 Egypt
8.6.5 Nigeria
8.6.6 South Africa
9 Key Companies Profile
9.1 CHC Gourmet Sdn Bhd
9.1.1 CHC Gourmet Sdn Bhd Juice Product Basic Information
9.1.2 CHC Gourmet Sdn Bhd Juice Product Product Overview
9.1.3 CHC Gourmet Sdn Bhd Juice Product Product Market Performance
9.1.4 CHC Gourmet Sdn Bhd Business Overview
9.1.5 CHC Gourmet Sdn Bhd Juice Product SWOT Analysis
9.1.6 CHC Gourmet Sdn Bhd Recent Developments
9.2 Jeram Coconut Sdn. Bhd
9.2.1 Jeram Coconut Sdn. Bhd Juice Product Basic Information
9.2.2 Jeram Coconut Sdn. Bhd Juice Product Product Overview
9.2.3 Jeram Coconut Sdn. Bhd Juice Product Product Market Performance
9.2.4 Jeram Coconut Sdn. Bhd Business Overview
9.2.5 Jeram Coconut Sdn. Bhd Juice Product SWOT Analysis
9.2.6 Jeram Coconut Sdn. Bhd Recent Developments
9.3 Thomyam Food Industries Sdn. Bhd
9.3.1 Thomyam Food Industries Sdn. Bhd Juice Product Basic Information
9.3.2 Thomyam Food Industries Sdn. Bhd Juice Product Product Overview
9.3.3 Thomyam Food Industries Sdn. Bhd Juice Product Product Market Performance
9.3.4 Thomyam Food Industries Sdn. Bhd Juice Product SWOT Analysis
9.3.5 Thomyam Food Industries Sdn. Bhd Business Overview
9.3.6 Thomyam Food Industries Sdn. Bhd Recent Developments
9.4 Strong Group
9.4.1 Strong Group Juice Product Basic Information
9.4.2 Strong Group Juice Product Product Overview
9.4.3 Strong Group Juice Product Product Market Performance
9.4.4 Strong Group Business Overview
9.4.5 Strong Group Recent Developments
9.5 Want-want
9.5.1 Want-want Juice Product Basic Information
9.5.2 Want-want Juice Product Product Overview
9.5.3 Want-want Juice Product Product Market Performance
9.5.4 Want-want Business Overview
9.5.5 Want-want Recent Developments
9.6 Hsu Fu Chi
9.6.1 Hsu Fu Chi Juice Product Basic Information
9.6.2 Hsu Fu Chi Juice Product Product Overview
9.6.3 Hsu Fu Chi Juice Product Product Market Performance
9.6.4 Hsu Fu Chi Business Overview
9.6.5 Hsu Fu Chi Recent Developments
9.7 Captain Dolphin (M) Sdn Bhd
9.7.1 Captain Dolphin (M) Sdn Bhd Juice Product Basic Information
9.7.2 Captain Dolphin (M) Sdn Bhd Juice Product Product Overview
9.7.3 Captain Dolphin (M) Sdn Bhd Juice Product Product Market Performance
9.7.4 Captain Dolphin (M) Sdn Bhd Business Overview
9.7.5 Captain Dolphin (M) Sdn Bhd Recent Developments
9.8 Happy Alliance (M) Sdn Bhd
9.8.1 Happy Alliance (M) Sdn Bhd Juice Product Basic Information
9.8.2 Happy Alliance (M) Sdn Bhd Juice Product Product Overview
9.8.3 Happy Alliance (M) Sdn Bhd Juice Product Product Market Performance
9.8.4 Happy Alliance (M) Sdn Bhd Business Overview
9.8.5 Happy Alliance (M) Sdn Bhd Recent Developments
9.9 Heinz
9.9.1 Heinz Juice Product Basic Information
9.9.2 Heinz Juice Product Product Overview
9.9.3 Heinz Juice Product Product Market Performance
9.9.4 Heinz Business Overview
9.9.5 Heinz Recent Developments
9.10 Cocon Food Industries Sdn Bhd
9.10.1 Cocon Food Industries Sdn Bhd Juice Product Basic Information
9.10.2 Cocon Food Industries Sdn Bhd Juice Product Product Overview
9.10.3 Cocon Food Industries Sdn Bhd Juice Product Product Market Performance
9.10.4 Cocon Food Industries Sdn Bhd Business Overview
9.10.5 Cocon Food Industries Sdn Bhd Recent Developments
9.11 Han Shuo Food
9.11.1 Han Shuo Food Juice Product Basic Information
9.11.2 Han Shuo Food Juice Product Product Overview
9.11.3 Han Shuo Food Juice Product Product Market Performance
9.11.4 Han Shuo Food Business Overview
9.11.5 Han Shuo Food Recent Developments
9.12 Fujian Labixiaoxin
9.12.1 Fujian Labixiaoxin Juice Product Basic Information
9.12.2 Fujian Labixiaoxin Juice Product Product Overview
9.12.3 Fujian Labixiaoxin Juice Product Product Market Performance
9.12.4 Fujian Labixiaoxin Business Overview
9.12.5 Fujian Labixiaoxin Recent Developments
10 Juice Product Market Forecast by Region
10.1 Global Juice Product Market Size Forecast
10.2 Global Juice Product Market Forecast by Region
10.2.1 North America Market Size Forecast by Country
10.2.2 Europe Juice Product Market Size Forecast by Country
10.2.3 Asia Pacific Juice Product Market Size Forecast by Region
10.2.4 South America Juice Product Market Size Forecast by Country
10.2.5 Middle East and Africa Forecasted Consumption of Juice Product by Country
11 Forecast Market by Type and by Application (2025-2030)
11.1 Global Juice Product Market Forecast by Type (2025-2030)
11.1.1 Global Forecasted Sales of Juice Product by Type (2025-2030)
11.1.2 Global Juice Product Market Size Forecast by Type (2025-2030)
11.1.3 Global Forecasted Price of Juice Product by Type (2025-2030)
11.2 Global Juice Product Market Forecast by Application (2025-2030)
11.2.1 Global Juice Product Sales (Kilotons) Forecast by Application
11.2.2 Global Juice Product Market Size (M USD) Forecast by Application (2025-2030)
12 Conclusion and Key Findings
LIST OF TABLES & FIGURES
List of Tables
Table 1. Introduction of the Type
Table 2. Introduction of the Application
Table 3. Market Size (M USD) Segment Executive Summary
Table 4. Juice Product Market Size Comparison by Region (M USD)
Table 5. Global Juice Product Sales (Kilotons) by Manufacturers (2019-2024)
Table 6. Global Juice Product Sales Market Share by Manufacturers (2019-2024)
Table 7. Global Juice Product Revenue (M USD) by Manufacturers (2019-2024)
Table 8. Global Juice Product Revenue Share by Manufacturers (2019-2024)
Table 9. Company Type (Tier 1, Tier 2, and Tier 3) & (based on the Revenue in Juice Product as of 2022)
Table 10. Global Market Juice Product Average Price (USD/Ton) of Key Manufacturers (2019-2024)
Table 11. Manufacturers Juice Product Sales Sites and Area Served
Table 12. Manufacturers Juice Product Product Type
Table 13. Global Juice Product Manufacturers Market Concentration Ratio (CR5 and HHI)
Table 14. Mergers & Acquisitions, Expansion Plans
Table 15. Industry Chain Map of Juice Product
Table 16. Market Overview of Key Raw Materials
Table 17. Midstream Market Analysis
Table 18. Downstream Customer Analysis
Table 19. Key Development Trends
Table 20. Driving Factors
Table 21. Juice Product Market Challenges
Table 22. Global Juice Product Sales by Type (Kilotons)
Table 23. Global Juice Product Market Size by Type (M USD)
Table 24. Global Juice Product Sales (Kilotons) by Type (2019-2024)
Table 25. Global Juice Product Sales Market Share by Type (2019-2024)
Table 26. Global Juice Product Market Size (M USD) by Type (2019-2024)
Table 27. Global Juice Product Market Size Share by Type (2019-2024)
Table 28. Global Juice Product Price (USD/Ton) by Type (2019-2024)
Table 29. Global Juice Product Sales (Kilotons) by Application
Table 30. Global Juice Product Market Size by Application
Table 31. Global Juice Product Sales by Application (2019-2024) & (Kilotons)
Table 32. Global Juice Product Sales Market Share by Application (2019-2024)
Table 33. Global Juice Product Sales by Application (2019-2024) & (M USD)
Table 34. Global Juice Product Market Share by Application (2019-2024)
Table 35. Global Juice Product Sales Growth Rate by Application (2019-2024)
Table 36. Global Juice Product Sales by Region (2019-2024) & (Kilotons)
Table 37. Global Juice Product Sales Market Share by Region (2019-2024)
Table 38. North America Juice Product Sales by Country (2019-2024) & (Kilotons)
Table 39. Europe Juice Product Sales by Country (2019-2024) & (Kilotons)
Table 40. Asia Pacific Juice Product Sales by Region (2019-2024) & (Kilotons)
Table 41. South America Juice Product Sales by Country (2019-2024) & (Kilotons)
Table 42. Middle East and Africa Juice Product Sales by Region (2019-2024) & (Kilotons)
Table 43. CHC Gourmet Sdn Bhd Juice Product Basic Information
Table 44. CHC Gourmet Sdn Bhd Juice Product Product Overview
Table 45. CHC Gourmet Sdn Bhd Juice Product Sales (Kilotons), Revenue (M USD), Price (USD/Ton) and Gross Margin (2019-2024)
Table 46. CHC Gourmet Sdn Bhd Business Overview
Table 47. CHC Gourmet Sdn Bhd Juice Product SWOT Analysis
Table 48. CHC Gourmet Sdn Bhd Recent Developments
Table 49. Jeram Coconut Sdn. Bhd Juice Product Basic Information
Table 50. Jeram Coconut Sdn. Bhd Juice Product Product Overview
Table 51. Jeram Coconut Sdn. Bhd Juice Product Sales (Kilotons), Revenue (M USD), Price (USD/Ton) and Gross Margin (2019-2024)
Table 52. Jeram Coconut Sdn. Bhd Business Overview
Table 53. Jeram Coconut Sdn. Bhd Juice Product SWOT Analysis
Table 54. Jeram Coconut Sdn. Bhd Recent Developments
Table 55. Thomyam Food Industries Sdn. Bhd Juice Product Basic Information
Table 56. Thomyam Food Industries Sdn. Bhd Juice Product Product Overview
Table 57. Thomyam Food Industries Sdn. Bhd Juice Product Sales (Kilotons), Revenue (M USD), Price (USD/Ton) and Gross Margin (2019-2024)
Table 58. Thomyam Food Industries Sdn. Bhd Juice Product SWOT Analysis
Table 59. Thomyam Food Industries Sdn. Bhd Business Overview
Table 60. Thomyam Food Industries Sdn. Bhd Recent Developments
Table 61. Strong Group Juice Product Basic Information
Table 62. Strong Group Juice Product Product Overview
Table 63. Strong Group Juice Product Sales (Kilotons), Revenue (M USD), Price (USD/Ton) and Gross Margin (2019-2024)
Table 64. Strong Group Business Overview
Table 65. Strong Group Recent Developments
Table 66. Want-want Juice Product Basic Information
Table 67. Want-want Juice Product Product Overview
Table 68. Want-want Juice Product Sales (Kilotons), Revenue (M USD), Price (USD/Ton) and Gross Margin (2019-2024)
Table 69. Want-want Business Overview
Table 70. Want-want Recent Developments
Table 71. Hsu Fu Chi Juice Product Basic Information
Table 72. Hsu Fu Chi Juice Product Product Overview
Table 73. Hsu Fu Chi Juice Product Sales (Kilotons), Revenue (M USD), Price (USD/Ton) and Gross Margin (2019-2024)
Table 74. Hsu Fu Chi Business Overview
Table 75. Hsu Fu Chi Recent Developments
Table 76. Captain Dolphin (M) Sdn Bhd Juice Product Basic Information
Table 77. Captain Dolphin (M) Sdn Bhd Juice Product Product Overview
Table 78. Captain Dolphin (M) Sdn Bhd Juice Product Sales (Kilotons), Revenue (M USD), Price (USD/Ton) and Gross Margin (2019-2024)
Table 79. Captain Dolphin (M) Sdn Bhd Business Overview
Table 80. Captain Dolphin (M) Sdn Bhd Recent Developments
Table 81. Happy Alliance (M) Sdn Bhd Juice Product Basic Information
Table 82. Happy Alliance (M) Sdn Bhd Juice Product Product Overview
Table 83. Happy Alliance (M) Sdn Bhd Juice Product Sales (Kilotons), Revenue (M USD), Price (USD/Ton) and Gross Margin (2019-2024)
Table 84. Happy Alliance (M) Sdn Bhd Business Overview
Table 85. Happy Alliance (M) Sdn Bhd Recent Developments
Table 86. Heinz Juice Product Basic Information
Table 87. Heinz Juice Product Product Overview
Table 88. Heinz Juice Product Sales (Kilotons), Revenue (M USD), Price (USD/Ton) and Gross Margin (2019-2024)
Table 89. Heinz Business Overview
Table 90. Heinz Recent Developments
Table 91. Cocon Food Industries Sdn Bhd Juice Product Basic Information
Table 92. Cocon Food Industries Sdn Bhd Juice Product Product Overview
Table 93. Cocon Food Industries Sdn Bhd Juice Product Sales (Kilotons), Revenue (M USD), Price (USD/Ton) and Gross Margin (2019-2024)
Table 94. Cocon Food Industries Sdn Bhd Business Overview
Table 95. Cocon Food Industries Sdn Bhd Recent Developments
Table 96. Han Shuo Food Juice Product Basic Information
Table 97. Han Shuo Food Juice Product Product Overview
Table 98. Han Shuo Food Juice Product Sales (Kilotons), Revenue (M USD), Price (USD/Ton) and Gross Margin (2019-2024)
Table 99. Han Shuo Food Business Overview
Table 100. Han Shuo Food Recent Developments
Table 101. Fujian Labixiaoxin Juice Product Basic Information
Table 102. Fujian Labixiaoxin Juice Product Product Overview
Table 103. Fujian Labixiaoxin Juice Product Sales (Kilotons), Revenue (M USD), Price (USD/Ton) and Gross Margin (2019-2024)
Table 104. Fujian Labixiaoxin Business Overview
Table 105. Fujian Labixiaoxin Recent Developments
Table 106. Global Juice Product Sales Forecast by Region (2025-2030) & (Kilotons)
Table 107. Global Juice Product Market Size Forecast by Region (2025-2030) & (M USD)
Table 108. North America Juice Product Sales Forecast by Country (2025-2030) & (Kilotons)
Table 109. North America Juice Product Market Size Forecast by Country (2025-2030) & (M USD)
Table 110. Europe Juice Product Sales Forecast by Country (2025-2030) & (Kilotons)
Table 111. Europe Juice Product Market Size Forecast by Country (2025-2030) & (M USD)
Table 112. Asia Pacific Juice Product Sales Forecast by Region (2025-2030) & (Kilotons)
Table 113. Asia Pacific Juice Product Market Size Forecast by Region (2025-2030) & (M USD)
Table 114. South America Juice Product Sales Forecast by Country (2025-2030) & (Kilotons)
Table 115. South America Juice Product Market Size Forecast by Country (2025-2030) & (M USD)
Table 116. Middle East and Africa Juice Product Consumption Forecast by Country (2025-2030) & (Units)
Table 117. Middle East and Africa Juice Product Market Size Forecast by Country (2025-2030) & (M USD)
Table 118. Global Juice Product Sales Forecast by Type (2025-2030) & (Kilotons)
Table 119. Global Juice Product Market Size Forecast by Type (2025-2030) & (M USD)
Table 120. Global Juice Product Price Forecast by Type (2025-2030) & (USD/Ton)
Table 121. Global Juice Product Sales (Kilotons) Forecast by Application (2025-2030)
Table 122. Global Juice Product Market Size Forecast by Application (2025-2030) & (M USD)
List of Figures
Figure 1. Product Picture of Juice Product
Figure 2. Data Triangulation
Figure 3. Key Caveats
Figure 4. Global Juice Product Market Size (M USD), 2019-2030
Figure 5. Global Juice Product Market Size (M USD) (2019-2030)
Figure 6. Global Juice Product Sales (Kilotons) & (2019-2030)
Figure 7. Evaluation Matrix of Segment Market Development Potential (Type)
Figure 8. Evaluation Matrix of Segment Market Development Potential (Application)
Figure 9. Evaluation Matrix of Regional Market Development Potential
Figure 10. Juice Product Market Size by Country (M USD)
Figure 11. Juice Product Sales Share by Manufacturers in 2023
Figure 12. Global Juice Product Revenue Share by Manufacturers in 2023
Figure 13. Juice Product Market Share by Company Type (Tier 1, Tier 2 and Tier 3): 2023
Figure 14. Global Market Juice Product Average Price (USD/Ton) of Key Manufacturers in 2023
Figure 15. The Global 5 and 10 Largest Players: Market Share by Juice Product Revenue in 2023
Figure 16. Evaluation Matrix of Segment Market Development Potential (Type)
Figure 17. Global Juice Product Market Share by Type
Figure 18. Sales Market Share of Juice Product by Type (2019-2024)
Figure 19. Sales Market Share of Juice Product by Type in 2023
Figure 20. Market Size Share of Juice Product by Type (2019-2024)
Figure 21. Market Size Market Share of Juice Product by Type in 2023
Figure 22. Evaluation Matrix of Segment Market Development Potential (Application)
Figure 23. Global Juice Product Market Share by Application
Figure 24. Global Juice Product Sales Market Share by Application (2019-2024)
Figure 25. Global Juice Product Sales Market Share by Application in 2023
Figure 26. Global Juice Product Market Share by Application (2019-2024)
Figure 27. Global Juice Product Market Share by Application in 2023
Figure 28. Global Juice Product Sales Growth Rate by Application (2019-2024)
Figure 29. Global Juice Product Sales Market Share by Region (2019-2024)
Figure 30. North America Juice Product Sales and Growth Rate (2019-2024) & (Kilotons)
Figure 31. North America Juice Product Sales Market Share by Country in 2023
Figure 32. U.S. Juice Product Sales and Growth Rate (2019-2024) & (Kilotons)
Figure 33. Canada Juice Product Sales (Kilotons) and Growth Rate (2019-2024)
Figure 34. Mexico Juice Product Sales (Units) and Growth Rate (2019-2024)
Figure 35. Europe Juice Product Sales and Growth Rate (2019-2024) & (Kilotons)
Figure 36. Europe Juice Product Sales Market Share by Country in 2023
Figure 37. Germany Juice Product Sales and Growth Rate (2019-2024) & (Kilotons)
Figure 38. France Juice Product Sales and Growth Rate (2019-2024) & (Kilotons)
Figure 39. U.K. Juice Product Sales and Growth Rate (2019-2024) & (Kilotons)
Figure 40. Italy Juice Product Sales and Growth Rate (2019-2024) & (Kilotons)
Figure 41. Russia Juice Product Sales and Growth Rate (2019-2024) & (Kilotons)
Figure 42. Asia Pacific Juice Product Sales and Growth Rate (Kilotons)
Figure 43. Asia Pacific Juice Product Sales Market Share by Region in 2023
Figure 44. China Juice Product Sales and Growth Rate (2019-2024) & (Kilotons)
Figure 45. Japan Juice Product Sales and Growth Rate (2019-2024) & (Kilotons)
Figure 46. South Korea Juice Product Sales and Growth Rate (2019-2024) & (Kilotons)
Figure 47. India Juice Product Sales and Growth Rate (2019-2024) & (Kilotons)
Figure 48. Southeast Asia Juice Product Sales and Growth Rate (2019-2024) & (Kilotons)
Figure 49. South America Juice Product Sales and Growth Rate (Kilotons)
Figure 50. South America Juice Product Sales Market Share by Country in 2023
Figure 51. Brazil Juice Product Sales and Growth Rate (2019-2024) & (Kilotons)
Figure 52. Argentina Juice Product Sales and Growth Rate (2019-2024) & (Kilotons)
Figure 53. Columbia Juice Product Sales and Growth Rate (2019-2024) & (Kilotons)
Figure 54. Middle East and Africa Juice Product Sales and Growth Rate (Kilotons)
Figure 55. Middle East and Africa Juice Product Sales Market Share by Region in 2023
Figure 56. Saudi Arabia Juice Product Sales and Growth Rate (2019-2024) & (Kilotons)
Figure 57. UAE Juice Product Sales and Growth Rate (2019-2024) & (Kilotons)
Figure 58. Egypt Juice Product Sales and Growth Rate (2019-2024) & (Kilotons)
Figure 59. Nigeria Juice Product Sales and Growth Rate (2019-2024) & (Kilotons)
Figure 60. South Africa Juice Product Sales and Growth Rate (2019-2024) & (Kilotons)
Figure 61. Global Juice Product Sales Forecast by Volume (2019-2030) & (Kilotons)
Figure 62. Global Juice Product Market Size Forecast by Value (2019-2030) & (M USD)
Figure 63. Global Juice Product Sales Market Share Forecast by Type (2025-2030)
Figure 64. Global Juice Product Market Share Forecast by Type (2025-2030)
Figure 65. Global Juice Product Sales Forecast by Application (2025-2030)
Figure 66. Global Juice Product Market Share Forecast by Application (2025-2030)
")
