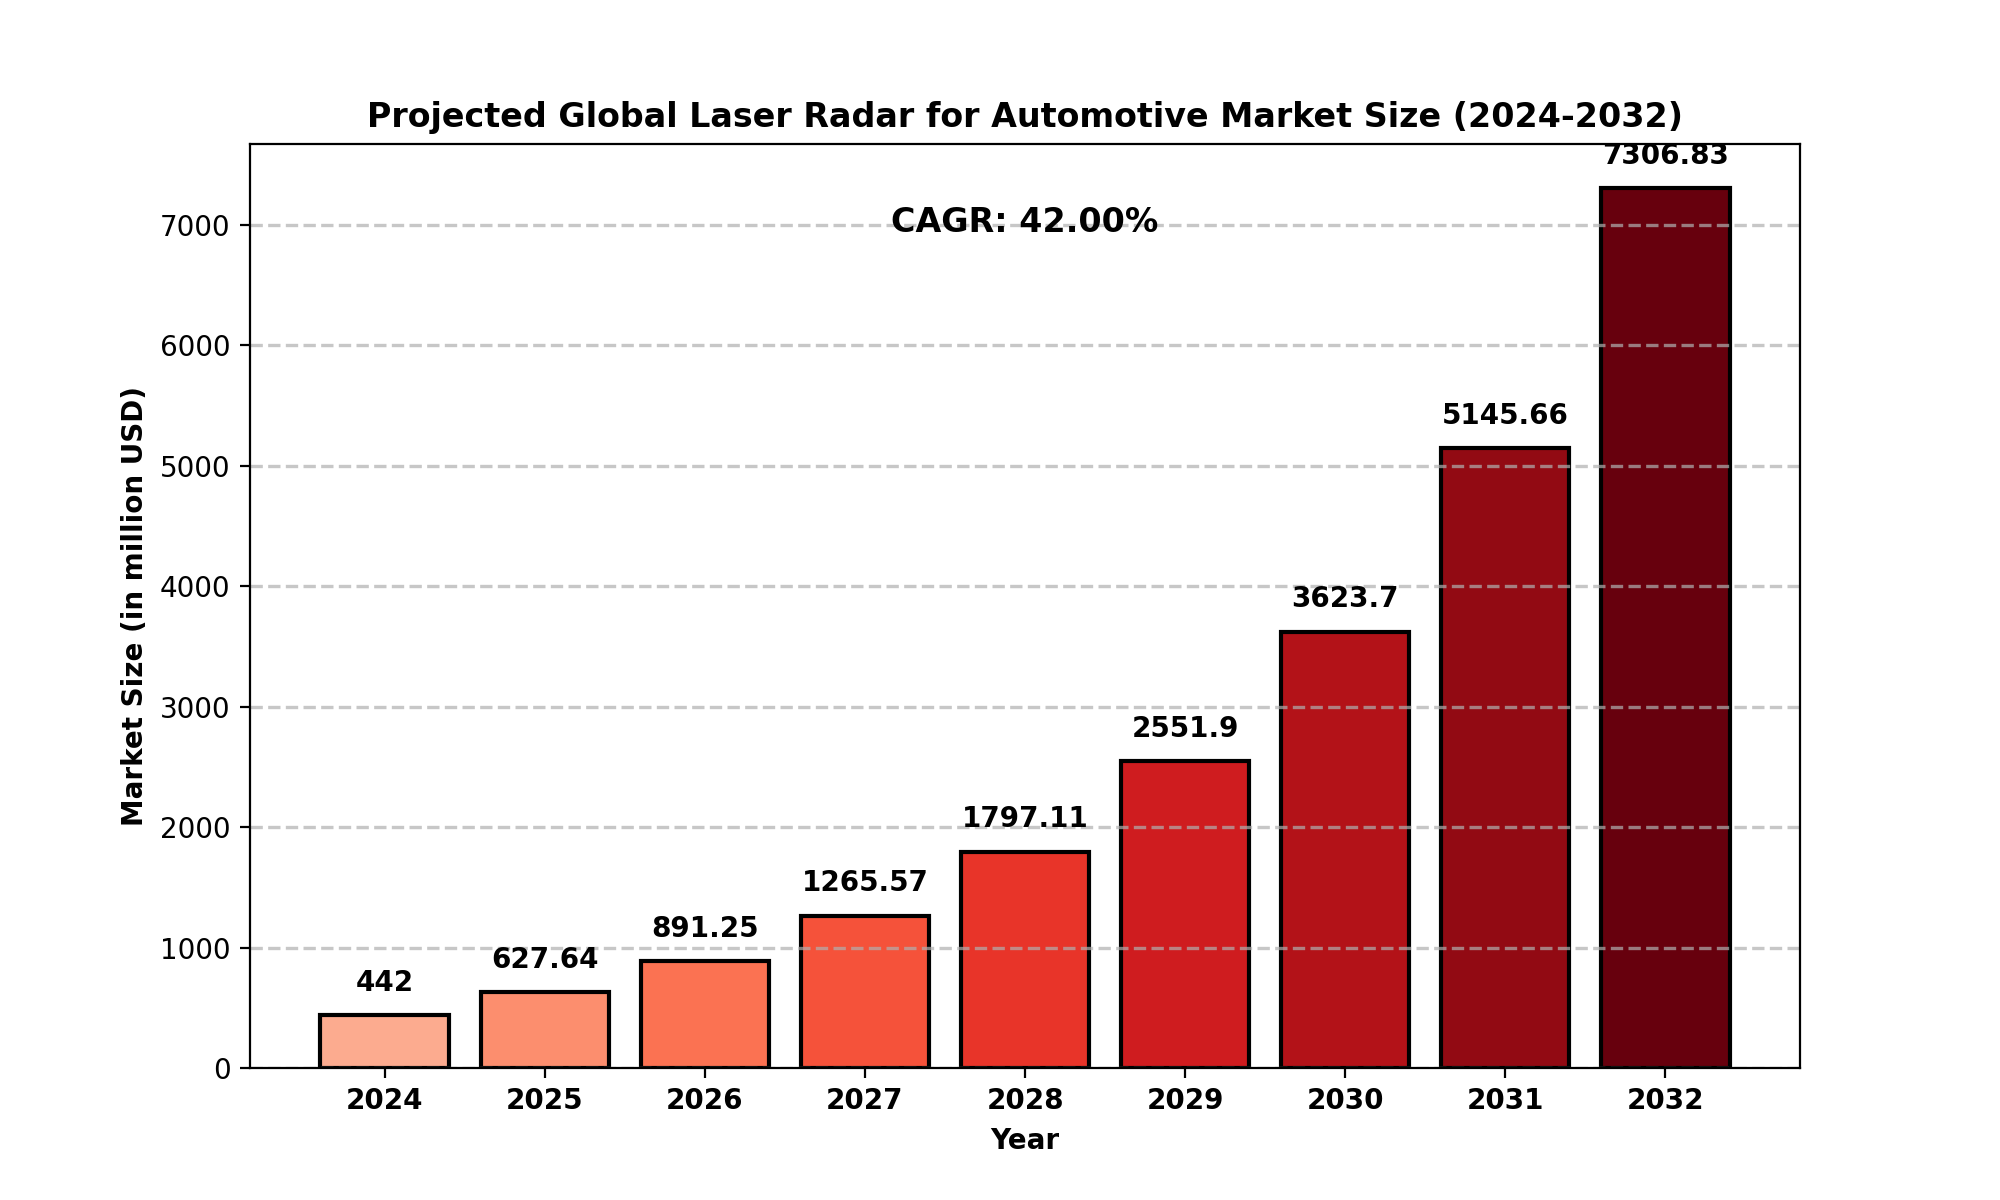
The global Laser Radar for Automotive market size was estimated at USD 442 million in 2024 and is projected to reach USD 7306.83 million by 2032, exhibiting a CAGR of 42.00% during the forecast period.
North America Laser Radar for Automotive market size was estimated at USD 213.02 million in 2024, at a CAGR of 36.00% during the forecast period of 2025 through 2032.
Report Overview
Laser radar is a surveying method that measures distance to a target by illuminating that target with a pulsed laser light, and measuring the reflected pulses with a sensor. Differences in laser return times and wavelengths can then be used to make digital 3D-representations of the target. Laser radar is commonly used to make high-resolution maps, with applications in geodesy, geomatics, archaeology, geography, geology, geomorphology, seismology, forestry, atmospheric physics, laser guidance, airborne laser swath mapping (ALSM), and laser altimetry. The technology is also used for control and navigation for some autonomous cars. This report mainly focuses on Laser radar for automotive market.
This report provides a deep insight into the global Laser Radar for Automotive market covering all its essential aspects. This ranges from a macro overview of the market to micro details of the market size, competitive landscape, development trend, niche market, key market drivers and challenges, SWOT analysis, value chain analysis, etc.
The analysis helps the reader to shape the competition within the industries and strategies for the competitive environment to enhance the potential profit. Furthermore, it provides a simple framework for evaluating and accessing the position of the business organization. The report structure also focuses on the competitive landscape of the Global Laser Radar for Automotive Market, this report introduces in detail the market share, market performance, product situation, operation situation, etc. of the main players, which helps the readers in the industry to identify the main competitors and deeply understand the competition pattern of the market.
In a word, this report is a must-read for industry players, investors, researchers, consultants, business strategists, and all those who have any kind of stake or are planning to foray into the Laser Radar for Automotive market in any manner.
Global Laser Radar for Automotive Market: Market Segmentation Analysis
The research report includes specific segments by region (country), manufacturers, Type, and Application. Market segmentation creates subsets of a market based on product type, end-user or application, Geographic, and other factors. By understanding the market segments, the decision-maker can leverage this targeting in the product, sales, and marketing strategies. Market segments can power your product development cycles by informing how you create product offerings for different segments.
Key Company
- Trimbel
- Hexagon
- Sick AG
- Topcon Positioning Systems
- Velodyne
- Riegl
- Valeo
- Leosphere
- Innovusion
- Hesai Technology
- Ibeo
- Ouster
- LeddarTech
- Robosense
- Luminar
- VanJee Technology
- SureStar
- Continental
Market Segmentation (by Type)
- 905nm
- 1550nm
- 1064nm
- 885mn
- Others
Market Segmentation (by Application)
- Commercial Vehicle
- Passenger Car
Geographic Segmentation
- North America (USA, Canada, Mexico)
- Europe (Germany, UK, France, Russia, Italy, Rest of Europe)
- Asia-Pacific (China, Japan, South Korea, India, Southeast Asia, Rest of Asia-Pacific)
- South America (Brazil, Argentina, Columbia, Rest of South America)
- The Middle East and Africa (Saudi Arabia, UAE, Egypt, Nigeria, South Africa, Rest of MEA)
Key Benefits of This Market Research:
- Industry drivers, restraints, and opportunities covered in the study
- Neutral perspective on the market performance
- Recent industry trends and developments
- Competitive landscape & strategies of key players
- Potential & niche segments and regions exhibiting promising growth covered
- Historical, current, and projected market size, in terms of value
- In-depth analysis of the Laser Radar for Automotive Market
- Overview of the regional outlook of the Laser Radar for Automotive Market:
FAQs on the Global Laser Radar for Automotive Market (2024-2032)
1. What is the current market size of the global laser radar for automotive market?
- The global laser radar (LiDAR) for automotive market was valued at USD 442 million in 2024.
2. What is the projected market size by 2032?
- The market is expected to grow significantly, reaching USD 10,375.70 million by 2032.
3. What is the expected CAGR of the market?
- The market is projected to grow at an impressive CAGR of 42.00% from 2024 to 2032.
4. What is automotive laser radar (LiDAR)?
- Automotive laser radar (LiDAR) is a sensor technology that uses laser pulses to measure distances and create high-resolution 3D maps for autonomous and advanced driver-assistance systems (ADAS).
5. What are the key factors driving the market growth?
-
Rising adoption of autonomous vehicles requiring high-precision LiDAR systems.
-
Government regulations and safety standards promoting ADAS adoption.
-
Advancements in LiDAR technology, reducing costs and improving performance.
-
Increased investments from automakers and tech companies in self-driving technologies.
Key Reasons to Buy this Report:
- Access to date statistics compiled by our researchers. These provide you with historical and forecast data, which is analyzed to tell you why your market is set to change
- This enables you to anticipate market changes to remain ahead of your competitors
- You will be able to copy data from the Excel spreadsheet straight into your marketing plans, business presentations, or other strategic documents
- The concise analysis, clear graph, and table format will enable you to pinpoint the information you require quickly
- Provision of market value data for each segment and sub-segment
- Indicates the region and segment that is expected to witness the fastest growth as well as to dominate the market
- Analysis by geography highlighting the consumption of the product/service in the region as well as indicating the factors that are affecting the market within each region
- Competitive landscape which incorporates the market ranking of the major players, along with new service/product launches, partnerships, business expansions, and acquisitions in the past five years of companies profiled
- Extensive company profiles comprising of company overview, company insights, product benchmarking, and SWOT analysis for the major market players
- The current as well as the future market outlook of the industry concerning recent developments which involve growth opportunities and drivers as well as challenges and restraints of both emerging as well as developed regions
- Includes in-depth analysis of the market from various perspectives through Porters five forces analysis
- Provides insight into the market through Value Chain
- Market dynamics scenario, along with growth opportunities of the market in the years to come
- 6-month post-sales analyst support
Customization of the Report
- In case of any queries or customization requirements, please connect with our sales team, who will ensure that your requirements are met.
Chapter Outline
- Chapter 1 mainly introduces the statistical scope of the report, market division standards, and market research methods.
- Chapter 2 is an executive summary of different market segments (by region, product type, application, etc), including the market size of each market segment, future development potential, and so on. It offers a high-level view of the current state of the Laser Radar for Automotive Market and its likely evolution in the short to mid-term, and long term.
- Chapter 3 makes a detailed analysis of the market's competitive landscape of the market and provides the market share, capacity, output, price, latest development plan, merger, and acquisition information of the main manufacturers in the market.
- Chapter 4 is the analysis of the whole market industrial chain, including the upstream and downstream of the industry, as well as Porter's five forces analysis.
- Chapter 5 introduces the latest developments of the market, the driving factors and restrictive factors of the market, the challenges and risks faced by manufacturers in the industry, and the analysis of relevant policies in the industry.
- Chapter 6 provides the analysis of various market segments according to product types, covering the market size and development potential of each market segment, to help readers find the blue ocean market in different market segments.
- Chapter 7 provides the analysis of various market segments according to application, covering the market size and development potential of each market segment, to help readers find the blue ocean market in different downstream markets.
- Chapter 8 provides a quantitative analysis of the market size and development potential of each region from the consumer side and its main countries and introduces the market development, future development prospects, market space, and capacity of each country in the world.
- Chapter 9 shares the main producing countries of Laser Radar for Automotive, their output value, profit level, regional supply, production capacity layout, etc. from the supply side.
- Chapter 10 introduces the basic situation of the main companies in the market in detail, including product sales revenue, sales volume, price, gross profit margin, market share, product introduction, recent development, etc.
- Chapter 11 provides a quantitative analysis of the market size and development potential of each region during the forecast period.
- Chapter 12 provides a quantitative analysis of the market size and development potential of each market segment during the forecast period.
- Chapter 13 is the main points and conclusions of the report.
TABLE OF CONTENTS
Table of Contents
1 Research Methodology and Statistical Scope
1.1 Market Definition and Statistical Scope of Laser Radar for Automotive
1.2 Key Market Segments
1.2.1 Laser Radar for Automotive Segment by Type
1.2.2 Laser Radar for Automotive Segment by Application
1.3 Methodology & Sources of Information
1.3.1 Research Methodology
1.3.2 Research Process
1.3.3 Market Breakdown and Data Triangulation
1.3.4 Base Year
1.3.5 Report Assumptions & Caveats
1.4 Key Data of Global Auto Market
1.4.1 Global Automobile Production by Country
1.4.2 Global Automobile Production by Type
2 Laser Radar for Automotive Market Overview
2.1 Global Market Overview
2.1.1 Global Laser Radar for Automotive Market Size (M USD) Estimates and Forecasts (2019-2032)
2.1.2 Global Laser Radar for Automotive Sales Estimates and Forecasts (2019-2032)
2.2 Market Segment Executive Summary
2.3 Global Market Size by Region
3 Laser Radar for Automotive Market Competitive Landscape
3.1 Global Laser Radar for Automotive Sales by Manufacturers (2019-2025)
3.2 Global Laser Radar for Automotive Revenue Market Share by Manufacturers (2019-2025)
3.3 Laser Radar for Automotive Market Share by Company Type (Tier 1, Tier 2, and Tier 3)
3.4 Global Laser Radar for Automotive Average Price by Manufacturers (2019-2025)
3.5 Manufacturers Laser Radar for Automotive Sales Sites, Area Served, Product Type
3.6 Laser Radar for Automotive Market Competitive Situation and Trends
3.6.1 Laser Radar for Automotive Market Concentration Rate
3.6.2 Global 5 and 10 Largest Laser Radar for Automotive Players Market Share by Revenue
3.6.3 Mergers & Acquisitions, Expansion
4 Laser Radar for Automotive Industry Chain Analysis
4.1 Laser Radar for Automotive Industry Chain Analysis
4.2 Market Overview of Key Raw Materials
4.3 Midstream Market Analysis
4.4 Downstream Customer Analysis
5 The Development and Dynamics of Laser Radar for Automotive Market
5.1 Key Development Trends
5.2 Driving Factors
5.3 Market Challenges
5.4 Market Restraints
5.5 Industry News
5.5.1 New Product Developments
5.5.2 Mergers & Acquisitions
5.5.3 Expansions
5.5.4 Collaboration/Supply Contracts
5.6 Industry Policies
6 Laser Radar for Automotive Market Segmentation by Type
6.1 Evaluation Matrix of Segment Market Development Potential (Type)
6.2 Global Laser Radar for Automotive Sales Market Share by Type (2019-2025)
6.3 Global Laser Radar for Automotive Market Size Market Share by Type (2019-2025)
6.4 Global Laser Radar for Automotive Price by Type (2019-2025)
7 Laser Radar for Automotive Market Segmentation by Application
7.1 Evaluation Matrix of Segment Market Development Potential (Application)
7.2 Global Laser Radar for Automotive Market Sales by Application (2019-2025)
7.3 Global Laser Radar for Automotive Market Size (M USD) by Application (2019-2025)
7.4 Global Laser Radar for Automotive Sales Growth Rate by Application (2019-2025)
8 Laser Radar for Automotive Market Consumption by Region
8.1 Global Laser Radar for Automotive Sales by Region
8.1.1 Global Laser Radar for Automotive Sales by Region
8.1.2 Global Laser Radar for Automotive Sales Market Share by Region
8.2 North America
8.2.1 North America Laser Radar for Automotive Sales by Country
8.2.2 U.S.
8.2.3 Canada
8.2.4 Mexico
8.3 Europe
8.3.1 Europe Laser Radar for Automotive Sales by Country
8.3.2 Germany
8.3.3 France
8.3.4 U.K.
8.3.5 Italy
8.3.6 Russia
8.4 Asia Pacific
8.4.1 Asia Pacific Laser Radar for Automotive Sales by Region
8.4.2 China
8.4.3 Japan
8.4.4 South Korea
8.4.5 India
8.4.6 Southeast Asia
8.5 South America
8.5.1 South America Laser Radar for Automotive Sales by Country
8.5.2 Brazil
8.5.3 Argentina
8.5.4 Columbia
8.6 Middle East and Africa
8.6.1 Middle East and Africa Laser Radar for Automotive Sales by Region
8.6.2 Saudi Arabia
8.6.3 UAE
8.6.4 Egypt
8.6.5 Nigeria
8.6.6 South Africa
9 Laser Radar for Automotive Market Production by Region
9.1 Global Production of Laser Radar for Automotive by Region (2019-2025)
9.2 Global Laser Radar for Automotive Revenue Market Share by Region (2019-2025)
9.3 Global Laser Radar for Automotive Production, Revenue, Price and Gross Margin (2019-2025)
9.4 North America Laser Radar for Automotive Production
9.4.1 North America Laser Radar for Automotive Production Growth Rate (2019-2025)
9.4.2 North America Laser Radar for Automotive Production, Revenue, Price and Gross Margin (2019-2025)
9.5 Europe Laser Radar for Automotive Production
9.5.1 Europe Laser Radar for Automotive Production Growth Rate (2019-2025)
9.5.2 Europe Laser Radar for Automotive Production, Revenue, Price and Gross Margin (2019-2025)
9.6 Japan Laser Radar for Automotive Production (2019-2025)
9.6.1 Japan Laser Radar for Automotive Production Growth Rate (2019-2025)
9.6.2 Japan Laser Radar for Automotive Production, Revenue, Price and Gross Margin (2019-2025)
9.7 China Laser Radar for Automotive Production (2019-2025)
9.7.1 China Laser Radar for Automotive Production Growth Rate (2019-2025)
9.7.2 China Laser Radar for Automotive Production, Revenue, Price and Gross Margin (2019-2025)
10 Key Companies Profile
10.1 Trimbel
10.1.1 Trimbel Laser Radar for Automotive Basic Information
10.1.2 Trimbel Laser Radar for Automotive Product Overview
10.1.3 Trimbel Laser Radar for Automotive Product Market Performance
10.1.4 Trimbel Business Overview
10.1.5 Trimbel Laser Radar for Automotive SWOT Analysis
10.1.6 Trimbel Recent Developments
10.2 Hexagon
10.2.1 Hexagon Laser Radar for Automotive Basic Information
10.2.2 Hexagon Laser Radar for Automotive Product Overview
10.2.3 Hexagon Laser Radar for Automotive Product Market Performance
10.2.4 Hexagon Business Overview
10.2.5 Hexagon Laser Radar for Automotive SWOT Analysis
10.2.6 Hexagon Recent Developments
10.3 Sick AG
10.3.1 Sick AG Laser Radar for Automotive Basic Information
10.3.2 Sick AG Laser Radar for Automotive Product Overview
10.3.3 Sick AG Laser Radar for Automotive Product Market Performance
10.3.4 Sick AG Laser Radar for Automotive SWOT Analysis
10.3.5 Sick AG Business Overview
10.3.6 Sick AG Recent Developments
10.4 Topcon Positioning Systems
10.4.1 Topcon Positioning Systems Laser Radar for Automotive Basic Information
10.4.2 Topcon Positioning Systems Laser Radar for Automotive Product Overview
10.4.3 Topcon Positioning Systems Laser Radar for Automotive Product Market Performance
10.4.4 Topcon Positioning Systems Business Overview
10.4.5 Topcon Positioning Systems Recent Developments
10.5 Velodyne
10.5.1 Velodyne Laser Radar for Automotive Basic Information
10.5.2 Velodyne Laser Radar for Automotive Product Overview
10.5.3 Velodyne Laser Radar for Automotive Product Market Performance
10.5.4 Velodyne Business Overview
10.5.5 Velodyne Recent Developments
10.6 Riegl
10.6.1 Riegl Laser Radar for Automotive Basic Information
10.6.2 Riegl Laser Radar for Automotive Product Overview
10.6.3 Riegl Laser Radar for Automotive Product Market Performance
10.6.4 Riegl Business Overview
10.6.5 Riegl Recent Developments
10.7 Valeo
10.7.1 Valeo Laser Radar for Automotive Basic Information
10.7.2 Valeo Laser Radar for Automotive Product Overview
10.7.3 Valeo Laser Radar for Automotive Product Market Performance
10.7.4 Valeo Business Overview
10.7.5 Valeo Recent Developments
10.8 Leosphere
10.8.1 Leosphere Laser Radar for Automotive Basic Information
10.8.2 Leosphere Laser Radar for Automotive Product Overview
10.8.3 Leosphere Laser Radar for Automotive Product Market Performance
10.8.4 Leosphere Business Overview
10.8.5 Leosphere Recent Developments
10.9 Innovusion
10.9.1 Innovusion Laser Radar for Automotive Basic Information
10.9.2 Innovusion Laser Radar for Automotive Product Overview
10.9.3 Innovusion Laser Radar for Automotive Product Market Performance
10.9.4 Innovusion Business Overview
10.9.5 Innovusion Recent Developments
10.10 Hesai Technology
10.10.1 Hesai Technology Laser Radar for Automotive Basic Information
10.10.2 Hesai Technology Laser Radar for Automotive Product Overview
10.10.3 Hesai Technology Laser Radar for Automotive Product Market Performance
10.10.4 Hesai Technology Business Overview
10.10.5 Hesai Technology Recent Developments
10.11 Ibeo
10.11.1 Ibeo Laser Radar for Automotive Basic Information
10.11.2 Ibeo Laser Radar for Automotive Product Overview
10.11.3 Ibeo Laser Radar for Automotive Product Market Performance
10.11.4 Ibeo Business Overview
10.11.5 Ibeo Recent Developments
10.12 Ouster
10.12.1 Ouster Laser Radar for Automotive Basic Information
10.12.2 Ouster Laser Radar for Automotive Product Overview
10.12.3 Ouster Laser Radar for Automotive Product Market Performance
10.12.4 Ouster Business Overview
10.12.5 Ouster Recent Developments
10.13 LeddarTech
10.13.1 LeddarTech Laser Radar for Automotive Basic Information
10.13.2 LeddarTech Laser Radar for Automotive Product Overview
10.13.3 LeddarTech Laser Radar for Automotive Product Market Performance
10.13.4 LeddarTech Business Overview
10.13.5 LeddarTech Recent Developments
10.14 Robosense
10.14.1 Robosense Laser Radar for Automotive Basic Information
10.14.2 Robosense Laser Radar for Automotive Product Overview
10.14.3 Robosense Laser Radar for Automotive Product Market Performance
10.14.4 Robosense Business Overview
10.14.5 Robosense Recent Developments
10.15 Luminar
10.15.1 Luminar Laser Radar for Automotive Basic Information
10.15.2 Luminar Laser Radar for Automotive Product Overview
10.15.3 Luminar Laser Radar for Automotive Product Market Performance
10.15.4 Luminar Business Overview
10.15.5 Luminar Recent Developments
10.16 VanJee Technology
10.16.1 VanJee Technology Laser Radar for Automotive Basic Information
10.16.2 VanJee Technology Laser Radar for Automotive Product Overview
10.16.3 VanJee Technology Laser Radar for Automotive Product Market Performance
10.16.4 VanJee Technology Business Overview
10.16.5 VanJee Technology Recent Developments
10.17 SureStar
10.17.1 SureStar Laser Radar for Automotive Basic Information
10.17.2 SureStar Laser Radar for Automotive Product Overview
10.17.3 SureStar Laser Radar for Automotive Product Market Performance
10.17.4 SureStar Business Overview
10.17.5 SureStar Recent Developments
10.18 Continental
10.18.1 Continental Laser Radar for Automotive Basic Information
10.18.2 Continental Laser Radar for Automotive Product Overview
10.18.3 Continental Laser Radar for Automotive Product Market Performance
10.18.4 Continental Business Overview
10.18.5 Continental Recent Developments
11 Laser Radar for Automotive Market Forecast by Region
11.1 Global Laser Radar for Automotive Market Size Forecast
11.2 Global Laser Radar for Automotive Market Forecast by Region
11.2.1 North America Market Size Forecast by Country
11.2.2 Europe Laser Radar for Automotive Market Size Forecast by Country
11.2.3 Asia Pacific Laser Radar for Automotive Market Size Forecast by Region
11.2.4 South America Laser Radar for Automotive Market Size Forecast by Country
11.2.5 Middle East and Africa Forecasted Consumption of Laser Radar for Automotive by Country
12 Forecast Market by Type and by Application (2025-2032)
12.1 Global Laser Radar for Automotive Market Forecast by Type (2025-2032)
12.1.1 Global Forecasted Sales of Laser Radar for Automotive by Type (2025-2032)
12.1.2 Global Laser Radar for Automotive Market Size Forecast by Type (2025-2032)
12.1.3 Global Forecasted Price of Laser Radar for Automotive by Type (2025-2032)
12.2 Global Laser Radar for Automotive Market Forecast by Application (2025-2032)
12.2.1 Global Laser Radar for Automotive Sales (K Units) Forecast by Application
12.2.2 Global Laser Radar for Automotive Market Size (M USD) Forecast by Application (2025-2032)
13 Conclusion and Key Findings
LIST OF TABLES & FIGURES
List of Tables
Table 1. Introduction of the Type
Table 2. Introduction of the Application
Table 3. Motor Vehicle Production Market Share by Type (2023)
Table 4. Global Automobile Production by Region (Units)
Table 5. Market Share and Development Potential of Automobiles by Region
Table 6. Global Automobile Production by Country (Vehicle)
Table 7. Market Share and Development Potential of Automobiles by Countries
Table 8. Global Automobile Production by Type
Table 9. Market Share and Development Potential of Automobiles by Type
Table 10. Market Size (M USD) Segment Executive Summary
Table 11. Laser Radar for Automotive Market Size Comparison by Region (M USD)
Table 12. Global Laser Radar for Automotive Sales (K Units) by Manufacturers (2019-2025)
Table 13. Global Laser Radar for Automotive Sales Market Share by Manufacturers (2019-2025)
Table 14. Global Laser Radar for Automotive Revenue (M USD) by Manufacturers (2019-2025)
Table 15. Global Laser Radar for Automotive Revenue Share by Manufacturers (2019-2025)
Table 16. Company Type (Tier 1, Tier 2, and Tier 3) & (based on the Revenue in Laser Radar for Automotive as of 2022)
Table 17. Global Market Laser Radar for Automotive Average Price (USD/Unit) of Key Manufacturers (2019-2025)
Table 18. Manufacturers Laser Radar for Automotive Sales Sites and Area Served
Table 19. Manufacturers Laser Radar for Automotive Product Type
Table 20. Global Laser Radar for Automotive Manufacturers Market Concentration Ratio (CR5 and HHI)
Table 21. Mergers & Acquisitions, Expansion Plans
Table 22. Industry Chain Map of Laser Radar for Automotive
Table 23. Market Overview of Key Raw Materials
Table 24. Midstream Market Analysis
Table 25. Downstream Customer Analysis
Table 26. Key Development Trends
Table 27. Driving Factors
Table 28. Laser Radar for Automotive Market Challenges
Table 29. Global Laser Radar for Automotive Sales by Type (K Units)
Table 30. Global Laser Radar for Automotive Market Size by Type (M USD)
Table 31. Global Laser Radar for Automotive Sales (K Units) by Type (2019-2025)
Table 32. Global Laser Radar for Automotive Sales Market Share by Type (2019-2025)
Table 33. Global Laser Radar for Automotive Market Size (M USD) by Type (2019-2025)
Table 34. Global Laser Radar for Automotive Market Size Share by Type (2019-2025)
Table 35. Global Laser Radar for Automotive Price (USD/Unit) by Type (2019-2025)
Table 36. Global Laser Radar for Automotive Sales (K Units) by Application
Table 37. Global Laser Radar for Automotive Market Size by Application
Table 38. Global Laser Radar for Automotive Sales by Application (2019-2025) & (K Units)
Table 39. Global Laser Radar for Automotive Sales Market Share by Application (2019-2025)
Table 40. Global Laser Radar for Automotive Sales by Application (2019-2025) & (M USD)
Table 41. Global Laser Radar for Automotive Market Share by Application (2019-2025)
Table 42. Global Laser Radar for Automotive Sales Growth Rate by Application (2019-2025)
Table 43. Global Laser Radar for Automotive Sales by Region (2019-2025) & (K Units)
Table 44. Global Laser Radar for Automotive Sales Market Share by Region (2019-2025)
Table 45. North America Laser Radar for Automotive Sales by Country (2019-2025) & (K Units)
Table 46. Europe Laser Radar for Automotive Sales by Country (2019-2025) & (K Units)
Table 47. Asia Pacific Laser Radar for Automotive Sales by Region (2019-2025) & (K Units)
Table 48. South America Laser Radar for Automotive Sales by Country (2019-2025) & (K Units)
Table 49. Middle East and Africa Laser Radar for Automotive Sales by Region (2019-2025) & (K Units)
Table 50. Global Laser Radar for Automotive Production (K Units) by Region (2019-2025)
Table 51. Global Laser Radar for Automotive Revenue (US$ Million) by Region (2019-2025)
Table 52. Global Laser Radar for Automotive Revenue Market Share by Region (2019-2025)
Table 53. Global Laser Radar for Automotive Production (K Units), Revenue (US$ Million), Price (USD/Unit) and Gross Margin (2019-2025)
Table 54. North America Laser Radar for Automotive Production (K Units), Revenue (US$ Million), Price (USD/Unit) and Gross Margin (2019-2025)
Table 55. Europe Laser Radar for Automotive Production (K Units), Revenue (US$ Million), Price (USD/Unit) and Gross Margin (2019-2025)
Table 56. Japan Laser Radar for Automotive Production (K Units), Revenue (US$ Million), Price (USD/Unit) and Gross Margin (2019-2025)
Table 57. China Laser Radar for Automotive Production (K Units), Revenue (US$ Million), Price (USD/Unit) and Gross Margin (2019-2025)
Table 58. Trimbel Laser Radar for Automotive Basic Information
Table 59. Trimbel Laser Radar for Automotive Product Overview
Table 60. Trimbel Laser Radar for Automotive Sales (K Units), Revenue (M USD), Price (USD/Unit) and Gross Margin (2019-2025)
Table 61. Trimbel Business Overview
Table 62. Trimbel Laser Radar for Automotive SWOT Analysis
Table 63. Trimbel Recent Developments
Table 64. Hexagon Laser Radar for Automotive Basic Information
Table 65. Hexagon Laser Radar for Automotive Product Overview
Table 66. Hexagon Laser Radar for Automotive Sales (K Units), Revenue (M USD), Price (USD/Unit) and Gross Margin (2019-2025)
Table 67. Hexagon Business Overview
Table 68. Hexagon Laser Radar for Automotive SWOT Analysis
Table 69. Hexagon Recent Developments
Table 70. Sick AG Laser Radar for Automotive Basic Information
Table 71. Sick AG Laser Radar for Automotive Product Overview
Table 72. Sick AG Laser Radar for Automotive Sales (K Units), Revenue (M USD), Price (USD/Unit) and Gross Margin (2019-2025)
Table 73. Sick AG Laser Radar for Automotive SWOT Analysis
Table 74. Sick AG Business Overview
Table 75. Sick AG Recent Developments
Table 76. Topcon Positioning Systems Laser Radar for Automotive Basic Information
Table 77. Topcon Positioning Systems Laser Radar for Automotive Product Overview
Table 78. Topcon Positioning Systems Laser Radar for Automotive Sales (K Units), Revenue (M USD), Price (USD/Unit) and Gross Margin (2019-2025)
Table 79. Topcon Positioning Systems Business Overview
Table 80. Topcon Positioning Systems Recent Developments
Table 81. Velodyne Laser Radar for Automotive Basic Information
Table 82. Velodyne Laser Radar for Automotive Product Overview
Table 83. Velodyne Laser Radar for Automotive Sales (K Units), Revenue (M USD), Price (USD/Unit) and Gross Margin (2019-2025)
Table 84. Velodyne Business Overview
Table 85. Velodyne Recent Developments
Table 86. Riegl Laser Radar for Automotive Basic Information
Table 87. Riegl Laser Radar for Automotive Product Overview
Table 88. Riegl Laser Radar for Automotive Sales (K Units), Revenue (M USD), Price (USD/Unit) and Gross Margin (2019-2025)
Table 89. Riegl Business Overview
Table 90. Riegl Recent Developments
Table 91. Valeo Laser Radar for Automotive Basic Information
Table 92. Valeo Laser Radar for Automotive Product Overview
Table 93. Valeo Laser Radar for Automotive Sales (K Units), Revenue (M USD), Price (USD/Unit) and Gross Margin (2019-2025)
Table 94. Valeo Business Overview
Table 95. Valeo Recent Developments
Table 96. Leosphere Laser Radar for Automotive Basic Information
Table 97. Leosphere Laser Radar for Automotive Product Overview
Table 98. Leosphere Laser Radar for Automotive Sales (K Units), Revenue (M USD), Price (USD/Unit) and Gross Margin (2019-2025)
Table 99. Leosphere Business Overview
Table 100. Leosphere Recent Developments
Table 101. Innovusion Laser Radar for Automotive Basic Information
Table 102. Innovusion Laser Radar for Automotive Product Overview
Table 103. Innovusion Laser Radar for Automotive Sales (K Units), Revenue (M USD), Price (USD/Unit) and Gross Margin (2019-2025)
Table 104. Innovusion Business Overview
Table 105. Innovusion Recent Developments
Table 106. Hesai Technology Laser Radar for Automotive Basic Information
Table 107. Hesai Technology Laser Radar for Automotive Product Overview
Table 108. Hesai Technology Laser Radar for Automotive Sales (K Units), Revenue (M USD), Price (USD/Unit) and Gross Margin (2019-2025)
Table 109. Hesai Technology Business Overview
Table 110. Hesai Technology Recent Developments
Table 111. Ibeo Laser Radar for Automotive Basic Information
Table 112. Ibeo Laser Radar for Automotive Product Overview
Table 113. Ibeo Laser Radar for Automotive Sales (K Units), Revenue (M USD), Price (USD/Unit) and Gross Margin (2019-2025)
Table 114. Ibeo Business Overview
Table 115. Ibeo Recent Developments
Table 116. Ouster Laser Radar for Automotive Basic Information
Table 117. Ouster Laser Radar for Automotive Product Overview
Table 118. Ouster Laser Radar for Automotive Sales (K Units), Revenue (M USD), Price (USD/Unit) and Gross Margin (2019-2025)
Table 119. Ouster Business Overview
Table 120. Ouster Recent Developments
Table 121. LeddarTech Laser Radar for Automotive Basic Information
Table 122. LeddarTech Laser Radar for Automotive Product Overview
Table 123. LeddarTech Laser Radar for Automotive Sales (K Units), Revenue (M USD), Price (USD/Unit) and Gross Margin (2019-2025)
Table 124. LeddarTech Business Overview
Table 125. LeddarTech Recent Developments
Table 126. Robosense Laser Radar for Automotive Basic Information
Table 127. Robosense Laser Radar for Automotive Product Overview
Table 128. Robosense Laser Radar for Automotive Sales (K Units), Revenue (M USD), Price (USD/Unit) and Gross Margin (2019-2025)
Table 129. Robosense Business Overview
Table 130. Robosense Recent Developments
Table 131. Luminar Laser Radar for Automotive Basic Information
Table 132. Luminar Laser Radar for Automotive Product Overview
Table 133. Luminar Laser Radar for Automotive Sales (K Units), Revenue (M USD), Price (USD/Unit) and Gross Margin (2019-2025)
Table 134. Luminar Business Overview
Table 135. Luminar Recent Developments
Table 136. VanJee Technology Laser Radar for Automotive Basic Information
Table 137. VanJee Technology Laser Radar for Automotive Product Overview
Table 138. VanJee Technology Laser Radar for Automotive Sales (K Units), Revenue (M USD), Price (USD/Unit) and Gross Margin (2019-2025)
Table 139. VanJee Technology Business Overview
Table 140. VanJee Technology Recent Developments
Table 141. SureStar Laser Radar for Automotive Basic Information
Table 142. SureStar Laser Radar for Automotive Product Overview
Table 143. SureStar Laser Radar for Automotive Sales (K Units), Revenue (M USD), Price (USD/Unit) and Gross Margin (2019-2025)
Table 144. SureStar Business Overview
Table 145. SureStar Recent Developments
Table 146. Continental Laser Radar for Automotive Basic Information
Table 147. Continental Laser Radar for Automotive Product Overview
Table 148. Continental Laser Radar for Automotive Sales (K Units), Revenue (M USD), Price (USD/Unit) and Gross Margin (2019-2025)
Table 149. Continental Business Overview
Table 150. Continental Recent Developments
Table 151. Global Laser Radar for Automotive Sales Forecast by Region (2025-2032) & (K Units)
Table 152. Global Laser Radar for Automotive Market Size Forecast by Region (2025-2032) & (M USD)
Table 153. North America Laser Radar for Automotive Sales Forecast by Country (2025-2032) & (K Units)
Table 154. North America Laser Radar for Automotive Market Size Forecast by Country (2025-2032) & (M USD)
Table 155. Europe Laser Radar for Automotive Sales Forecast by Country (2025-2032) & (K Units)
Table 156. Europe Laser Radar for Automotive Market Size Forecast by Country (2025-2032) & (M USD)
Table 157. Asia Pacific Laser Radar for Automotive Sales Forecast by Region (2025-2032) & (K Units)
Table 158. Asia Pacific Laser Radar for Automotive Market Size Forecast by Region (2025-2032) & (M USD)
Table 159. South America Laser Radar for Automotive Sales Forecast by Country (2025-2032) & (K Units)
Table 160. South America Laser Radar for Automotive Market Size Forecast by Country (2025-2032) & (M USD)
Table 161. Middle East and Africa Laser Radar for Automotive Consumption Forecast by Country (2025-2032) & (Units)
Table 162. Middle East and Africa Laser Radar for Automotive Market Size Forecast by Country (2025-2032) & (M USD)
Table 163. Global Laser Radar for Automotive Sales Forecast by Type (2025-2032) & (K Units)
Table 164. Global Laser Radar for Automotive Market Size Forecast by Type (2025-2032) & (M USD)
Table 165. Global Laser Radar for Automotive Price Forecast by Type (2025-2032) & (USD/Unit)
Table 166. Global Laser Radar for Automotive Sales (K Units) Forecast by Application (2025-2032)
Table 167. Global Laser Radar for Automotive Market Size Forecast by Application (2025-2032) & (M USD)
List of Figures
Figure 1. Product Picture of Laser Radar for Automotive
Figure 2. Data Triangulation
Figure 3. Key Caveats
Figure 4. Global Motor Vehicle Production (M Units)
Figure 5. Global Laser Radar for Automotive Market Size (M USD), 2019-2032
Figure 6. Global Laser Radar for Automotive Market Size (M USD) (2019-2032)
Figure 7. Global Laser Radar for Automotive Sales (K Units) & (2019-2032)
Figure 8. Evaluation Matrix of Segment Market Development Potential (Type)
Figure 9. Evaluation Matrix of Segment Market Development Potential (Application)
Figure 10. Evaluation Matrix of Regional Market Development Potential
Figure 11. Laser Radar for Automotive Market Size by Country (M USD)
Figure 12. Laser Radar for Automotive Sales Share by Manufacturers in 2023
Figure 13. Global Laser Radar for Automotive Revenue Share by Manufacturers in 2023
Figure 14. Laser Radar for Automotive Market Share by Company Type (Tier 1, Tier 2 and Tier 3): 2023
Figure 15. Global Market Laser Radar for Automotive Average Price (USD/Unit) of Key Manufacturers in 2023
Figure 16. The Global 5 and 10 Largest Players: Market Share by Laser Radar for Automotive Revenue in 2023
Figure 17. Evaluation Matrix of Segment Market Development Potential (Type)
Figure 18. Global Laser Radar for Automotive Market Share by Type
Figure 19. Sales Market Share of Laser Radar for Automotive by Type (2019-2025)
Figure 20. Sales Market Share of Laser Radar for Automotive by Type in 2023
Figure 21. Market Size Share of Laser Radar for Automotive by Type (2019-2025)
Figure 22. Market Size Market Share of Laser Radar for Automotive by Type in 2023
Figure 23. Evaluation Matrix of Segment Market Development Potential (Application)
Figure 24. Global Laser Radar for Automotive Market Share by Application
Figure 25. Global Laser Radar for Automotive Sales Market Share by Application (2019-2025)
Figure 26. Global Laser Radar for Automotive Sales Market Share by Application in 2023
Figure 27. Global Laser Radar for Automotive Market Share by Application (2019-2025)
Figure 28. Global Laser Radar for Automotive Market Share by Application in 2023
Figure 29. Global Laser Radar for Automotive Sales Growth Rate by Application (2019-2025)
Figure 30. Global Laser Radar for Automotive Sales Market Share by Region (2019-2025)
Figure 31. North America Laser Radar for Automotive Sales and Growth Rate (2019-2025) & (K Units)
Figure 32. North America Laser Radar for Automotive Sales Market Share by Country in 2023
Figure 33. U.S. Laser Radar for Automotive Sales and Growth Rate (2019-2025) & (K Units)
Figure 34. Canada Laser Radar for Automotive Sales (K Units) and Growth Rate (2019-2025)
Figure 35. Mexico Laser Radar for Automotive Sales (Units) and Growth Rate (2019-2025)
Figure 36. Europe Laser Radar for Automotive Sales and Growth Rate (2019-2025) & (K Units)
Figure 37. Europe Laser Radar for Automotive Sales Market Share by Country in 2023
Figure 38. Germany Laser Radar for Automotive Sales and Growth Rate (2019-2025) & (K Units)
Figure 39. France Laser Radar for Automotive Sales and Growth Rate (2019-2025) & (K Units)
Figure 40. U.K. Laser Radar for Automotive Sales and Growth Rate (2019-2025) & (K Units)
Figure 41. Italy Laser Radar for Automotive Sales and Growth Rate (2019-2025) & (K Units)
Figure 42. Russia Laser Radar for Automotive Sales and Growth Rate (2019-2025) & (K Units)
Figure 43. Asia Pacific Laser Radar for Automotive Sales and Growth Rate (K Units)
Figure 44. Asia Pacific Laser Radar for Automotive Sales Market Share by Region in 2023
Figure 45. China Laser Radar for Automotive Sales and Growth Rate (2019-2025) & (K Units)
Figure 46. Japan Laser Radar for Automotive Sales and Growth Rate (2019-2025) & (K Units)
Figure 47. South Korea Laser Radar for Automotive Sales and Growth Rate (2019-2025) & (K Units)
Figure 48. India Laser Radar for Automotive Sales and Growth Rate (2019-2025) & (K Units)
Figure 49. Southeast Asia Laser Radar for Automotive Sales and Growth Rate (2019-2025) & (K Units)
Figure 50. South America Laser Radar for Automotive Sales and Growth Rate (K Units)
Figure 51. South America Laser Radar for Automotive Sales Market Share by Country in 2023
Figure 52. Brazil Laser Radar for Automotive Sales and Growth Rate (2019-2025) & (K Units)
Figure 53. Argentina Laser Radar for Automotive Sales and Growth Rate (2019-2025) & (K Units)
Figure 54. Columbia Laser Radar for Automotive Sales and Growth Rate (2019-2025) & (K Units)
Figure 55. Middle East and Africa Laser Radar for Automotive Sales and Growth Rate (K Units)
Figure 56. Middle East and Africa Laser Radar for Automotive Sales Market Share by Region in 2023
Figure 57. Saudi Arabia Laser Radar for Automotive Sales and Growth Rate (2019-2025) & (K Units)
Figure 58. UAE Laser Radar for Automotive Sales and Growth Rate (2019-2025) & (K Units)
Figure 59. Egypt Laser Radar for Automotive Sales and Growth Rate (2019-2025) & (K Units)
Figure 60. Nigeria Laser Radar for Automotive Sales and Growth Rate (2019-2025) & (K Units)
Figure 61. South Africa Laser Radar for Automotive Sales and Growth Rate (2019-2025) & (K Units)
Figure 62. Global Laser Radar for Automotive Production Market Share by Region (2019-2025)
Figure 63. North America Laser Radar for Automotive Production (K Units) Growth Rate (2019-2025)
Figure 64. Europe Laser Radar for Automotive Production (K Units) Growth Rate (2019-2025)
Figure 65. Japan Laser Radar for Automotive Production (K Units) Growth Rate (2019-2025)
Figure 66. China Laser Radar for Automotive Production (K Units) Growth Rate (2019-2025)
Figure 67. Global Laser Radar for Automotive Sales Forecast by Volume (2019-2032) & (K Units)
Figure 68. Global Laser Radar for Automotive Market Size Forecast by Value (2019-2032) & (M USD)
Figure 69. Global Laser Radar for Automotive Sales Market Share Forecast by Type (2025-2032)
Figure 70. Global Laser Radar for Automotive Market Share Forecast by Type (2025-2032)
Figure 71. Global Laser Radar for Automotive Sales Forecast by Application (2025-2032)
Figure 72. Global Laser Radar for Automotive Market Share Forecast by Application (2025-2032)

