Micro Electric Vehicles (EVs) are compact, energy-efficient vehicles that provide an eco-friendly alternative for short-distance travel. These vehicles are designed to be more space-efficient and offer a sustainable mode of transport in urban environments. They typically feature a low-powered drivetrain, a compact battery system, and offer a range of about 200 km on a single charge. The top speed of micro EVs generally ranges between 60 to 100 km/h, making them ideal for city commutes and short-distance trips.
Micro EVs come in two major types: pure electric and hybrid electric. Pure electric micro EVs run entirely on electric power, while hybrid models combine an electric motor with a traditional combustion engine, offering better range and flexibility for users.
Micro EVs are ideal for those looking for a low-cost, environmentally friendly, and efficient alternative to conventional vehicles. Their compact size allows them to be used in crowded city areas where space is limited, contributing to reduced traffic congestion and pollution.
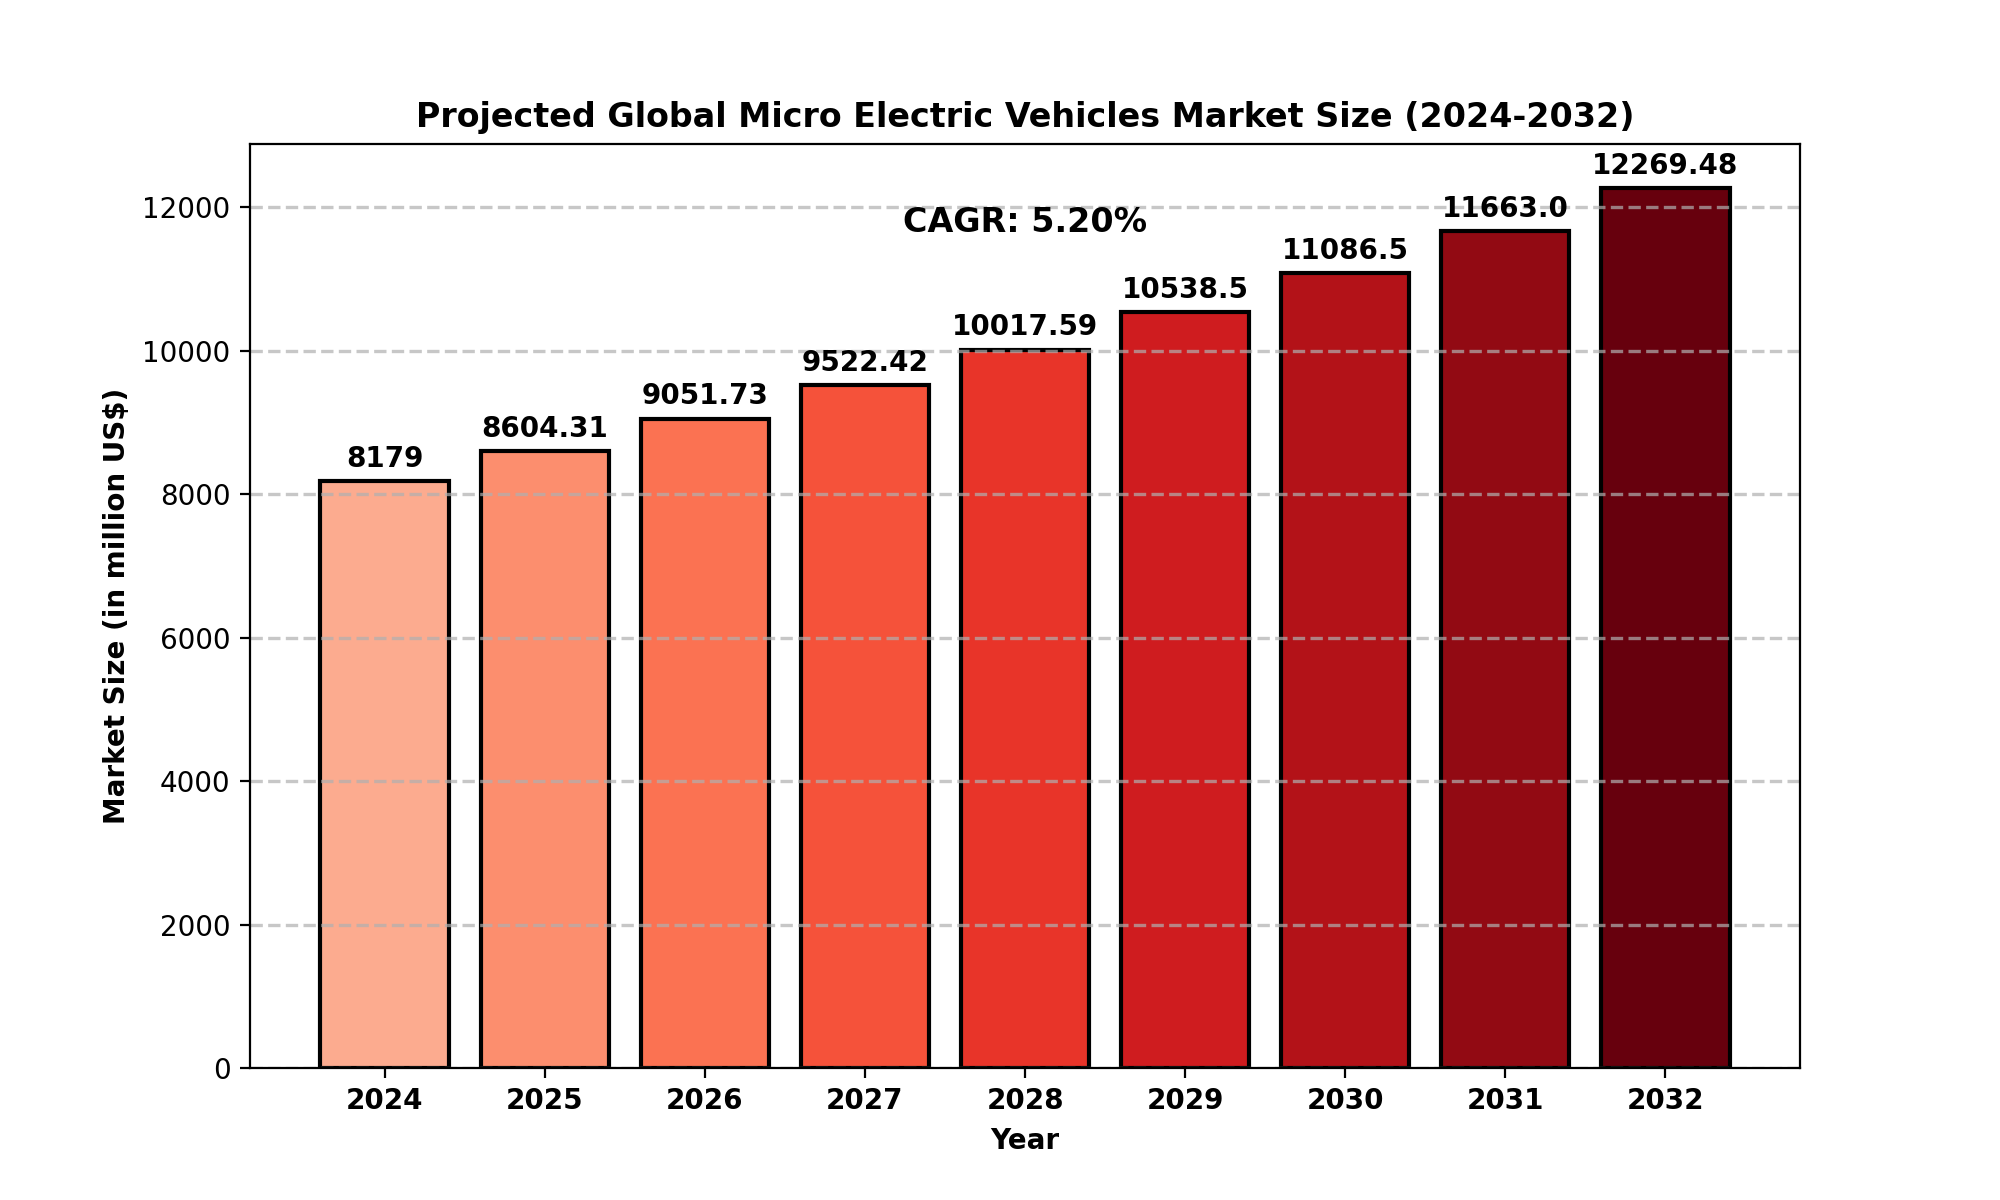
Market Size
The global Micro Electric Vehicles market is experiencing significant growth. As of 2024, the market size was estimated at USD 8,179 million and is projected to reach USD 12,269.48 million by 2032. This growth is expected to occur at a Compound Annual Growth Rate (CAGR) of 5.20% during the forecast period.
Several factors contribute to this growth, including advancements in battery technology, government initiatives to promote electric mobility, and the increasing demand for sustainable transport solutions. The growing awareness of climate change and air pollution is also pushing consumers towards cleaner alternatives like micro EVs.
The demand for micro EVs is anticipated to continue to rise, particularly in regions with stringent emission regulations and policies that promote electric mobility. Micro EVs' affordability, coupled with the growing network of EV charging infrastructure, is further driving the market’s expansion.
Market Dynamics (Drivers, Restraints, Opportunities, and Challenges)
Drivers
-
Rising Environmental Concerns: As awareness of climate change and environmental pollution increases, consumers are seeking eco-friendly transportation options, including micro EVs.
-
Government Support: Many governments worldwide are providing incentives, subsidies, and rebates for electric vehicle purchases, which significantly enhances the adoption rate of micro EVs.
-
Urbanization and Traffic Congestion: With cities becoming more densely populated, the demand for compact and efficient vehicles like micro EVs is surging. These vehicles offer a perfect solution to crowded urban environments.
-
Technological Advancements: Innovations in battery technology and improvements in energy efficiency have made micro EVs more affordable and practical for daily use.
Restraints
-
Limited Range: Micro EVs typically offer a limited driving range compared to traditional electric or gasoline-powered vehicles, which may not meet the needs of long-distance commuters.
-
Charging Infrastructure: Although EV charging stations are increasing, the lack of widespread and convenient charging infrastructure remains a challenge in some regions.
-
High Initial Cost: The upfront cost of micro EVs, although generally lower than conventional electric cars, may still be a deterrent for some consumers, particularly in developing regions.
Opportunities
-
Expansion in Emerging Markets: Countries in Asia, Africa, and South America are expected to become significant markets for micro EVs as their economies develop and demand for sustainable transport increases.
-
Integration with Smart Cities: Micro EVs are well-suited for integration into smart city initiatives, which focus on reducing emissions, improving traffic flow, and enhancing sustainability.
-
Autonomous Micro EVs: The development of autonomous driving technology presents new opportunities for micro EVs, particularly in shared mobility services.
Challenges
-
Competition from Other EV Segments: The micro EV market faces competition from larger electric vehicles and hybrids, which may offer more power, range, and features.
-
Battery Life and Durability: Battery performance remains a significant challenge, as micro EVs depend heavily on battery technology for efficiency and range. Managing battery longevity and minimizing degradation will be key to ensuring the market’s sustainability.
-
Regulatory and Safety Concerns: Regulatory policies regarding vehicle safety standards and emissions regulations are constantly evolving, and companies must comply with these regulations to avoid fines and market restrictions.
Regional Analysis
North America
The North American micro EV market is experiencing steady growth, with the U.S., Canada, and Mexico leading the way. Government incentives, such as tax credits for electric vehicles, have boosted the adoption of EVs. However, the micro EV segment faces strong competition from traditional electric vehicles like Tesla, which offer better performance and range. Despite this, micro EVs are expected to grow at a CAGR of 4.46% between 2025 and 2032.
Europe
Europe is one of the largest markets for micro EVs, driven by the region’s aggressive environmental policies, high urbanization rates, and government subsidies. Countries like the UK, France, and Germany are leading the way in adopting electric vehicles, including micro EVs. The European Union's stringent emissions targets are pushing consumers and businesses toward cleaner transportation options.
Asia-Pacific
Asia-Pacific is expected to dominate the global market due to the large population, rapid urbanization, and government support for green transportation. China, Japan, and India are significant players in the micro EV market. China, in particular, has become a hub for electric vehicle production, and its policies favoring electric mobility continue to drive market growth.
South America
In South America, the micro EV market is still in its nascent stage but is expected to grow as the demand for sustainable transport solutions increases. Brazil and Argentina are expected to lead the region's market as they begin to implement more pro-electric vehicle policies.
The Middle East and Africa
The market in the Middle East and Africa remains relatively small, but there are growing efforts to integrate electric vehicles into the region. Countries like the UAE and South Africa are gradually adopting electric mobility as part of their sustainability goals.
Competitor Analysis
Several global players dominate the micro electric vehicles market, including:
-
Tesla: Known for its high-performance electric vehicles, Tesla has expanded its offerings to include smaller, more affordable EVs. Its innovative battery technology and autonomous driving capabilities give it a competitive edge.
-
Renault: Renault has been a key player in the electric vehicle market, offering models such as the Renault Twizy, which has captured significant attention for urban commuting.
-
Toyota: Toyota has entered the micro EV market with models designed for short-distance travel. Its commitment to sustainability and innovation gives it a strong position in the market.
-
BMW: BMW's i3 has been one of the more well-known micro EVs, offering an upscale, eco-friendly driving experience.
-
Audi and Ford: Both companies have shown interest in developing compact electric vehicles to cater to urban markets and increase their EV market share.
Global Micro Electric Vehicles: Market Segmentation Analysis
This report provides a deep insight into the global Micro Electric Vehicles market, covering all its essential aspects. This ranges from a macro overview of the market to micro details of the market size, competitive landscape, development trend, niche market, key market drivers and challenges, SWOT analysis, value chain analysis, etc.
The analysis helps the reader to shape the competition within the industries and strategies for the competitive environment to enhance the potential profit. Furthermore, it provides a simple framework for evaluating and assessing the position of the business organization. The report structure also focuses on the competitive landscape of the Global Micro Electric Vehicles Market. This report introduces in detail the market share, market performance, product situation, operation situation, etc., of the main players, which helps the readers in the industry to identify the main competitors and deeply understand the competition pattern of the market.
In a word, this report is a must-read for industry players, investors, researchers, consultants, business strategists, and all those who have any kind of stake or are planning to foray into the Micro Electric Vehicles market in any manner.
Market Segmentation (by Application)
-
Household: Micro EVs are increasingly being used for household purposes, especially in urban areas where short trips are common. These vehicles offer a convenient, cost-effective mode of transportation for daily commuting and local errands.
-
Commercial: Commercial applications for micro EVs are gaining traction, particularly in fleet operations for last-mile delivery services, taxis, and shared mobility solutions. Their affordability and efficiency make them ideal for businesses looking to cut costs and reduce emissions.
Market Segmentation (by Type)
-
Pure Electric: These vehicles run entirely on electricity and require no gasoline or diesel fuel. They are eco-friendly and efficient for short-distance trips.
-
Hybrid Electric: Hybrid electric micro EVs combine an electric motor with a traditional internal combustion engine, providing greater range and flexibility.
Key Company
-
Tesla
-
Renault
-
Toyota
-
BMW
-
Audi
-
BYD
-
Ford
-
Honda
-
Alta
-
E-Rex
-
Jinhua
-
Sanyo System
Geographic Segmentation
-
North America (USA, Canada, Mexico)
-
Europe (Germany, UK, France, Russia, Italy, Rest of Europe)
-
Asia-Pacific (China, Japan, South Korea, India, Southeast Asia, Rest of Asia-Pacific)
-
South America (Brazil, Argentina, Columbia, Rest of South America)
-
The Middle East and Africa (Saudi Arabia, UAE, Egypt, Nigeria, South Africa, Rest of MEA)
FAQ Section
1. What is the current market size of the Micro Electric Vehicles market?
- The market size of the Micro Electric Vehicles market was estimated at USD 8,179 million in 2024 and is expected to reach USD 12,907.49 million by 2032.
2. Which are the key companies operating in the Micro Electric Vehicles market?
- Key companies in the Micro Electric Vehicles market include Tesla, Renault, Toyota, BMW, Audi, BYD, Ford, and Honda.
3. What are the key growth drivers in the Micro Electric Vehicles market?
- Growth drivers include rising environmental concerns, government support, urbanization, and technological advancements in battery technology.
4. Which regions dominate the Micro Electric Vehicles market?
- Asia-Pacific, particularly China, Japan, and India, dominate the global market, with Europe and North America also contributing significantly to the market share.
5. What are the emerging trends in the Micro Electric Vehicles market?
- Emerging trends include the adoption of autonomous driving technology, smart city integration, and the expansion of electric vehicle infrastructure globally.
Key Benefits of This Market Research:
- Industry drivers, restraints, and opportunities covered in the study
- Neutral perspective on the market performance
- Recent industry trends and developments
- Competitive landscape & strategies of key players
- Potential & niche segments and regions exhibiting promising growth covered
- Historical, current, and projected market size, in terms of value
- In-depth analysis of the Micro Electric Vehicles Market
- Overview of the regional outlook of the Micro Electric Vehicles Market:
Key Reasons to Buy this Report:
- Access to date statistics compiled by our researchers. These provide you with historical and forecast data, which is analyzed to tell you why your market is set to change
- This enables you to anticipate market changes to remain ahead of your competitors
- You will be able to copy data from the Excel spreadsheet straight into your marketing plans, business presentations, or other strategic documents
- The concise analysis, clear graph, and table format will enable you to pinpoint the information you require quickly
- Provision of market value data for each segment and sub-segment
- Indicates the region and segment that is expected to witness the fastest growth as well as to dominate the market
- Analysis by geography highlighting the consumption of the product/service in the region as well as indicating the factors that are affecting the market within each region
- Competitive landscape which incorporates the market ranking of the major players, along with new service/product launches, partnerships, business expansions, and acquisitions in the past five years of companies profiled
- Extensive company profiles comprising of company overview, company insights, product benchmarking, and SWOT analysis for the major market players
- The current as well as the future market outlook of the industry concerning recent developments which involve growth opportunities and drivers as well as challenges and restraints of both emerging as well as developed regions
- Includes in-depth analysis of the market from various perspectives through Porter
TABLE OF CONTENTS
Table of Contents
1 Research Methodology and Statistical Scope
1.1 Market Definition and Statistical Scope of Micro Electric Vehicles
1.2 Key Market Segments
1.2.1 Micro Electric Vehicles Segment by Type
1.2.2 Micro Electric Vehicles Segment by Application
1.3 Methodology & Sources of Information
1.3.1 Research Methodology
1.3.2 Research Process
1.3.3 Market Breakdown and Data Triangulation
1.3.4 Base Year
1.3.5 Report Assumptions & Caveats
1.4 Key Data of Global Auto Market
1.4.1 Global Automobile Production by Country
1.4.2 Global Automobile Production by Type
2 Micro Electric Vehicles Market Overview
2.1 Global Market Overview
2.1.1 Global Micro Electric Vehicles Market Size (M USD) Estimates and Forecasts (2019-2032)
2.1.2 Global Micro Electric Vehicles Sales Estimates and Forecasts (2019-2032)
2.2 Market Segment Executive Summary
2.3 Global Market Size by Region
3 Micro Electric Vehicles Market Competitive Landscape
3.1 Global Micro Electric Vehicles Sales by Manufacturers (2019-2025)
3.2 Global Micro Electric Vehicles Revenue Market Share by Manufacturers (2019-2025)
3.3 Micro Electric Vehicles Market Share by Company Type (Tier 1, Tier 2, and Tier 3)
3.4 Global Micro Electric Vehicles Average Price by Manufacturers (2019-2025)
3.5 Manufacturers Micro Electric Vehicles Sales Sites, Area Served, Product Type
3.6 Micro Electric Vehicles Market Competitive Situation and Trends
3.6.1 Micro Electric Vehicles Market Concentration Rate
3.6.2 Global 5 and 10 Largest Micro Electric Vehicles Players Market Share by Revenue
3.6.3 Mergers & Acquisitions, Expansion
4 Micro Electric Vehicles Industry Chain Analysis
4.1 Micro Electric Vehicles Industry Chain Analysis
4.2 Market Overview of Key Raw Materials
4.3 Midstream Market Analysis
4.4 Downstream Customer Analysis
5 The Development and Dynamics of Micro Electric Vehicles Market
5.1 Key Development Trends
5.2 Driving Factors
5.3 Market Challenges
5.4 Market Restraints
5.5 Industry News
5.5.1 New Product Developments
5.5.2 Mergers & Acquisitions
5.5.3 Expansions
5.5.4 Collaboration/Supply Contracts
5.6 Industry Policies
6 Micro Electric Vehicles Market Segmentation by Type
6.1 Evaluation Matrix of Segment Market Development Potential (Type)
6.2 Global Micro Electric Vehicles Sales Market Share by Type (2019-2025)
6.3 Global Micro Electric Vehicles Market Size Market Share by Type (2019-2025)
6.4 Global Micro Electric Vehicles Price by Type (2019-2025)
7 Micro Electric Vehicles Market Segmentation by Application
7.1 Evaluation Matrix of Segment Market Development Potential (Application)
7.2 Global Micro Electric Vehicles Market Sales by Application (2019-2025)
7.3 Global Micro Electric Vehicles Market Size (M USD) by Application (2019-2025)
7.4 Global Micro Electric Vehicles Sales Growth Rate by Application (2019-2025)
8 Micro Electric Vehicles Market Consumption by Region
8.1 Global Micro Electric Vehicles Sales by Region
8.1.1 Global Micro Electric Vehicles Sales by Region
8.1.2 Global Micro Electric Vehicles Sales Market Share by Region
8.2 North America
8.2.1 North America Micro Electric Vehicles Sales by Country
8.2.2 U.S.
8.2.3 Canada
8.2.4 Mexico
8.3 Europe
8.3.1 Europe Micro Electric Vehicles Sales by Country
8.3.2 Germany
8.3.3 France
8.3.4 U.K.
8.3.5 Italy
8.3.6 Russia
8.4 Asia Pacific
8.4.1 Asia Pacific Micro Electric Vehicles Sales by Region
8.4.2 China
8.4.3 Japan
8.4.4 South Korea
8.4.5 India
8.4.6 Southeast Asia
8.5 South America
8.5.1 South America Micro Electric Vehicles Sales by Country
8.5.2 Brazil
8.5.3 Argentina
8.5.4 Columbia
8.6 Middle East and Africa
8.6.1 Middle East and Africa Micro Electric Vehicles Sales by Region
8.6.2 Saudi Arabia
8.6.3 UAE
8.6.4 Egypt
8.6.5 Nigeria
8.6.6 South Africa
9 Micro Electric Vehicles Market Production by Region
9.1 Global Production of Micro Electric Vehicles by Region (2019-2025)
9.2 Global Micro Electric Vehicles Revenue Market Share by Region (2019-2025)
9.3 Global Micro Electric Vehicles Production, Revenue, Price and Gross Margin (2019-2025)
9.4 North America Micro Electric Vehicles Production
9.4.1 North America Micro Electric Vehicles Production Growth Rate (2019-2025)
9.4.2 North America Micro Electric Vehicles Production, Revenue, Price and Gross Margin (2019-2025)
9.5 Europe Micro Electric Vehicles Production
9.5.1 Europe Micro Electric Vehicles Production Growth Rate (2019-2025)
9.5.2 Europe Micro Electric Vehicles Production, Revenue, Price and Gross Margin (2019-2025)
9.6 Japan Micro Electric Vehicles Production (2019-2025)
9.6.1 Japan Micro Electric Vehicles Production Growth Rate (2019-2025)
9.6.2 Japan Micro Electric Vehicles Production, Revenue, Price and Gross Margin (2019-2025)
9.7 China Micro Electric Vehicles Production (2019-2025)
9.7.1 China Micro Electric Vehicles Production Growth Rate (2019-2025)
9.7.2 China Micro Electric Vehicles Production, Revenue, Price and Gross Margin (2019-2025)
10 Key Companies Profile
10.1 Tesla
10.1.1 Tesla Micro Electric Vehicles Basic Information
10.1.2 Tesla Micro Electric Vehicles Product Overview
10.1.3 Tesla Micro Electric Vehicles Product Market Performance
10.1.4 Tesla Business Overview
10.1.5 Tesla Micro Electric Vehicles SWOT Analysis
10.1.6 Tesla Recent Developments
10.2 Renault
10.2.1 Renault Micro Electric Vehicles Basic Information
10.2.2 Renault Micro Electric Vehicles Product Overview
10.2.3 Renault Micro Electric Vehicles Product Market Performance
10.2.4 Renault Business Overview
10.2.5 Renault Micro Electric Vehicles SWOT Analysis
10.2.6 Renault Recent Developments
10.3 Toyota
10.3.1 Toyota Micro Electric Vehicles Basic Information
10.3.2 Toyota Micro Electric Vehicles Product Overview
10.3.3 Toyota Micro Electric Vehicles Product Market Performance
10.3.4 Toyota Micro Electric Vehicles SWOT Analysis
10.3.5 Toyota Business Overview
10.3.6 Toyota Recent Developments
10.4 BMW
10.4.1 BMW Micro Electric Vehicles Basic Information
10.4.2 BMW Micro Electric Vehicles Product Overview
10.4.3 BMW Micro Electric Vehicles Product Market Performance
10.4.4 BMW Business Overview
10.4.5 BMW Recent Developments
10.5 Audi
10.5.1 Audi Micro Electric Vehicles Basic Information
10.5.2 Audi Micro Electric Vehicles Product Overview
10.5.3 Audi Micro Electric Vehicles Product Market Performance
10.5.4 Audi Business Overview
10.5.5 Audi Recent Developments
10.6 BYD
10.6.1 BYD Micro Electric Vehicles Basic Information
10.6.2 BYD Micro Electric Vehicles Product Overview
10.6.3 BYD Micro Electric Vehicles Product Market Performance
10.6.4 BYD Business Overview
10.6.5 BYD Recent Developments
10.7 Ford
10.7.1 Ford Micro Electric Vehicles Basic Information
10.7.2 Ford Micro Electric Vehicles Product Overview
10.7.3 Ford Micro Electric Vehicles Product Market Performance
10.7.4 Ford Business Overview
10.7.5 Ford Recent Developments
10.8 Honda
10.8.1 Honda Micro Electric Vehicles Basic Information
10.8.2 Honda Micro Electric Vehicles Product Overview
10.8.3 Honda Micro Electric Vehicles Product Market Performance
10.8.4 Honda Business Overview
10.8.5 Honda Recent Developments
10.9 Alta
10.9.1 Alta Micro Electric Vehicles Basic Information
10.9.2 Alta Micro Electric Vehicles Product Overview
10.9.3 Alta Micro Electric Vehicles Product Market Performance
10.9.4 Alta Business Overview
10.9.5 Alta Recent Developments
10.10 E-Rex
10.10.1 E-Rex Micro Electric Vehicles Basic Information
10.10.2 E-Rex Micro Electric Vehicles Product Overview
10.10.3 E-Rex Micro Electric Vehicles Product Market Performance
10.10.4 E-Rex Business Overview
10.10.5 E-Rex Recent Developments
10.11 Jinhua
10.11.1 Jinhua Micro Electric Vehicles Basic Information
10.11.2 Jinhua Micro Electric Vehicles Product Overview
10.11.3 Jinhua Micro Electric Vehicles Product Market Performance
10.11.4 Jinhua Business Overview
10.11.5 Jinhua Recent Developments
10.12 Sanyo system
10.12.1 Sanyo system Micro Electric Vehicles Basic Information
10.12.2 Sanyo system Micro Electric Vehicles Product Overview
10.12.3 Sanyo system Micro Electric Vehicles Product Market Performance
10.12.4 Sanyo system Business Overview
10.12.5 Sanyo system Recent Developments
11 Micro Electric Vehicles Market Forecast by Region
11.1 Global Micro Electric Vehicles Market Size Forecast
11.2 Global Micro Electric Vehicles Market Forecast by Region
11.2.1 North America Market Size Forecast by Country
11.2.2 Europe Micro Electric Vehicles Market Size Forecast by Country
11.2.3 Asia Pacific Micro Electric Vehicles Market Size Forecast by Region
11.2.4 South America Micro Electric Vehicles Market Size Forecast by Country
11.2.5 Middle East and Africa Forecasted Consumption of Micro Electric Vehicles by Country
12 Forecast Market by Type and by Application (2025-2032)
12.1 Global Micro Electric Vehicles Market Forecast by Type (2025-2032)
12.1.1 Global Forecasted Sales of Micro Electric Vehicles by Type (2025-2032)
12.1.2 Global Micro Electric Vehicles Market Size Forecast by Type (2025-2032)
12.1.3 Global Forecasted Price of Micro Electric Vehicles by Type (2025-2032)
12.2 Global Micro Electric Vehicles Market Forecast by Application (2025-2032)
12.2.1 Global Micro Electric Vehicles Sales (K Units) Forecast by Application
12.2.2 Global Micro Electric Vehicles Market Size (M USD) Forecast by Application (2025-2032)
13 Conclusion and Key Findings
LIST OF TABLES & FIGURES
List of Tables
Table 1. Introduction of the Type
Table 2. Introduction of the Application
Table 3. Motor Vehicle Production Market Share by Type (2023)
Table 4. Global Automobile Production by Region (Units)
Table 5. Market Share and Development Potential of Automobiles by Region
Table 6. Global Automobile Production by Country (Vehicle)
Table 7. Market Share and Development Potential of Automobiles by Countries
Table 8. Global Automobile Production by Type
Table 9. Market Share and Development Potential of Automobiles by Type
Table 10. Market Size (M USD) Segment Executive Summary
Table 11. Micro Electric Vehicles Market Size Comparison by Region (M USD)
Table 12. Global Micro Electric Vehicles Sales (K Units) by Manufacturers (2019-2025)
Table 13. Global Micro Electric Vehicles Sales Market Share by Manufacturers (2019-2025)
Table 14. Global Micro Electric Vehicles Revenue (M USD) by Manufacturers (2019-2025)
Table 15. Global Micro Electric Vehicles Revenue Share by Manufacturers (2019-2025)
Table 16. Company Type (Tier 1, Tier 2, and Tier 3) & (based on the Revenue in Micro Electric Vehicles as of 2022)
Table 17. Global Market Micro Electric Vehicles Average Price (USD/Unit) of Key Manufacturers (2019-2025)
Table 18. Manufacturers Micro Electric Vehicles Sales Sites and Area Served
Table 19. Manufacturers Micro Electric Vehicles Product Type
Table 20. Global Micro Electric Vehicles Manufacturers Market Concentration Ratio (CR5 and HHI)
Table 21. Mergers & Acquisitions, Expansion Plans
Table 22. Industry Chain Map of Micro Electric Vehicles
Table 23. Market Overview of Key Raw Materials
Table 24. Midstream Market Analysis
Table 25. Downstream Customer Analysis
Table 26. Key Development Trends
Table 27. Driving Factors
Table 28. Micro Electric Vehicles Market Challenges
Table 29. Global Micro Electric Vehicles Sales by Type (K Units)
Table 30. Global Micro Electric Vehicles Market Size by Type (M USD)
Table 31. Global Micro Electric Vehicles Sales (K Units) by Type (2019-2025)
Table 32. Global Micro Electric Vehicles Sales Market Share by Type (2019-2025)
Table 33. Global Micro Electric Vehicles Market Size (M USD) by Type (2019-2025)
Table 34. Global Micro Electric Vehicles Market Size Share by Type (2019-2025)
Table 35. Global Micro Electric Vehicles Price (USD/Unit) by Type (2019-2025)
Table 36. Global Micro Electric Vehicles Sales (K Units) by Application
Table 37. Global Micro Electric Vehicles Market Size by Application
Table 38. Global Micro Electric Vehicles Sales by Application (2019-2025) & (K Units)
Table 39. Global Micro Electric Vehicles Sales Market Share by Application (2019-2025)
Table 40. Global Micro Electric Vehicles Sales by Application (2019-2025) & (M USD)
Table 41. Global Micro Electric Vehicles Market Share by Application (2019-2025)
Table 42. Global Micro Electric Vehicles Sales Growth Rate by Application (2019-2025)
Table 43. Global Micro Electric Vehicles Sales by Region (2019-2025) & (K Units)
Table 44. Global Micro Electric Vehicles Sales Market Share by Region (2019-2025)
Table 45. North America Micro Electric Vehicles Sales by Country (2019-2025) & (K Units)
Table 46. Europe Micro Electric Vehicles Sales by Country (2019-2025) & (K Units)
Table 47. Asia Pacific Micro Electric Vehicles Sales by Region (2019-2025) & (K Units)
Table 48. South America Micro Electric Vehicles Sales by Country (2019-2025) & (K Units)
Table 49. Middle East and Africa Micro Electric Vehicles Sales by Region (2019-2025) & (K Units)
Table 50. Global Micro Electric Vehicles Production (K Units) by Region (2019-2025)
Table 51. Global Micro Electric Vehicles Revenue (US$ Million) by Region (2019-2025)
Table 52. Global Micro Electric Vehicles Revenue Market Share by Region (2019-2025)
Table 53. Global Micro Electric Vehicles Production (K Units), Revenue (US$ Million), Price (USD/Unit) and Gross Margin (2019-2025)
Table 54. North America Micro Electric Vehicles Production (K Units), Revenue (US$ Million), Price (USD/Unit) and Gross Margin (2019-2025)
Table 55. Europe Micro Electric Vehicles Production (K Units), Revenue (US$ Million), Price (USD/Unit) and Gross Margin (2019-2025)
Table 56. Japan Micro Electric Vehicles Production (K Units), Revenue (US$ Million), Price (USD/Unit) and Gross Margin (2019-2025)
Table 57. China Micro Electric Vehicles Production (K Units), Revenue (US$ Million), Price (USD/Unit) and Gross Margin (2019-2025)
Table 58. Tesla Micro Electric Vehicles Basic Information
Table 59. Tesla Micro Electric Vehicles Product Overview
Table 60. Tesla Micro Electric Vehicles Sales (K Units), Revenue (M USD), Price (USD/Unit) and Gross Margin (2019-2025)
Table 61. Tesla Business Overview
Table 62. Tesla Micro Electric Vehicles SWOT Analysis
Table 63. Tesla Recent Developments
Table 64. Renault Micro Electric Vehicles Basic Information
Table 65. Renault Micro Electric Vehicles Product Overview
Table 66. Renault Micro Electric Vehicles Sales (K Units), Revenue (M USD), Price (USD/Unit) and Gross Margin (2019-2025)
Table 67. Renault Business Overview
Table 68. Renault Micro Electric Vehicles SWOT Analysis
Table 69. Renault Recent Developments
Table 70. Toyota Micro Electric Vehicles Basic Information
Table 71. Toyota Micro Electric Vehicles Product Overview
Table 72. Toyota Micro Electric Vehicles Sales (K Units), Revenue (M USD), Price (USD/Unit) and Gross Margin (2019-2025)
Table 73. Toyota Micro Electric Vehicles SWOT Analysis
Table 74. Toyota Business Overview
Table 75. Toyota Recent Developments
Table 76. BMW Micro Electric Vehicles Basic Information
Table 77. BMW Micro Electric Vehicles Product Overview
Table 78. BMW Micro Electric Vehicles Sales (K Units), Revenue (M USD), Price (USD/Unit) and Gross Margin (2019-2025)
Table 79. BMW Business Overview
Table 80. BMW Recent Developments
Table 81. Audi Micro Electric Vehicles Basic Information
Table 82. Audi Micro Electric Vehicles Product Overview
Table 83. Audi Micro Electric Vehicles Sales (K Units), Revenue (M USD), Price (USD/Unit) and Gross Margin (2019-2025)
Table 84. Audi Business Overview
Table 85. Audi Recent Developments
Table 86. BYD Micro Electric Vehicles Basic Information
Table 87. BYD Micro Electric Vehicles Product Overview
Table 88. BYD Micro Electric Vehicles Sales (K Units), Revenue (M USD), Price (USD/Unit) and Gross Margin (2019-2025)
Table 89. BYD Business Overview
Table 90. BYD Recent Developments
Table 91. Ford Micro Electric Vehicles Basic Information
Table 92. Ford Micro Electric Vehicles Product Overview
Table 93. Ford Micro Electric Vehicles Sales (K Units), Revenue (M USD), Price (USD/Unit) and Gross Margin (2019-2025)
Table 94. Ford Business Overview
Table 95. Ford Recent Developments
Table 96. Honda Micro Electric Vehicles Basic Information
Table 97. Honda Micro Electric Vehicles Product Overview
Table 98. Honda Micro Electric Vehicles Sales (K Units), Revenue (M USD), Price (USD/Unit) and Gross Margin (2019-2025)
Table 99. Honda Business Overview
Table 100. Honda Recent Developments
Table 101. Alta Micro Electric Vehicles Basic Information
Table 102. Alta Micro Electric Vehicles Product Overview
Table 103. Alta Micro Electric Vehicles Sales (K Units), Revenue (M USD), Price (USD/Unit) and Gross Margin (2019-2025)
Table 104. Alta Business Overview
Table 105. Alta Recent Developments
Table 106. E-Rex Micro Electric Vehicles Basic Information
Table 107. E-Rex Micro Electric Vehicles Product Overview
Table 108. E-Rex Micro Electric Vehicles Sales (K Units), Revenue (M USD), Price (USD/Unit) and Gross Margin (2019-2025)
Table 109. E-Rex Business Overview
Table 110. E-Rex Recent Developments
Table 111. Jinhua Micro Electric Vehicles Basic Information
Table 112. Jinhua Micro Electric Vehicles Product Overview
Table 113. Jinhua Micro Electric Vehicles Sales (K Units), Revenue (M USD), Price (USD/Unit) and Gross Margin (2019-2025)
Table 114. Jinhua Business Overview
Table 115. Jinhua Recent Developments
Table 116. Sanyo system Micro Electric Vehicles Basic Information
Table 117. Sanyo system Micro Electric Vehicles Product Overview
Table 118. Sanyo system Micro Electric Vehicles Sales (K Units), Revenue (M USD), Price (USD/Unit) and Gross Margin (2019-2025)
Table 119. Sanyo system Business Overview
Table 120. Sanyo system Recent Developments
Table 121. Global Micro Electric Vehicles Sales Forecast by Region (2025-2032) & (K Units)
Table 122. Global Micro Electric Vehicles Market Size Forecast by Region (2025-2032) & (M USD)
Table 123. North America Micro Electric Vehicles Sales Forecast by Country (2025-2032) & (K Units)
Table 124. North America Micro Electric Vehicles Market Size Forecast by Country (2025-2032) & (M USD)
Table 125. Europe Micro Electric Vehicles Sales Forecast by Country (2025-2032) & (K Units)
Table 126. Europe Micro Electric Vehicles Market Size Forecast by Country (2025-2032) & (M USD)
Table 127. Asia Pacific Micro Electric Vehicles Sales Forecast by Region (2025-2032) & (K Units)
Table 128. Asia Pacific Micro Electric Vehicles Market Size Forecast by Region (2025-2032) & (M USD)
Table 129. South America Micro Electric Vehicles Sales Forecast by Country (2025-2032) & (K Units)
Table 130. South America Micro Electric Vehicles Market Size Forecast by Country (2025-2032) & (M USD)
Table 131. Middle East and Africa Micro Electric Vehicles Consumption Forecast by Country (2025-2032) & (Units)
Table 132. Middle East and Africa Micro Electric Vehicles Market Size Forecast by Country (2025-2032) & (M USD)
Table 133. Global Micro Electric Vehicles Sales Forecast by Type (2025-2032) & (K Units)
Table 134. Global Micro Electric Vehicles Market Size Forecast by Type (2025-2032) & (M USD)
Table 135. Global Micro Electric Vehicles Price Forecast by Type (2025-2032) & (USD/Unit)
Table 136. Global Micro Electric Vehicles Sales (K Units) Forecast by Application (2025-2032)
Table 137. Global Micro Electric Vehicles Market Size Forecast by Application (2025-2032) & (M USD)
List of Figures
Figure 1. Product Picture of Micro Electric Vehicles
Figure 2. Data Triangulation
Figure 3. Key Caveats
Figure 4. Global Motor Vehicle Production (M Units)
Figure 5. Global Micro Electric Vehicles Market Size (M USD), 2019-2032
Figure 6. Global Micro Electric Vehicles Market Size (M USD) (2019-2032)
Figure 7. Global Micro Electric Vehicles Sales (K Units) & (2019-2032)
Figure 8. Evaluation Matrix of Segment Market Development Potential (Type)
Figure 9. Evaluation Matrix of Segment Market Development Potential (Application)
Figure 10. Evaluation Matrix of Regional Market Development Potential
Figure 11. Micro Electric Vehicles Market Size by Country (M USD)
Figure 12. Micro Electric Vehicles Sales Share by Manufacturers in 2023
Figure 13. Global Micro Electric Vehicles Revenue Share by Manufacturers in 2023
Figure 14. Micro Electric Vehicles Market Share by Company Type (Tier 1, Tier 2 and Tier 3): 2023
Figure 15. Global Market Micro Electric Vehicles Average Price (USD/Unit) of Key Manufacturers in 2023
Figure 16. The Global 5 and 10 Largest Players: Market Share by Micro Electric Vehicles Revenue in 2023
Figure 17. Evaluation Matrix of Segment Market Development Potential (Type)
Figure 18. Global Micro Electric Vehicles Market Share by Type
Figure 19. Sales Market Share of Micro Electric Vehicles by Type (2019-2025)
Figure 20. Sales Market Share of Micro Electric Vehicles by Type in 2023
Figure 21. Market Size Share of Micro Electric Vehicles by Type (2019-2025)
Figure 22. Market Size Market Share of Micro Electric Vehicles by Type in 2023
Figure 23. Evaluation Matrix of Segment Market Development Potential (Application)
Figure 24. Global Micro Electric Vehicles Market Share by Application
Figure 25. Global Micro Electric Vehicles Sales Market Share by Application (2019-2025)
Figure 26. Global Micro Electric Vehicles Sales Market Share by Application in 2023
Figure 27. Global Micro Electric Vehicles Market Share by Application (2019-2025)
Figure 28. Global Micro Electric Vehicles Market Share by Application in 2023
Figure 29. Global Micro Electric Vehicles Sales Growth Rate by Application (2019-2025)
Figure 30. Global Micro Electric Vehicles Sales Market Share by Region (2019-2025)
Figure 31. North America Micro Electric Vehicles Sales and Growth Rate (2019-2025) & (K Units)
Figure 32. North America Micro Electric Vehicles Sales Market Share by Country in 2023
Figure 33. U.S. Micro Electric Vehicles Sales and Growth Rate (2019-2025) & (K Units)
Figure 34. Canada Micro Electric Vehicles Sales (K Units) and Growth Rate (2019-2025)
Figure 35. Mexico Micro Electric Vehicles Sales (Units) and Growth Rate (2019-2025)
Figure 36. Europe Micro Electric Vehicles Sales and Growth Rate (2019-2025) & (K Units)
Figure 37. Europe Micro Electric Vehicles Sales Market Share by Country in 2023
Figure 38. Germany Micro Electric Vehicles Sales and Growth Rate (2019-2025) & (K Units)
Figure 39. France Micro Electric Vehicles Sales and Growth Rate (2019-2025) & (K Units)
Figure 40. U.K. Micro Electric Vehicles Sales and Growth Rate (2019-2025) & (K Units)
Figure 41. Italy Micro Electric Vehicles Sales and Growth Rate (2019-2025) & (K Units)
Figure 42. Russia Micro Electric Vehicles Sales and Growth Rate (2019-2025) & (K Units)
Figure 43. Asia Pacific Micro Electric Vehicles Sales and Growth Rate (K Units)
Figure 44. Asia Pacific Micro Electric Vehicles Sales Market Share by Region in 2023
Figure 45. China Micro Electric Vehicles Sales and Growth Rate (2019-2025) & (K Units)
Figure 46. Japan Micro Electric Vehicles Sales and Growth Rate (2019-2025) & (K Units)
Figure 47. South Korea Micro Electric Vehicles Sales and Growth Rate (2019-2025) & (K Units)
Figure 48. India Micro Electric Vehicles Sales and Growth Rate (2019-2025) & (K Units)
Figure 49. Southeast Asia Micro Electric Vehicles Sales and Growth Rate (2019-2025) & (K Units)
Figure 50. South America Micro Electric Vehicles Sales and Growth Rate (K Units)
Figure 51. South America Micro Electric Vehicles Sales Market Share by Country in 2023
Figure 52. Brazil Micro Electric Vehicles Sales and Growth Rate (2019-2025) & (K Units)
Figure 53. Argentina Micro Electric Vehicles Sales and Growth Rate (2019-2025) & (K Units)
Figure 54. Columbia Micro Electric Vehicles Sales and Growth Rate (2019-2025) & (K Units)
Figure 55. Middle East and Africa Micro Electric Vehicles Sales and Growth Rate (K Units)
Figure 56. Middle East and Africa Micro Electric Vehicles Sales Market Share by Region in 2023
Figure 57. Saudi Arabia Micro Electric Vehicles Sales and Growth Rate (2019-2025) & (K Units)
Figure 58. UAE Micro Electric Vehicles Sales and Growth Rate (2019-2025) & (K Units)
Figure 59. Egypt Micro Electric Vehicles Sales and Growth Rate (2019-2025) & (K Units)
Figure 60. Nigeria Micro Electric Vehicles Sales and Growth Rate (2019-2025) & (K Units)
Figure 61. South Africa Micro Electric Vehicles Sales and Growth Rate (2019-2025) & (K Units)
Figure 62. Global Micro Electric Vehicles Production Market Share by Region (2019-2025)
Figure 63. North America Micro Electric Vehicles Production (K Units) Growth Rate (2019-2025)
Figure 64. Europe Micro Electric Vehicles Production (K Units) Growth Rate (2019-2025)
Figure 65. Japan Micro Electric Vehicles Production (K Units) Growth Rate (2019-2025)
Figure 66. China Micro Electric Vehicles Production (K Units) Growth Rate (2019-2025)
Figure 67. Global Micro Electric Vehicles Sales Forecast by Volume (2019-2032) & (K Units)
Figure 68. Global Micro Electric Vehicles Market Size Forecast by Value (2019-2032) & (M USD)
Figure 69. Global Micro Electric Vehicles Sales Market Share Forecast by Type (2025-2032)
Figure 70. Global Micro Electric Vehicles Market Share Forecast by Type (2025-2032)
Figure 71. Global Micro Electric Vehicles Sales Forecast by Application (2025-2032)
Figure 72. Global Micro Electric Vehicles Market Share Forecast by Application (2025-2032)

