MicroRNA sequencing (miRNA-seq) is a specialized form of RNA sequencing (RNA-seq) that employs next-generation sequencing (NGS) technology to analyze microRNAs (miRNAs). These short, non-coding RNA molecules play crucial roles in gene regulation. Unlike conventional RNA-seq, miRNA-seq is optimized to enrich small RNA fragments, enabling researchers to study miRNA expression patterns, discover novel miRNAs, and analyze disease-related miRNA dysregulation. Given its significance in disease diagnostics, particularly in oncology, miRNA-seq is increasingly becoming an essential tool in molecular research and clinical applications.
Market Size
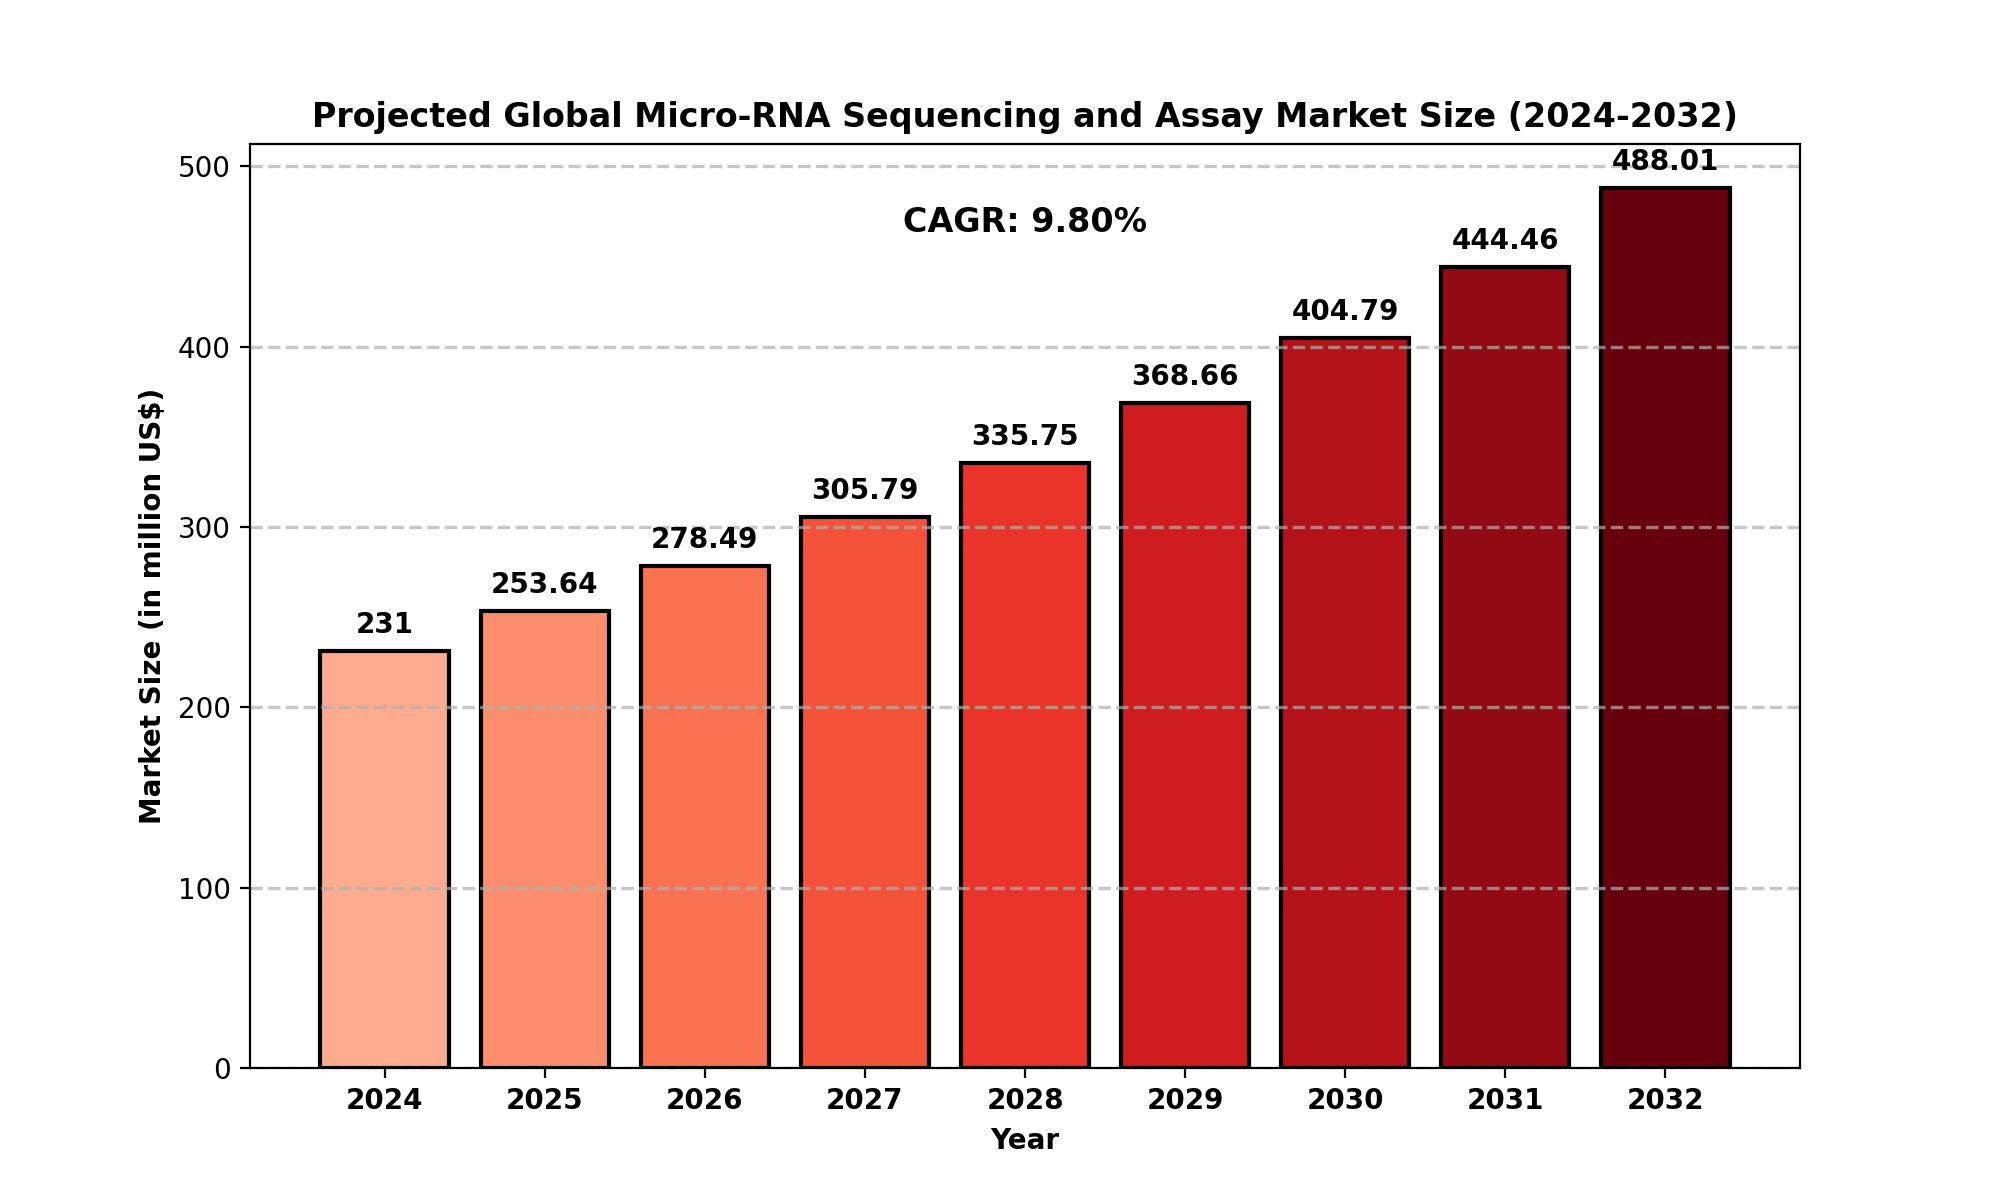
The global Micro-RNA Sequencing and Assay market is valued at approximately USD 231 million in 2024 . With a projected Compound Annual Growth Rate (CAGR) of 9.80%, the market is expected to reach USD 488.01 million by 2032.
The North American market, estimated at USD 70.73 million in 2024, is set to grow at a CAGR of 8.40% during the same period.
This steady expansion is attributed to the rising adoption of NGS technologies, increased funding for genomic research, and growing interest in miRNA’s role in personalized medicine and disease prognosis.
Market Dynamics (Drivers, Restraints, Opportunities, and Challenges)
Drivers
-
Advancements in Next-Generation Sequencing: Continuous improvements in sequencing technology have reduced costs and improved efficiency, fueling the adoption of miRNA-seq.
-
Growing Prevalence of Cancer and Chronic Diseases: With miRNAs playing a critical role in cancer diagnostics and treatment, demand for miRNA-seq is increasing.
-
Government Funding and Research Initiatives: Investments in genomics and precision medicine are accelerating market growth.
-
Rising Demand for Personalized Medicine: The shift toward tailored treatments based on genetic profiling is boosting miRNA sequencing applications.
Restraints
-
High Costs and Infrastructure Requirements: Despite declining costs, sequencing remains expensive, limiting adoption in smaller research institutions.
-
Data Complexity and Standardization Issues: Analyzing and interpreting miRNA-seq data requires sophisticated bioinformatics tools, posing a challenge for many users.
Opportunities
-
Integration with Artificial Intelligence (AI) and Machine Learning: AI-driven bioinformatics can enhance miRNA-seq analysis and expand its clinical utility.
-
Emerging Markets in Asia-Pacific: Rapid advancements in healthcare infrastructure and genomics research in countries like China and India present growth potential.
-
Expanding Applications in Neurological Disorders: Research into miRNA’s role in neurodegenerative diseases is opening new avenues for miRNA sequencing.
Challenges
-
Regulatory and Ethical Concerns: Compliance with stringent regulatory frameworks remains a barrier to widespread adoption.
-
Limited Awareness in Emerging Markets: Lack of expertise and awareness about miRNA-seq in developing regions can hinder market growth.
Regional Analysis
North America
-
Dominates the market due to advanced healthcare infrastructure, strong funding, and high adoption of NGS technologies.
-
The U.S. leads in miRNA-seq research, driven by major biotech companies and academic institutions.
Europe
-
Increasing government support for genomic research and precision medicine is driving growth.
-
Countries like Germany and the UK are key contributors due to strong healthcare policies and research funding.
Asia-Pacific
-
Fastest-growing region, fueled by technological advancements, increasing healthcare expenditure, and rising genomic research initiatives in China, Japan, and India.
South America & MEA
Competitor Analysis
The market is dominated by major biotechnology and life sciences companies, each offering advanced sequencing technologies:
-
Illumina: Leading provider of NGS platforms with strong market presence.
-
Thermo Fisher Scientific: Offers a comprehensive portfolio of sequencing and assay solutions.
-
QIAGEN: Specializes in miRNA research tools and sequencing solutions.
-
Takara Bio: Provides innovative sequencing technologies for small RNA analysis.
-
NEB (New England Biolabs): Focuses on high-quality reagents and sequencing kits.
Market Segmentation (by Type)
-
Sequencing by Synthesis (SBS): Most widely used technology, known for its high accuracy.
-
Sequencing by Nanopore: Emerging method offering long-read sequencing capabilities.
-
Ion Semiconductor Sequencing: Cost-effective alternative, suitable for targeted miRNA analysis.
Market Segmentation (by Application)
-
Research Institutes: Largest end-user segment, driving demand for advanced sequencing technologies.
-
Academia: Increasing use in university research programs and genomic studies.
-
Contract Research Organizations (CROs): Growing role in outsourced sequencing services and drug discovery.
Geographic Segmentation
-
North America (USA, Canada, Mexico)
-
Europe (Germany, UK, France, Russia, Italy, Rest of Europe)
-
Asia-Pacific (China, Japan, South Korea, India, Southeast Asia, Rest of Asia-Pacific)
-
South America (Brazil, Argentina, Columbia, Rest of South America)
-
Middle East and Africa (MEA) (Saudi Arabia, UAE, Egypt, Nigeria, South Africa, Rest of MEA)
FAQ Section
What is the current market size of the Micro-RNA Sequencing and Assay market?
- As of 2024, the market is valued at USD 231 million, with an expected growth to USD 535.84 million by 2032.
Which are the key companies operating in this market?
- Leading companies include Illumina, Thermo Fisher Scientific, QIAGEN, Takara Bio, and NEB.
What are the key growth drivers in this market?
- Key drivers include advancements in NGS technology, rising demand for personalized medicine, and increasing research funding.
Which regions dominate the Micro-RNA Sequencing and Assay market?
- North America holds the largest market share, followed by Europe and the rapidly growing Asia-Pacific region.
What are the emerging trends in this market?
- Notable trends include AI integration in sequencing analysis, expanding applications in neurology, and growth in emerging markets.
Key Benefits of This Market Research:
- Industry drivers, restraints, and opportunities covered in the study
- Neutral perspective on the market performance
- Recent industry trends and developments
- Competitive landscape & strategies of key players
- Potential & niche segments and regions exhibiting promising growth covered
- Historical, current, and projected market size, in terms of value
- In-depth analysis of the Micro-RNA Sequencing and Assay Market
- Overview of the regional outlook of the Micro-RNA Sequencing and Assay Market:
Key Reasons to Buy this Report:
- Access to date statistics compiled by our researchers. These provide you with historical and forecast data, which is analyzed to tell you why your market is set to change
- This enables you to anticipate market changes to remain ahead of your competitors
- You will be able to copy data from the Excel spreadsheet straight into your marketing plans, business presentations, or other strategic documents
- The concise analysis, clear graph, and table format will enable you to pinpoint the information you require quickly
- Provision of market value data for each segment and sub-segment
- Indicates the region and segment that is expected to witness the fastest growth as well as to dominate the market
- Analysis by geography highlighting the consumption of the product/service in the region as well as indicating the factors that are affecting the market within each region
- Competitive landscape which incorporates the market ranking of the major players, along with new service/product launches, partnerships, business expansions, and acquisitions in the past five years of companies profiled
- Extensive company profiles comprising of company overview, company insights, product benchmarking, and SWOT analysis for the major market players
- The current as well as the future market outlook of the industry concerning recent developments which involve growth opportunities and drivers as well as challenges and restraints of both emerging as well as developed regions
- Includes in-depth analysis of the market from various perspectives through Porter
TABLE OF CONTENTS
Table of Contents
1 Research Methodology and Statistical Scope
1.1 Market Definition and Statistical Scope of Micro-RNA Sequencing and Assay
1.2 Key Market Segments
1.2.1 Micro-RNA Sequencing and Assay Segment by Type
1.2.2 Micro-RNA Sequencing and Assay Segment by Application
1.3 Methodology & Sources of Information
1.3.1 Research Methodology
1.3.2 Research Process
1.3.3 Market Breakdown and Data Triangulation
1.3.4 Base Year
1.3.5 Report Assumptions & Caveats
2 Micro-RNA Sequencing and Assay Market Overview
2.1 Global Market Overview
2.1.1 Global Micro-RNA Sequencing and Assay Market Size (M USD) Estimates and Forecasts (2019-2032)
2.1.2 Global Micro-RNA Sequencing and Assay Sales Estimates and Forecasts (2019-2032)
2.2 Market Segment Executive Summary
2.3 Global Market Size by Region
3 Micro-RNA Sequencing and Assay Market Competitive Landscape
3.1 Global Micro-RNA Sequencing and Assay Sales by Manufacturers (2019-2025)
3.2 Global Micro-RNA Sequencing and Assay Revenue Market Share by Manufacturers (2019-2025)
3.3 Micro-RNA Sequencing and Assay Market Share by Company Type (Tier 1, Tier 2, and Tier 3)
3.4 Global Micro-RNA Sequencing and Assay Average Price by Manufacturers (2019-2025)
3.5 Manufacturers Micro-RNA Sequencing and Assay Sales Sites, Area Served, Product Type
3.6 Micro-RNA Sequencing and Assay Market Competitive Situation and Trends
3.6.1 Micro-RNA Sequencing and Assay Market Concentration Rate
3.6.2 Global 5 and 10 Largest Micro-RNA Sequencing and Assay Players Market Share by Revenue
3.6.3 Mergers & Acquisitions, Expansion
4 Micro-RNA Sequencing and Assay Industry Chain Analysis
4.1 Micro-RNA Sequencing and Assay Industry Chain Analysis
4.2 Market Overview of Key Raw Materials
4.3 Midstream Market Analysis
4.4 Downstream Customer Analysis
5 The Development and Dynamics of Micro-RNA Sequencing and Assay Market
5.1 Key Development Trends
5.2 Driving Factors
5.3 Market Challenges
5.4 Market Restraints
5.5 Industry News
5.5.1 New Product Developments
5.5.2 Mergers & Acquisitions
5.5.3 Expansions
5.5.4 Collaboration/Supply Contracts
5.6 Industry Policies
6 Micro-RNA Sequencing and Assay Market Segmentation by Type
6.1 Evaluation Matrix of Segment Market Development Potential (Type)
6.2 Global Micro-RNA Sequencing and Assay Sales Market Share by Type (2019-2025)
6.3 Global Micro-RNA Sequencing and Assay Market Size Market Share by Type (2019-2025)
6.4 Global Micro-RNA Sequencing and Assay Price by Type (2019-2025)
7 Micro-RNA Sequencing and Assay Market Segmentation by Application
7.1 Evaluation Matrix of Segment Market Development Potential (Application)
7.2 Global Micro-RNA Sequencing and Assay Market Sales by Application (2019-2025)
7.3 Global Micro-RNA Sequencing and Assay Market Size (M USD) by Application (2019-2025)
7.4 Global Micro-RNA Sequencing and Assay Sales Growth Rate by Application (2019-2025)
8 Micro-RNA Sequencing and Assay Market Consumption by Region
8.1 Global Micro-RNA Sequencing and Assay Sales by Region
8.1.1 Global Micro-RNA Sequencing and Assay Sales by Region
8.1.2 Global Micro-RNA Sequencing and Assay Sales Market Share by Region
8.2 North America
8.2.1 North America Micro-RNA Sequencing and Assay Sales by Country
8.2.2 U.S.
8.2.3 Canada
8.2.4 Mexico
8.3 Europe
8.3.1 Europe Micro-RNA Sequencing and Assay Sales by Country
8.3.2 Germany
8.3.3 France
8.3.4 U.K.
8.3.5 Italy
8.3.6 Russia
8.4 Asia Pacific
8.4.1 Asia Pacific Micro-RNA Sequencing and Assay Sales by Region
8.4.2 China
8.4.3 Japan
8.4.4 South Korea
8.4.5 India
8.4.6 Southeast Asia
8.5 South America
8.5.1 South America Micro-RNA Sequencing and Assay Sales by Country
8.5.2 Brazil
8.5.3 Argentina
8.5.4 Columbia
8.6 Middle East and Africa
8.6.1 Middle East and Africa Micro-RNA Sequencing and Assay Sales by Region
8.6.2 Saudi Arabia
8.6.3 UAE
8.6.4 Egypt
8.6.5 Nigeria
8.6.6 South Africa
9 Micro-RNA Sequencing and Assay Market Production by Region
9.1 Global Production of Micro-RNA Sequencing and Assay by Region (2019-2025)
9.2 Global Micro-RNA Sequencing and Assay Revenue Market Share by Region (2019-2025)
9.3 Global Micro-RNA Sequencing and Assay Production, Revenue, Price and Gross Margin (2019-2025)
9.4 North America Micro-RNA Sequencing and Assay Production
9.4.1 North America Micro-RNA Sequencing and Assay Production Growth Rate (2019-2025)
9.4.2 North America Micro-RNA Sequencing and Assay Production, Revenue, Price and Gross Margin (2019-2025)
9.5 Europe Micro-RNA Sequencing and Assay Production
9.5.1 Europe Micro-RNA Sequencing and Assay Production Growth Rate (2019-2025)
9.5.2 Europe Micro-RNA Sequencing and Assay Production, Revenue, Price and Gross Margin (2019-2025)
9.6 Japan Micro-RNA Sequencing and Assay Production (2019-2025)
9.6.1 Japan Micro-RNA Sequencing and Assay Production Growth Rate (2019-2025)
9.6.2 Japan Micro-RNA Sequencing and Assay Production, Revenue, Price and Gross Margin (2019-2025)
9.7 China Micro-RNA Sequencing and Assay Production (2019-2025)
9.7.1 China Micro-RNA Sequencing and Assay Production Growth Rate (2019-2025)
9.7.2 China Micro-RNA Sequencing and Assay Production, Revenue, Price and Gross Margin (2019-2025)
10 Key Companies Profile
10.1 Illumina
10.1.1 Illumina Micro-RNA Sequencing and Assay Basic Information
10.1.2 Illumina Micro-RNA Sequencing and Assay Product Overview
10.1.3 Illumina Micro-RNA Sequencing and Assay Product Market Performance
10.1.4 Illumina Business Overview
10.1.5 Illumina Micro-RNA Sequencing and Assay SWOT Analysis
10.1.6 Illumina Recent Developments
10.2 Thermo Fisher Scientific
10.2.1 Thermo Fisher Scientific Micro-RNA Sequencing and Assay Basic Information
10.2.2 Thermo Fisher Scientific Micro-RNA Sequencing and Assay Product Overview
10.2.3 Thermo Fisher Scientific Micro-RNA Sequencing and Assay Product Market Performance
10.2.4 Thermo Fisher Scientific Business Overview
10.2.5 Thermo Fisher Scientific Micro-RNA Sequencing and Assay SWOT Analysis
10.2.6 Thermo Fisher Scientific Recent Developments
10.3 QIAGEN
10.3.1 QIAGEN Micro-RNA Sequencing and Assay Basic Information
10.3.2 QIAGEN Micro-RNA Sequencing and Assay Product Overview
10.3.3 QIAGEN Micro-RNA Sequencing and Assay Product Market Performance
10.3.4 QIAGEN Micro-RNA Sequencing and Assay SWOT Analysis
10.3.5 QIAGEN Business Overview
10.3.6 QIAGEN Recent Developments
10.4 Takara Bio
10.4.1 Takara Bio Micro-RNA Sequencing and Assay Basic Information
10.4.2 Takara Bio Micro-RNA Sequencing and Assay Product Overview
10.4.3 Takara Bio Micro-RNA Sequencing and Assay Product Market Performance
10.4.4 Takara Bio Business Overview
10.4.5 Takara Bio Recent Developments
10.5 NEB
10.5.1 NEB Micro-RNA Sequencing and Assay Basic Information
10.5.2 NEB Micro-RNA Sequencing and Assay Product Overview
10.5.3 NEB Micro-RNA Sequencing and Assay Product Market Performance
10.5.4 NEB Business Overview
10.5.5 NEB Recent Developments
11 Micro-RNA Sequencing and Assay Market Forecast by Region
11.1 Global Micro-RNA Sequencing and Assay Market Size Forecast
11.2 Global Micro-RNA Sequencing and Assay Market Forecast by Region
11.2.1 North America Market Size Forecast by Country
11.2.2 Europe Micro-RNA Sequencing and Assay Market Size Forecast by Country
11.2.3 Asia Pacific Micro-RNA Sequencing and Assay Market Size Forecast by Region
11.2.4 South America Micro-RNA Sequencing and Assay Market Size Forecast by Country
11.2.5 Middle East and Africa Forecasted Consumption of Micro-RNA Sequencing and Assay by Country
12 Forecast Market by Type and by Application (2025-2032)
12.1 Global Micro-RNA Sequencing and Assay Market Forecast by Type (2025-2032)
12.1.1 Global Forecasted Sales of Micro-RNA Sequencing and Assay by Type (2025-2032)
12.1.2 Global Micro-RNA Sequencing and Assay Market Size Forecast by Type (2025-2032)
12.1.3 Global Forecasted Price of Micro-RNA Sequencing and Assay by Type (2025-2032)
12.2 Global Micro-RNA Sequencing and Assay Market Forecast by Application (2025-2032)
12.2.1 Global Micro-RNA Sequencing and Assay Sales (K Units) Forecast by Application
12.2.2 Global Micro-RNA Sequencing and Assay Market Size (M USD) Forecast by Application (2025-2032)
13 Conclusion and Key Findings
LIST OF TABLES & FIGURES
List of Tables
Table 1. Introduction of the Type
Table 2. Introduction of the Application
Table 3. Market Size (M USD) Segment Executive Summary
Table 4. Micro-RNA Sequencing and Assay Market Size Comparison by Region (M USD)
Table 5. Global Micro-RNA Sequencing and Assay Sales (K Units) by Manufacturers (2019-2025)
Table 6. Global Micro-RNA Sequencing and Assay Sales Market Share by Manufacturers (2019-2025)
Table 7. Global Micro-RNA Sequencing and Assay Revenue (M USD) by Manufacturers (2019-2025)
Table 8. Global Micro-RNA Sequencing and Assay Revenue Share by Manufacturers (2019-2025)
Table 9. Company Type (Tier 1, Tier 2, and Tier 3) & (based on the Revenue in Micro-RNA Sequencing and Assay as of 2022)
Table 10. Global Market Micro-RNA Sequencing and Assay Average Price (USD/Unit) of Key Manufacturers (2019-2025)
Table 11. Manufacturers Micro-RNA Sequencing and Assay Sales Sites and Area Served
Table 12. Manufacturers Micro-RNA Sequencing and Assay Product Type
Table 13. Global Micro-RNA Sequencing and Assay Manufacturers Market Concentration Ratio (CR5 and HHI)
Table 14. Mergers & Acquisitions, Expansion Plans
Table 15. Industry Chain Map of Micro-RNA Sequencing and Assay
Table 16. Market Overview of Key Raw Materials
Table 17. Midstream Market Analysis
Table 18. Downstream Customer Analysis
Table 19. Key Development Trends
Table 20. Driving Factors
Table 21. Micro-RNA Sequencing and Assay Market Challenges
Table 22. Global Micro-RNA Sequencing and Assay Sales by Type (K Units)
Table 23. Global Micro-RNA Sequencing and Assay Market Size by Type (M USD)
Table 24. Global Micro-RNA Sequencing and Assay Sales (K Units) by Type (2019-2025)
Table 25. Global Micro-RNA Sequencing and Assay Sales Market Share by Type (2019-2025)
Table 26. Global Micro-RNA Sequencing and Assay Market Size (M USD) by Type (2019-2025)
Table 27. Global Micro-RNA Sequencing and Assay Market Size Share by Type (2019-2025)
Table 28. Global Micro-RNA Sequencing and Assay Price (USD/Unit) by Type (2019-2025)
Table 29. Global Micro-RNA Sequencing and Assay Sales (K Units) by Application
Table 30. Global Micro-RNA Sequencing and Assay Market Size by Application
Table 31. Global Micro-RNA Sequencing and Assay Sales by Application (2019-2025) & (K Units)
Table 32. Global Micro-RNA Sequencing and Assay Sales Market Share by Application (2019-2025)
Table 33. Global Micro-RNA Sequencing and Assay Sales by Application (2019-2025) & (M USD)
Table 34. Global Micro-RNA Sequencing and Assay Market Share by Application (2019-2025)
Table 35. Global Micro-RNA Sequencing and Assay Sales Growth Rate by Application (2019-2025)
Table 36. Global Micro-RNA Sequencing and Assay Sales by Region (2019-2025) & (K Units)
Table 37. Global Micro-RNA Sequencing and Assay Sales Market Share by Region (2019-2025)
Table 38. North America Micro-RNA Sequencing and Assay Sales by Country (2019-2025) & (K Units)
Table 39. Europe Micro-RNA Sequencing and Assay Sales by Country (2019-2025) & (K Units)
Table 40. Asia Pacific Micro-RNA Sequencing and Assay Sales by Region (2019-2025) & (K Units)
Table 41. South America Micro-RNA Sequencing and Assay Sales by Country (2019-2025) & (K Units)
Table 42. Middle East and Africa Micro-RNA Sequencing and Assay Sales by Region (2019-2025) & (K Units)
Table 43. Global Micro-RNA Sequencing and Assay Production (K Units) by Region (2019-2025)
Table 44. Global Micro-RNA Sequencing and Assay Revenue (US$ Million) by Region (2019-2025)
Table 45. Global Micro-RNA Sequencing and Assay Revenue Market Share by Region (2019-2025)
Table 46. Global Micro-RNA Sequencing and Assay Production (K Units), Revenue (US$ Million), Price (USD/Unit) and Gross Margin (2019-2025)
Table 47. North America Micro-RNA Sequencing and Assay Production (K Units), Revenue (US$ Million), Price (USD/Unit) and Gross Margin (2019-2025)
Table 48. Europe Micro-RNA Sequencing and Assay Production (K Units), Revenue (US$ Million), Price (USD/Unit) and Gross Margin (2019-2025)
Table 49. Japan Micro-RNA Sequencing and Assay Production (K Units), Revenue (US$ Million), Price (USD/Unit) and Gross Margin (2019-2025)
Table 50. China Micro-RNA Sequencing and Assay Production (K Units), Revenue (US$ Million), Price (USD/Unit) and Gross Margin (2019-2025)
Table 51. Illumina Micro-RNA Sequencing and Assay Basic Information
Table 52. Illumina Micro-RNA Sequencing and Assay Product Overview
Table 53. Illumina Micro-RNA Sequencing and Assay Sales (K Units), Revenue (M USD), Price (USD/Unit) and Gross Margin (2019-2025)
Table 54. Illumina Business Overview
Table 55. Illumina Micro-RNA Sequencing and Assay SWOT Analysis
Table 56. Illumina Recent Developments
Table 57. Thermo Fisher Scientific Micro-RNA Sequencing and Assay Basic Information
Table 58. Thermo Fisher Scientific Micro-RNA Sequencing and Assay Product Overview
Table 59. Thermo Fisher Scientific Micro-RNA Sequencing and Assay Sales (K Units), Revenue (M USD), Price (USD/Unit) and Gross Margin (2019-2025)
Table 60. Thermo Fisher Scientific Business Overview
Table 61. Thermo Fisher Scientific Micro-RNA Sequencing and Assay SWOT Analysis
Table 62. Thermo Fisher Scientific Recent Developments
Table 63. QIAGEN Micro-RNA Sequencing and Assay Basic Information
Table 64. QIAGEN Micro-RNA Sequencing and Assay Product Overview
Table 65. QIAGEN Micro-RNA Sequencing and Assay Sales (K Units), Revenue (M USD), Price (USD/Unit) and Gross Margin (2019-2025)
Table 66. QIAGEN Micro-RNA Sequencing and Assay SWOT Analysis
Table 67. QIAGEN Business Overview
Table 68. QIAGEN Recent Developments
Table 69. Takara Bio Micro-RNA Sequencing and Assay Basic Information
Table 70. Takara Bio Micro-RNA Sequencing and Assay Product Overview
Table 71. Takara Bio Micro-RNA Sequencing and Assay Sales (K Units), Revenue (M USD), Price (USD/Unit) and Gross Margin (2019-2025)
Table 72. Takara Bio Business Overview
Table 73. Takara Bio Recent Developments
Table 74. NEB Micro-RNA Sequencing and Assay Basic Information
Table 75. NEB Micro-RNA Sequencing and Assay Product Overview
Table 76. NEB Micro-RNA Sequencing and Assay Sales (K Units), Revenue (M USD), Price (USD/Unit) and Gross Margin (2019-2025)
Table 77. NEB Business Overview
Table 78. NEB Recent Developments
Table 79. Global Micro-RNA Sequencing and Assay Sales Forecast by Region (2025-2032) & (K Units)
Table 80. Global Micro-RNA Sequencing and Assay Market Size Forecast by Region (2025-2032) & (M USD)
Table 81. North America Micro-RNA Sequencing and Assay Sales Forecast by Country (2025-2032) & (K Units)
Table 82. North America Micro-RNA Sequencing and Assay Market Size Forecast by Country (2025-2032) & (M USD)
Table 83. Europe Micro-RNA Sequencing and Assay Sales Forecast by Country (2025-2032) & (K Units)
Table 84. Europe Micro-RNA Sequencing and Assay Market Size Forecast by Country (2025-2032) & (M USD)
Table 85. Asia Pacific Micro-RNA Sequencing and Assay Sales Forecast by Region (2025-2032) & (K Units)
Table 86. Asia Pacific Micro-RNA Sequencing and Assay Market Size Forecast by Region (2025-2032) & (M USD)
Table 87. South America Micro-RNA Sequencing and Assay Sales Forecast by Country (2025-2032) & (K Units)
Table 88. South America Micro-RNA Sequencing and Assay Market Size Forecast by Country (2025-2032) & (M USD)
Table 89. Middle East and Africa Micro-RNA Sequencing and Assay Consumption Forecast by Country (2025-2032) & (Units)
Table 90. Middle East and Africa Micro-RNA Sequencing and Assay Market Size Forecast by Country (2025-2032) & (M USD)
Table 91. Global Micro-RNA Sequencing and Assay Sales Forecast by Type (2025-2032) & (K Units)
Table 92. Global Micro-RNA Sequencing and Assay Market Size Forecast by Type (2025-2032) & (M USD)
Table 93. Global Micro-RNA Sequencing and Assay Price Forecast by Type (2025-2032) & (USD/Unit)
Table 94. Global Micro-RNA Sequencing and Assay Sales (K Units) Forecast by Application (2025-2032)
Table 95. Global Micro-RNA Sequencing and Assay Market Size Forecast by Application (2025-2032) & (M USD)
List of Figures
Figure 1. Product Picture of Micro-RNA Sequencing and Assay
Figure 2. Data Triangulation
Figure 3. Key Caveats
Figure 4. Global Micro-RNA Sequencing and Assay Market Size (M USD), 2019-2032
Figure 5. Global Micro-RNA Sequencing and Assay Market Size (M USD) (2019-2032)
Figure 6. Global Micro-RNA Sequencing and Assay Sales (K Units) & (2019-2032)
Figure 7. Evaluation Matrix of Segment Market Development Potential (Type)
Figure 8. Evaluation Matrix of Segment Market Development Potential (Application)
Figure 9. Evaluation Matrix of Regional Market Development Potential
Figure 10. Micro-RNA Sequencing and Assay Market Size by Country (M USD)
Figure 11. Micro-RNA Sequencing and Assay Sales Share by Manufacturers in 2023
Figure 12. Global Micro-RNA Sequencing and Assay Revenue Share by Manufacturers in 2023
Figure 13. Micro-RNA Sequencing and Assay Market Share by Company Type (Tier 1, Tier 2 and Tier 3): 2023
Figure 14. Global Market Micro-RNA Sequencing and Assay Average Price (USD/Unit) of Key Manufacturers in 2023
Figure 15. The Global 5 and 10 Largest Players: Market Share by Micro-RNA Sequencing and Assay Revenue in 2023
Figure 16. Evaluation Matrix of Segment Market Development Potential (Type)
Figure 17. Global Micro-RNA Sequencing and Assay Market Share by Type
Figure 18. Sales Market Share of Micro-RNA Sequencing and Assay by Type (2019-2025)
Figure 19. Sales Market Share of Micro-RNA Sequencing and Assay by Type in 2023
Figure 20. Market Size Share of Micro-RNA Sequencing and Assay by Type (2019-2025)
Figure 21. Market Size Market Share of Micro-RNA Sequencing and Assay by Type in 2023
Figure 22. Evaluation Matrix of Segment Market Development Potential (Application)
Figure 23. Global Micro-RNA Sequencing and Assay Market Share by Application
Figure 24. Global Micro-RNA Sequencing and Assay Sales Market Share by Application (2019-2025)
Figure 25. Global Micro-RNA Sequencing and Assay Sales Market Share by Application in 2023
Figure 26. Global Micro-RNA Sequencing and Assay Market Share by Application (2019-2025)
Figure 27. Global Micro-RNA Sequencing and Assay Market Share by Application in 2023
Figure 28. Global Micro-RNA Sequencing and Assay Sales Growth Rate by Application (2019-2025)
Figure 29. Global Micro-RNA Sequencing and Assay Sales Market Share by Region (2019-2025)
Figure 30. North America Micro-RNA Sequencing and Assay Sales and Growth Rate (2019-2025) & (K Units)
Figure 31. North America Micro-RNA Sequencing and Assay Sales Market Share by Country in 2023
Figure 32. U.S. Micro-RNA Sequencing and Assay Sales and Growth Rate (2019-2025) & (K Units)
Figure 33. Canada Micro-RNA Sequencing and Assay Sales (K Units) and Growth Rate (2019-2025)
Figure 34. Mexico Micro-RNA Sequencing and Assay Sales (Units) and Growth Rate (2019-2025)
Figure 35. Europe Micro-RNA Sequencing and Assay Sales and Growth Rate (2019-2025) & (K Units)
Figure 36. Europe Micro-RNA Sequencing and Assay Sales Market Share by Country in 2023
Figure 37. Germany Micro-RNA Sequencing and Assay Sales and Growth Rate (2019-2025) & (K Units)
Figure 38. France Micro-RNA Sequencing and Assay Sales and Growth Rate (2019-2025) & (K Units)
Figure 39. U.K. Micro-RNA Sequencing and Assay Sales and Growth Rate (2019-2025) & (K Units)
Figure 40. Italy Micro-RNA Sequencing and Assay Sales and Growth Rate (2019-2025) & (K Units)
Figure 41. Russia Micro-RNA Sequencing and Assay Sales and Growth Rate (2019-2025) & (K Units)
Figure 42. Asia Pacific Micro-RNA Sequencing and Assay Sales and Growth Rate (K Units)
Figure 43. Asia Pacific Micro-RNA Sequencing and Assay Sales Market Share by Region in 2023
Figure 44. China Micro-RNA Sequencing and Assay Sales and Growth Rate (2019-2025) & (K Units)
Figure 45. Japan Micro-RNA Sequencing and Assay Sales and Growth Rate (2019-2025) & (K Units)
Figure 46. South Korea Micro-RNA Sequencing and Assay Sales and Growth Rate (2019-2025) & (K Units)
Figure 47. India Micro-RNA Sequencing and Assay Sales and Growth Rate (2019-2025) & (K Units)
Figure 48. Southeast Asia Micro-RNA Sequencing and Assay Sales and Growth Rate (2019-2025) & (K Units)
Figure 49. South America Micro-RNA Sequencing and Assay Sales and Growth Rate (K Units)
Figure 50. South America Micro-RNA Sequencing and Assay Sales Market Share by Country in 2023
Figure 51. Brazil Micro-RNA Sequencing and Assay Sales and Growth Rate (2019-2025) & (K Units)
Figure 52. Argentina Micro-RNA Sequencing and Assay Sales and Growth Rate (2019-2025) & (K Units)
Figure 53. Columbia Micro-RNA Sequencing and Assay Sales and Growth Rate (2019-2025) & (K Units)
Figure 54. Middle East and Africa Micro-RNA Sequencing and Assay Sales and Growth Rate (K Units)
Figure 55. Middle East and Africa Micro-RNA Sequencing and Assay Sales Market Share by Region in 2023
Figure 56. Saudi Arabia Micro-RNA Sequencing and Assay Sales and Growth Rate (2019-2025) & (K Units)
Figure 57. UAE Micro-RNA Sequencing and Assay Sales and Growth Rate (2019-2025) & (K Units)
Figure 58. Egypt Micro-RNA Sequencing and Assay Sales and Growth Rate (2019-2025) & (K Units)
Figure 59. Nigeria Micro-RNA Sequencing and Assay Sales and Growth Rate (2019-2025) & (K Units)
Figure 60. South Africa Micro-RNA Sequencing and Assay Sales and Growth Rate (2019-2025) & (K Units)
Figure 61. Global Micro-RNA Sequencing and Assay Production Market Share by Region (2019-2025)
Figure 62. North America Micro-RNA Sequencing and Assay Production (K Units) Growth Rate (2019-2025)
Figure 63. Europe Micro-RNA Sequencing and Assay Production (K Units) Growth Rate (2019-2025)
Figure 64. Japan Micro-RNA Sequencing and Assay Production (K Units) Growth Rate (2019-2025)
Figure 65. China Micro-RNA Sequencing and Assay Production (K Units) Growth Rate (2019-2025)
Figure 66. Global Micro-RNA Sequencing and Assay Sales Forecast by Volume (2019-2032) & (K Units)
Figure 67. Global Micro-RNA Sequencing and Assay Market Size Forecast by Value (2019-2032) & (M USD)
Figure 68. Global Micro-RNA Sequencing and Assay Sales Market Share Forecast by Type (2025-2032)
Figure 69. Global Micro-RNA Sequencing and Assay Market Share Forecast by Type (2025-2032)
Figure 70. Global Micro-RNA Sequencing and Assay Sales Forecast by Application (2025-2032)
Figure 71. Global Micro-RNA Sequencing and Assay Market Share Forecast by Application (2025-2032)

