A Military Armored Car is a specialized combat vehicle designed to provide superior protection and tactical mobility in hostile environments. These vehicles are essential in modern warfare, offering enhanced defense for military personnel against a wide range of threats, such as ballistic attacks, explosive devices, and shrapnel. Military armored cars are equipped with bulletproof windows, armored plating, and advanced surveillance and communication systems. They play a crucial role in reconnaissance missions, security patrols, and troop transport in dangerous combat zones, ensuring the safety of soldiers while maintaining operational mobility.
Market Size
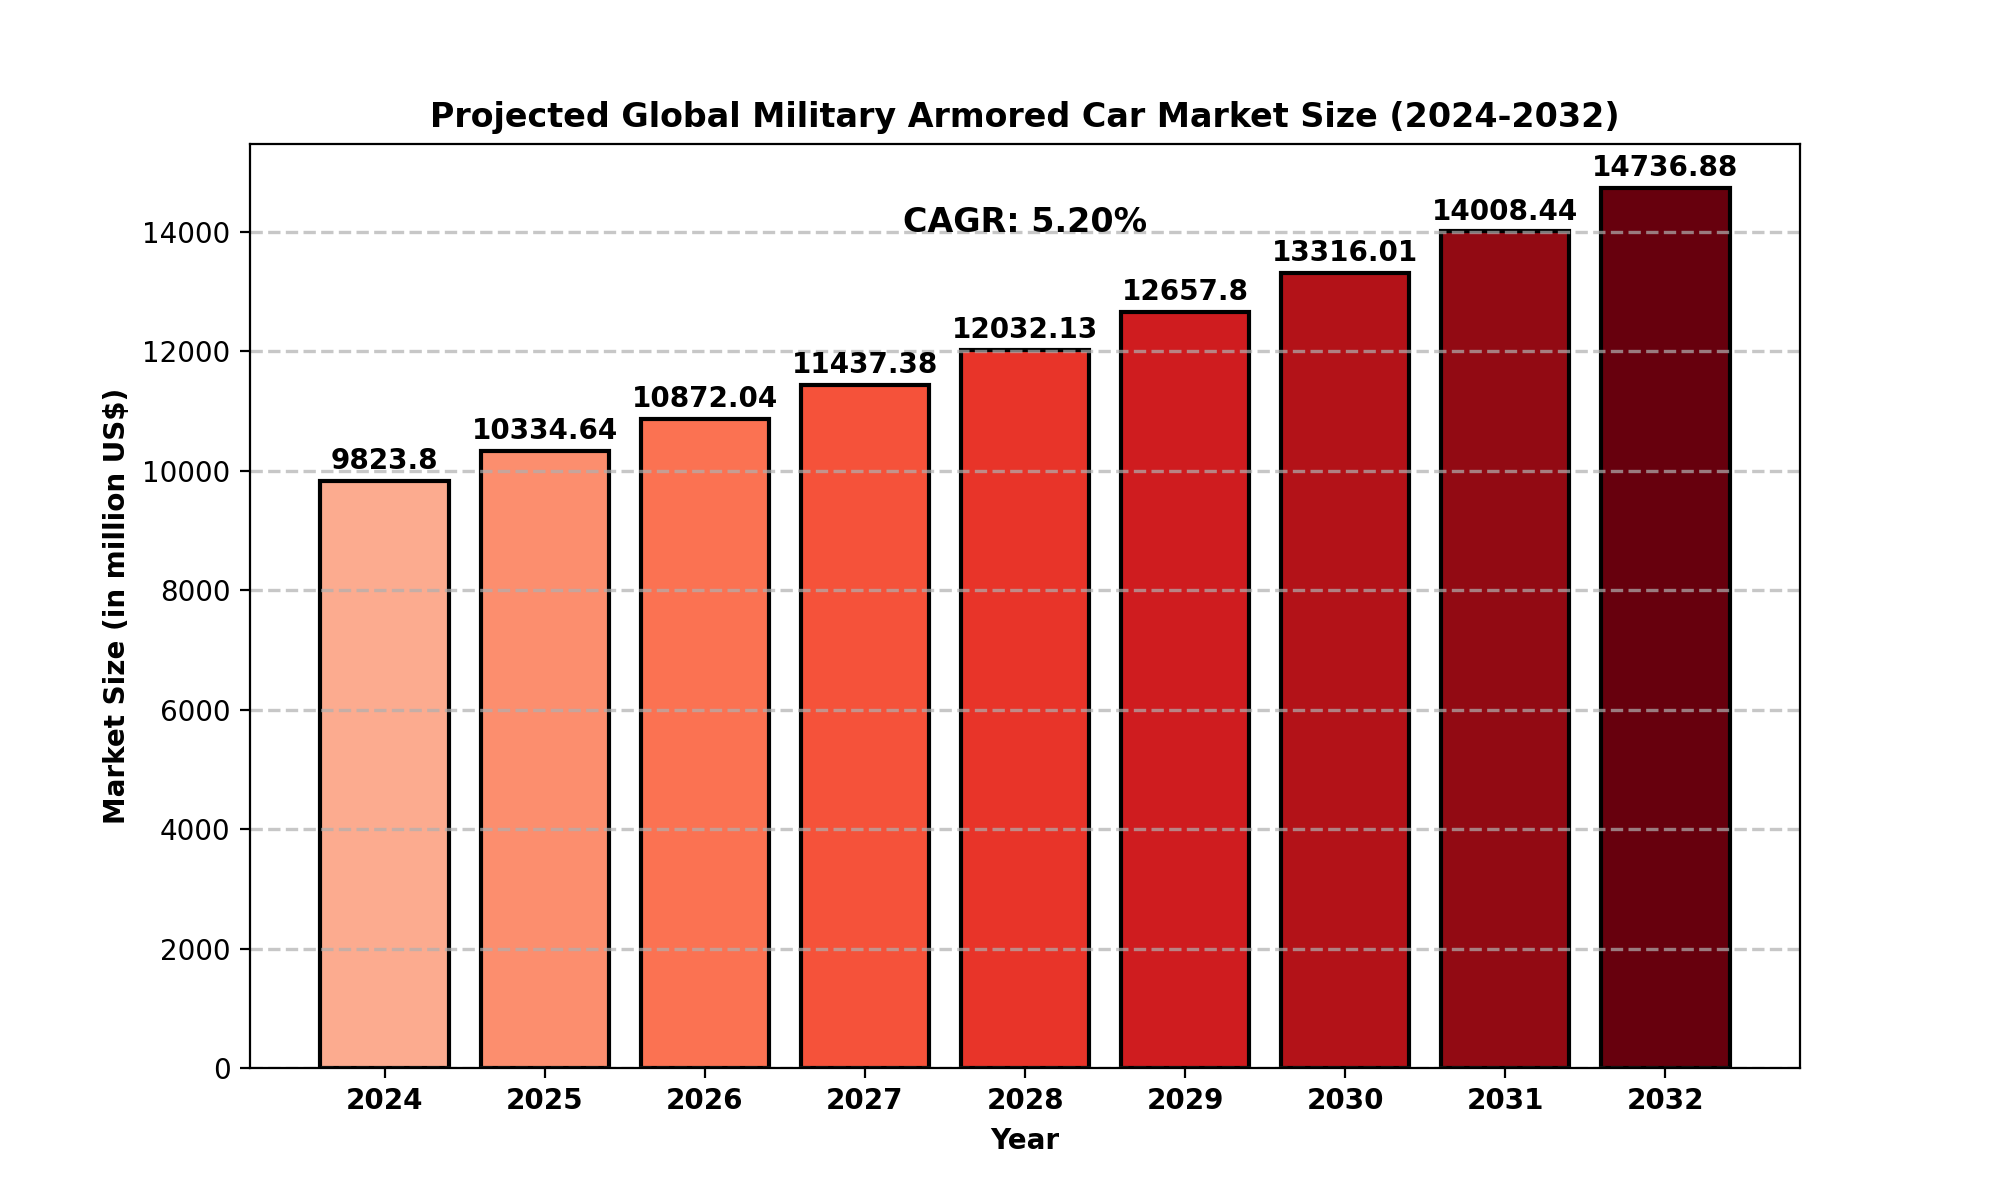
The global Military Armored Car market was valued at approximately USD 9.82 billion in 2024 and is projected to reach USD 14.73 billion by 2032, reflecting a compound annual growth rate (CAGR) of 5.20% during the forecast period.
This growth is driven by increasing defense expenditures worldwide and the rising demand for protection solutions in both military and homeland security applications. As countries enhance their defense capabilities and face escalating geopolitical tensions, the need for such armored vehicles will continue to rise.
Market Dynamics
Drivers
The market for military armored cars is primarily driven by several key factors:
-
Rising Security Concerns: With the growing prevalence of terrorist threats and armed conflicts, there is an increasing need for armored vehicles that can protect soldiers, VIPs, and critical infrastructure.
-
Defense Budget Increases: Many nations are increasing their defense spending to modernize military equipment, which includes acquiring more advanced armored vehicles.
-
Technological Advancements: Integration of cutting-edge technologies like autonomous driving systems, AI-powered surveillance, and improved armor materials are enhancing the efficiency and effectiveness of armored cars.
-
International Defense Collaborations: The expanding network of defense collaborations and agreements between countries is boosting demand for armored military vehicles.
Restraints
Despite the market’s growth, several challenges could hinder its expansion:
-
High Costs: The high production and maintenance costs of armored vehicles make them expensive investments for governments, especially in countries with limited defense budgets.
-
Regulatory Hurdles: Stringent regulations regarding the manufacture and export of military vehicles, especially to politically sensitive regions, could slow market growth.
-
Geopolitical Instability: While demand increases in conflict zones, certain regions experience fluctuations in political stability, which could affect procurement decisions.
Opportunities
There are significant opportunities for growth in the following areas:
-
Emerging Markets: Countries in Asia-Pacific, the Middle East, and Africa are seeing rising demand for military armored cars as their defense budgets grow due to regional security threats.
-
Upgrades and Retrofit Services: Many existing armored vehicles require upgrades, such as improved armor and enhanced surveillance systems, presenting opportunities for defense contractors to offer retrofit services.
-
Non-Defense Applications: Armored vehicles are increasingly being used in homeland security, law enforcement, and even commercial applications, expanding the market beyond traditional military uses.
Challenges
The military armored car market faces several ongoing challenges:
-
Sustainability and Environmental Concerns: The manufacturing of armored vehicles is energy-intensive and could face increasing pressure to adopt more environmentally friendly materials and processes.
-
Cybersecurity Threats: As armored vehicles integrate more digital systems, they become more vulnerable to cyberattacks, creating a need for enhanced cybersecurity measures.
-
Maintenance and Logistics: Given their complexity and the harsh environments in which they are used, armored vehicles require extensive maintenance and logistics support, adding to operational costs.
Regional Analysis
The market dynamics vary across different geographic regions, with some regions showing more robust demand for military armored cars than others.
-
North America: The North American market is the largest, with the U.S. contributing significantly to the demand. The U.S. military’s substantial defense budget, combined with geopolitical instability in various regions, has driven up demand for armored vehicles. The region is expected to maintain steady growth, with a CAGR of 4.46% through 2032.
-
Europe: Europe is experiencing a stable demand for military armored cars, primarily from countries like France, Germany, and the U.K., which continue to modernize their defense fleets in response to the evolving security situation in Eastern Europe.
-
Asia-Pacific: The Asia-Pacific region is expected to experience the highest growth rate during the forecast period, driven by military modernization programs in countries like India, China, and Japan.
-
South America: While demand remains relatively modest, increasing security concerns and defense investments in countries like Brazil may contribute to gradual market growth.
-
Middle East and Africa: This region continues to face high demand due to ongoing conflicts and terrorism-related threats, which are expected to keep the military armored car market active.
Competitor Analysis (in brief)
The global military armored car market is highly competitive, with several prominent companies dominating the space. These companies offer a wide range of armored vehicles for various military and security needs, focusing on quality, innovation, and advanced protection technologies. Some of the key players in the market include:
-
STREIT Group: Known for its extensive range of armored vehicles, STREIT Group has a strong presence across North America, Europe, and Asia.
-
Centigon Security Group: Centigon is a leading manufacturer of armored vehicles, specializing in custom-built solutions for military and civilian applications.
-
INKAS: INKAS is a renowned provider of high-end armored vehicles, including SUVs and specialized military cars.
-
Armormax: A major player in the armored car market, Armormax offers vehicle armoring services with cutting-edge technology.
-
DIMA HOLDINGS Co. Ltd: DIMA is recognized for its armored car manufacturing and armoring services, catering to both military and commercial sectors.
Global Military Armored Car Market: Market Segmentation Analysis
This report provides a deep insight into the global Military Armored Car market, covering all its essential aspects. This ranges from a macro overview of the market to micro details of the market size, competitive landscape, development trend, niche market, key market drivers and challenges, SWOT analysis, value chain analysis, etc.
The analysis helps the reader to shape the competition within the industries and strategies for the competitive environment to enhance the potential profit. Furthermore, it provides a simple framework for evaluating and assessing the position of the business organization. The report structure also focuses on the competitive landscape of the Global Military Armored Car market. This report introduces in detail the market share, market performance, product situation, operation situation, etc., of the main players, which helps the readers in the industry to identify the main competitors and deeply understand the competition pattern of the market.
In a word, this report is a must-read for industry players, investors, researchers, consultants, business strategists, and all those who have any kind of stake or are planning to foray into the Military Armored Car market in any manner.
Market Segmentation (by Application)
-
Defense: The largest application for military armored cars, focusing on troop protection, security patrols, and battlefield reconnaissance.
-
Homeland Security: Armored vehicles are increasingly being deployed for domestic security, anti-terrorism efforts, and law enforcement protection.
Market Segmentation (by Type)
Key Company
-
STREIT Group
-
Centigon Security Group
-
INKAS
-
Armormax
-
DIMA HOLDINGS Co. Ltd
-
MSPV
-
Double Star (Shanghai)
-
JANKEL ARMOURING
-
The Armored Group
-
Shell Armored Vehicles
-
Alpine Armoring Inc
-
WELP Armouring
-
JCBL Armouring Solutions
Geographic Segmentation
-
North America (USA, Canada, Mexico)
-
Europe (Germany, UK, France, Russia, Italy, Rest of Europe)
-
Asia-Pacific (China, Japan, South Korea, India, Southeast Asia, Rest of Asia-Pacific)
-
South America (Brazil, Argentina, Columbia, Rest of South America)
-
The Middle East and Africa (Saudi Arabia, UAE, Egypt, Nigeria, South Africa, Rest of MEA)
FAQ Section
What is the current market size of the Military Armored Car market?
- The global Military Armored Car market was valued at USD 9.82 billion in 2024 and is projected to grow to USD 15.50 billion by 2032.
Which are the key companies operating in the Military Armored Car market?
- Key companies include STREIT Group, Centigon Security Group, INKAS, Armormax, and DIMA HOLDINGS Co. Ltd.
What are the key growth drivers in the Military Armored Car market?
- Key drivers include rising security concerns, defense budget increases, technological advancements, and international defense collaborations.
Which regions dominate the Military Armored Car market?
- North America, Europe, and Asia-Pacific dominate the military armored car market, with North America having the largest market share.
What are the emerging trends in the Military Armored Car market?
- Emerging trends include technological innovations like autonomous systems, increased demand in emerging markets, and the integration of advanced armor materials.
Key Benefits of This Market Research:
- Industry drivers, restraints, and opportunities covered in the study
- Neutral perspective on the market performance
- Recent industry trends and developments
- Competitive landscape & strategies of key players
- Potential & niche segments and regions exhibiting promising growth covered
- Historical, current, and projected market size, in terms of value
- In-depth analysis of the Military Armored Car Market
- Overview of the regional outlook of the Military Armored Car Market:
Key Reasons to Buy this Report:
- Access to date statistics compiled by our researchers. These provide you with historical and forecast data, which is analyzed to tell you why your market is set to change
- This enables you to anticipate market changes to remain ahead of your competitors
- You will be able to copy data from the Excel spreadsheet straight into your marketing plans, business presentations, or other strategic documents
- The concise analysis, clear graph, and table format will enable you to pinpoint the information you require quickly
- Provision of market value data for each segment and sub-segment
- Indicates the region and segment that is expected to witness the fastest growth as well as to dominate the market
- Analysis by geography highlighting the consumption of the product/service in the region as well as indicating the factors that are affecting the market within each region
- Competitive landscape which incorporates the market ranking of the major players, along with new service/product launches, partnerships, business expansions, and acquisitions in the past five years of companies profiled
- Extensive company profiles comprising of company overview, company insights, product benchmarking, and SWOT analysis for the major market players
- The current as well as the future market outlook of the industry concerning recent developments which involve growth opportunities and drivers as well as challenges and restraints of both emerging as well as developed regions
- Includes in-depth analysis of the market from various perspectives through Porter
TABLE OF CONTENTS
Table of Contents
1 Research Methodology and Statistical Scope
1.1 Market Definition and Statistical Scope of Military Armored Car
1.2 Key Market Segments
1.2.1 Military Armored Car Segment by Type
1.2.2 Military Armored Car Segment by Application
1.3 Methodology & Sources of Information
1.3.1 Research Methodology
1.3.2 Research Process
1.3.3 Market Breakdown and Data Triangulation
1.3.4 Base Year
1.3.5 Report Assumptions & Caveats
1.4 Key Data of Global Auto Market
1.4.1 Global Automobile Production by Country
1.4.2 Global Automobile Production by Type
2 Military Armored Car Market Overview
2.1 Global Market Overview
2.1.1 Global Military Armored Car Market Size (M USD) Estimates and Forecasts (2019-2032)
2.1.2 Global Military Armored Car Sales Estimates and Forecasts (2019-2032)
2.2 Market Segment Executive Summary
2.3 Global Market Size by Region
3 Military Armored Car Market Competitive Landscape
3.1 Global Military Armored Car Sales by Manufacturers (2019-2025)
3.2 Global Military Armored Car Revenue Market Share by Manufacturers (2019-2025)
3.3 Military Armored Car Market Share by Company Type (Tier 1, Tier 2, and Tier 3)
3.4 Global Military Armored Car Average Price by Manufacturers (2019-2025)
3.5 Manufacturers Military Armored Car Sales Sites, Area Served, Product Type
3.6 Military Armored Car Market Competitive Situation and Trends
3.6.1 Military Armored Car Market Concentration Rate
3.6.2 Global 5 and 10 Largest Military Armored Car Players Market Share by Revenue
3.6.3 Mergers & Acquisitions, Expansion
4 Military Armored Car Industry Chain Analysis
4.1 Military Armored Car Industry Chain Analysis
4.2 Market Overview of Key Raw Materials
4.3 Midstream Market Analysis
4.4 Downstream Customer Analysis
5 The Development and Dynamics of Military Armored Car Market
5.1 Key Development Trends
5.2 Driving Factors
5.3 Market Challenges
5.4 Market Restraints
5.5 Industry News
5.5.1 New Product Developments
5.5.2 Mergers & Acquisitions
5.5.3 Expansions
5.5.4 Collaboration/Supply Contracts
5.6 Industry Policies
6 Military Armored Car Market Segmentation by Type
6.1 Evaluation Matrix of Segment Market Development Potential (Type)
6.2 Global Military Armored Car Sales Market Share by Type (2019-2025)
6.3 Global Military Armored Car Market Size Market Share by Type (2019-2025)
6.4 Global Military Armored Car Price by Type (2019-2025)
7 Military Armored Car Market Segmentation by Application
7.1 Evaluation Matrix of Segment Market Development Potential (Application)
7.2 Global Military Armored Car Market Sales by Application (2019-2025)
7.3 Global Military Armored Car Market Size (M USD) by Application (2019-2025)
7.4 Global Military Armored Car Sales Growth Rate by Application (2019-2025)
8 Military Armored Car Market Consumption by Region
8.1 Global Military Armored Car Sales by Region
8.1.1 Global Military Armored Car Sales by Region
8.1.2 Global Military Armored Car Sales Market Share by Region
8.2 North America
8.2.1 North America Military Armored Car Sales by Country
8.2.2 U.S.
8.2.3 Canada
8.2.4 Mexico
8.3 Europe
8.3.1 Europe Military Armored Car Sales by Country
8.3.2 Germany
8.3.3 France
8.3.4 U.K.
8.3.5 Italy
8.3.6 Russia
8.4 Asia Pacific
8.4.1 Asia Pacific Military Armored Car Sales by Region
8.4.2 China
8.4.3 Japan
8.4.4 South Korea
8.4.5 India
8.4.6 Southeast Asia
8.5 South America
8.5.1 South America Military Armored Car Sales by Country
8.5.2 Brazil
8.5.3 Argentina
8.5.4 Columbia
8.6 Middle East and Africa
8.6.1 Middle East and Africa Military Armored Car Sales by Region
8.6.2 Saudi Arabia
8.6.3 UAE
8.6.4 Egypt
8.6.5 Nigeria
8.6.6 South Africa
9 Military Armored Car Market Production by Region
9.1 Global Production of Military Armored Car by Region (2019-2025)
9.2 Global Military Armored Car Revenue Market Share by Region (2019-2025)
9.3 Global Military Armored Car Production, Revenue, Price and Gross Margin (2019-2025)
9.4 North America Military Armored Car Production
9.4.1 North America Military Armored Car Production Growth Rate (2019-2025)
9.4.2 North America Military Armored Car Production, Revenue, Price and Gross Margin (2019-2025)
9.5 Europe Military Armored Car Production
9.5.1 Europe Military Armored Car Production Growth Rate (2019-2025)
9.5.2 Europe Military Armored Car Production, Revenue, Price and Gross Margin (2019-2025)
9.6 Japan Military Armored Car Production (2019-2025)
9.6.1 Japan Military Armored Car Production Growth Rate (2019-2025)
9.6.2 Japan Military Armored Car Production, Revenue, Price and Gross Margin (2019-2025)
9.7 China Military Armored Car Production (2019-2025)
9.7.1 China Military Armored Car Production Growth Rate (2019-2025)
9.7.2 China Military Armored Car Production, Revenue, Price and Gross Margin (2019-2025)
10 Key Companies Profile
10.1 STREIT Group
10.1.1 STREIT Group Military Armored Car Basic Information
10.1.2 STREIT Group Military Armored Car Product Overview
10.1.3 STREIT Group Military Armored Car Product Market Performance
10.1.4 STREIT Group Business Overview
10.1.5 STREIT Group Military Armored Car SWOT Analysis
10.1.6 STREIT Group Recent Developments
10.2 Centigon Security Group
10.2.1 Centigon Security Group Military Armored Car Basic Information
10.2.2 Centigon Security Group Military Armored Car Product Overview
10.2.3 Centigon Security Group Military Armored Car Product Market Performance
10.2.4 Centigon Security Group Business Overview
10.2.5 Centigon Security Group Military Armored Car SWOT Analysis
10.2.6 Centigon Security Group Recent Developments
10.3 INKAS
10.3.1 INKAS Military Armored Car Basic Information
10.3.2 INKAS Military Armored Car Product Overview
10.3.3 INKAS Military Armored Car Product Market Performance
10.3.4 INKAS Military Armored Car SWOT Analysis
10.3.5 INKAS Business Overview
10.3.6 INKAS Recent Developments
10.4 Armormax
10.4.1 Armormax Military Armored Car Basic Information
10.4.2 Armormax Military Armored Car Product Overview
10.4.3 Armormax Military Armored Car Product Market Performance
10.4.4 Armormax Business Overview
10.4.5 Armormax Recent Developments
10.5 DIMA HOLDINGS Co.
10.5.1 DIMA HOLDINGS Co. Military Armored Car Basic Information
10.5.2 DIMA HOLDINGS Co. Military Armored Car Product Overview
10.5.3 DIMA HOLDINGS Co. Military Armored Car Product Market Performance
10.5.4 DIMA HOLDINGS Co. Business Overview
10.5.5 DIMA HOLDINGS Co. Recent Developments
10.6 Ltd
10.6.1 Ltd Military Armored Car Basic Information
10.6.2 Ltd Military Armored Car Product Overview
10.6.3 Ltd Military Armored Car Product Market Performance
10.6.4 Ltd Business Overview
10.6.5 Ltd Recent Developments
10.7 MSPV
10.7.1 MSPV Military Armored Car Basic Information
10.7.2 MSPV Military Armored Car Product Overview
10.7.3 MSPV Military Armored Car Product Market Performance
10.7.4 MSPV Business Overview
10.7.5 MSPV Recent Developments
10.8 Double Star (Shanghai)
10.8.1 Double Star (Shanghai) Military Armored Car Basic Information
10.8.2 Double Star (Shanghai) Military Armored Car Product Overview
10.8.3 Double Star (Shanghai) Military Armored Car Product Market Performance
10.8.4 Double Star (Shanghai) Business Overview
10.8.5 Double Star (Shanghai) Recent Developments
10.9 JANKEL ARMOURING
10.9.1 JANKEL ARMOURING Military Armored Car Basic Information
10.9.2 JANKEL ARMOURING Military Armored Car Product Overview
10.9.3 JANKEL ARMOURING Military Armored Car Product Market Performance
10.9.4 JANKEL ARMOURING Business Overview
10.9.5 JANKEL ARMOURING Recent Developments
10.10 The Armored Group
10.10.1 The Armored Group Military Armored Car Basic Information
10.10.2 The Armored Group Military Armored Car Product Overview
10.10.3 The Armored Group Military Armored Car Product Market Performance
10.10.4 The Armored Group Business Overview
10.10.5 The Armored Group Recent Developments
10.11 Shell Armored Vehicles
10.11.1 Shell Armored Vehicles Military Armored Car Basic Information
10.11.2 Shell Armored Vehicles Military Armored Car Product Overview
10.11.3 Shell Armored Vehicles Military Armored Car Product Market Performance
10.11.4 Shell Armored Vehicles Business Overview
10.11.5 Shell Armored Vehicles Recent Developments
10.12 Alpine Armoring Inc
10.12.1 Alpine Armoring Inc Military Armored Car Basic Information
10.12.2 Alpine Armoring Inc Military Armored Car Product Overview
10.12.3 Alpine Armoring Inc Military Armored Car Product Market Performance
10.12.4 Alpine Armoring Inc Business Overview
10.12.5 Alpine Armoring Inc Recent Developments
10.13 WELP Armouring
10.13.1 WELP Armouring Military Armored Car Basic Information
10.13.2 WELP Armouring Military Armored Car Product Overview
10.13.3 WELP Armouring Military Armored Car Product Market Performance
10.13.4 WELP Armouring Business Overview
10.13.5 WELP Armouring Recent Developments
10.14 JCBL Armouring Solutions
10.14.1 JCBL Armouring Solutions Military Armored Car Basic Information
10.14.2 JCBL Armouring Solutions Military Armored Car Product Overview
10.14.3 JCBL Armouring Solutions Military Armored Car Product Market Performance
10.14.4 JCBL Armouring Solutions Business Overview
10.14.5 JCBL Armouring Solutions Recent Developments
11 Military Armored Car Market Forecast by Region
11.1 Global Military Armored Car Market Size Forecast
11.2 Global Military Armored Car Market Forecast by Region
11.2.1 North America Market Size Forecast by Country
11.2.2 Europe Military Armored Car Market Size Forecast by Country
11.2.3 Asia Pacific Military Armored Car Market Size Forecast by Region
11.2.4 South America Military Armored Car Market Size Forecast by Country
11.2.5 Middle East and Africa Forecasted Consumption of Military Armored Car by Country
12 Forecast Market by Type and by Application (2025-2032)
12.1 Global Military Armored Car Market Forecast by Type (2025-2032)
12.1.1 Global Forecasted Sales of Military Armored Car by Type (2025-2032)
12.1.2 Global Military Armored Car Market Size Forecast by Type (2025-2032)
12.1.3 Global Forecasted Price of Military Armored Car by Type (2025-2032)
12.2 Global Military Armored Car Market Forecast by Application (2025-2032)
12.2.1 Global Military Armored Car Sales (K Units) Forecast by Application
12.2.2 Global Military Armored Car Market Size (M USD) Forecast by Application (2025-2032)
13 Conclusion and Key Findings
LIST OF TABLES & FIGURES
List of Tables
Table 1. Introduction of the Type
Table 2. Introduction of the Application
Table 3. Motor Vehicle Production Market Share by Type (2023)
Table 4. Global Automobile Production by Region (Units)
Table 5. Market Share and Development Potential of Automobiles by Region
Table 6. Global Automobile Production by Country (Vehicle)
Table 7. Market Share and Development Potential of Automobiles by Countries
Table 8. Global Automobile Production by Type
Table 9. Market Share and Development Potential of Automobiles by Type
Table 10. Market Size (M USD) Segment Executive Summary
Table 11. Military Armored Car Market Size Comparison by Region (M USD)
Table 12. Global Military Armored Car Sales (K Units) by Manufacturers (2019-2025)
Table 13. Global Military Armored Car Sales Market Share by Manufacturers (2019-2025)
Table 14. Global Military Armored Car Revenue (M USD) by Manufacturers (2019-2025)
Table 15. Global Military Armored Car Revenue Share by Manufacturers (2019-2025)
Table 16. Company Type (Tier 1, Tier 2, and Tier 3) & (based on the Revenue in Military Armored Car as of 2022)
Table 17. Global Market Military Armored Car Average Price (USD/Unit) of Key Manufacturers (2019-2025)
Table 18. Manufacturers Military Armored Car Sales Sites and Area Served
Table 19. Manufacturers Military Armored Car Product Type
Table 20. Global Military Armored Car Manufacturers Market Concentration Ratio (CR5 and HHI)
Table 21. Mergers & Acquisitions, Expansion Plans
Table 22. Industry Chain Map of Military Armored Car
Table 23. Market Overview of Key Raw Materials
Table 24. Midstream Market Analysis
Table 25. Downstream Customer Analysis
Table 26. Key Development Trends
Table 27. Driving Factors
Table 28. Military Armored Car Market Challenges
Table 29. Global Military Armored Car Sales by Type (K Units)
Table 30. Global Military Armored Car Market Size by Type (M USD)
Table 31. Global Military Armored Car Sales (K Units) by Type (2019-2025)
Table 32. Global Military Armored Car Sales Market Share by Type (2019-2025)
Table 33. Global Military Armored Car Market Size (M USD) by Type (2019-2025)
Table 34. Global Military Armored Car Market Size Share by Type (2019-2025)
Table 35. Global Military Armored Car Price (USD/Unit) by Type (2019-2025)
Table 36. Global Military Armored Car Sales (K Units) by Application
Table 37. Global Military Armored Car Market Size by Application
Table 38. Global Military Armored Car Sales by Application (2019-2025) & (K Units)
Table 39. Global Military Armored Car Sales Market Share by Application (2019-2025)
Table 40. Global Military Armored Car Sales by Application (2019-2025) & (M USD)
Table 41. Global Military Armored Car Market Share by Application (2019-2025)
Table 42. Global Military Armored Car Sales Growth Rate by Application (2019-2025)
Table 43. Global Military Armored Car Sales by Region (2019-2025) & (K Units)
Table 44. Global Military Armored Car Sales Market Share by Region (2019-2025)
Table 45. North America Military Armored Car Sales by Country (2019-2025) & (K Units)
Table 46. Europe Military Armored Car Sales by Country (2019-2025) & (K Units)
Table 47. Asia Pacific Military Armored Car Sales by Region (2019-2025) & (K Units)
Table 48. South America Military Armored Car Sales by Country (2019-2025) & (K Units)
Table 49. Middle East and Africa Military Armored Car Sales by Region (2019-2025) & (K Units)
Table 50. Global Military Armored Car Production (K Units) by Region (2019-2025)
Table 51. Global Military Armored Car Revenue (US$ Million) by Region (2019-2025)
Table 52. Global Military Armored Car Revenue Market Share by Region (2019-2025)
Table 53. Global Military Armored Car Production (K Units), Revenue (US$ Million), Price (USD/Unit) and Gross Margin (2019-2025)
Table 54. North America Military Armored Car Production (K Units), Revenue (US$ Million), Price (USD/Unit) and Gross Margin (2019-2025)
Table 55. Europe Military Armored Car Production (K Units), Revenue (US$ Million), Price (USD/Unit) and Gross Margin (2019-2025)
Table 56. Japan Military Armored Car Production (K Units), Revenue (US$ Million), Price (USD/Unit) and Gross Margin (2019-2025)
Table 57. China Military Armored Car Production (K Units), Revenue (US$ Million), Price (USD/Unit) and Gross Margin (2019-2025)
Table 58. STREIT Group Military Armored Car Basic Information
Table 59. STREIT Group Military Armored Car Product Overview
Table 60. STREIT Group Military Armored Car Sales (K Units), Revenue (M USD), Price (USD/Unit) and Gross Margin (2019-2025)
Table 61. STREIT Group Business Overview
Table 62. STREIT Group Military Armored Car SWOT Analysis
Table 63. STREIT Group Recent Developments
Table 64. Centigon Security Group Military Armored Car Basic Information
Table 65. Centigon Security Group Military Armored Car Product Overview
Table 66. Centigon Security Group Military Armored Car Sales (K Units), Revenue (M USD), Price (USD/Unit) and Gross Margin (2019-2025)
Table 67. Centigon Security Group Business Overview
Table 68. Centigon Security Group Military Armored Car SWOT Analysis
Table 69. Centigon Security Group Recent Developments
Table 70. INKAS Military Armored Car Basic Information
Table 71. INKAS Military Armored Car Product Overview
Table 72. INKAS Military Armored Car Sales (K Units), Revenue (M USD), Price (USD/Unit) and Gross Margin (2019-2025)
Table 73. INKAS Military Armored Car SWOT Analysis
Table 74. INKAS Business Overview
Table 75. INKAS Recent Developments
Table 76. Armormax Military Armored Car Basic Information
Table 77. Armormax Military Armored Car Product Overview
Table 78. Armormax Military Armored Car Sales (K Units), Revenue (M USD), Price (USD/Unit) and Gross Margin (2019-2025)
Table 79. Armormax Business Overview
Table 80. Armormax Recent Developments
Table 81. DIMA HOLDINGS Co. Military Armored Car Basic Information
Table 82. DIMA HOLDINGS Co. Military Armored Car Product Overview
Table 83. DIMA HOLDINGS Co. Military Armored Car Sales (K Units), Revenue (M USD), Price (USD/Unit) and Gross Margin (2019-2025)
Table 84. DIMA HOLDINGS Co. Business Overview
Table 85. DIMA HOLDINGS Co. Recent Developments
Table 86. Ltd Military Armored Car Basic Information
Table 87. Ltd Military Armored Car Product Overview
Table 88. Ltd Military Armored Car Sales (K Units), Revenue (M USD), Price (USD/Unit) and Gross Margin (2019-2025)
Table 89. Ltd Business Overview
Table 90. Ltd Recent Developments
Table 91. MSPV Military Armored Car Basic Information
Table 92. MSPV Military Armored Car Product Overview
Table 93. MSPV Military Armored Car Sales (K Units), Revenue (M USD), Price (USD/Unit) and Gross Margin (2019-2025)
Table 94. MSPV Business Overview
Table 95. MSPV Recent Developments
Table 96. Double Star (Shanghai) Military Armored Car Basic Information
Table 97. Double Star (Shanghai) Military Armored Car Product Overview
Table 98. Double Star (Shanghai) Military Armored Car Sales (K Units), Revenue (M USD), Price (USD/Unit) and Gross Margin (2019-2025)
Table 99. Double Star (Shanghai) Business Overview
Table 100. Double Star (Shanghai) Recent Developments
Table 101. JANKEL ARMOURING Military Armored Car Basic Information
Table 102. JANKEL ARMOURING Military Armored Car Product Overview
Table 103. JANKEL ARMOURING Military Armored Car Sales (K Units), Revenue (M USD), Price (USD/Unit) and Gross Margin (2019-2025)
Table 104. JANKEL ARMOURING Business Overview
Table 105. JANKEL ARMOURING Recent Developments
Table 106. The Armored Group Military Armored Car Basic Information
Table 107. The Armored Group Military Armored Car Product Overview
Table 108. The Armored Group Military Armored Car Sales (K Units), Revenue (M USD), Price (USD/Unit) and Gross Margin (2019-2025)
Table 109. The Armored Group Business Overview
Table 110. The Armored Group Recent Developments
Table 111. Shell Armored Vehicles Military Armored Car Basic Information
Table 112. Shell Armored Vehicles Military Armored Car Product Overview
Table 113. Shell Armored Vehicles Military Armored Car Sales (K Units), Revenue (M USD), Price (USD/Unit) and Gross Margin (2019-2025)
Table 114. Shell Armored Vehicles Business Overview
Table 115. Shell Armored Vehicles Recent Developments
Table 116. Alpine Armoring Inc Military Armored Car Basic Information
Table 117. Alpine Armoring Inc Military Armored Car Product Overview
Table 118. Alpine Armoring Inc Military Armored Car Sales (K Units), Revenue (M USD), Price (USD/Unit) and Gross Margin (2019-2025)
Table 119. Alpine Armoring Inc Business Overview
Table 120. Alpine Armoring Inc Recent Developments
Table 121. WELP Armouring Military Armored Car Basic Information
Table 122. WELP Armouring Military Armored Car Product Overview
Table 123. WELP Armouring Military Armored Car Sales (K Units), Revenue (M USD), Price (USD/Unit) and Gross Margin (2019-2025)
Table 124. WELP Armouring Business Overview
Table 125. WELP Armouring Recent Developments
Table 126. JCBL Armouring Solutions Military Armored Car Basic Information
Table 127. JCBL Armouring Solutions Military Armored Car Product Overview
Table 128. JCBL Armouring Solutions Military Armored Car Sales (K Units), Revenue (M USD), Price (USD/Unit) and Gross Margin (2019-2025)
Table 129. JCBL Armouring Solutions Business Overview
Table 130. JCBL Armouring Solutions Recent Developments
Table 131. Global Military Armored Car Sales Forecast by Region (2025-2032) & (K Units)
Table 132. Global Military Armored Car Market Size Forecast by Region (2025-2032) & (M USD)
Table 133. North America Military Armored Car Sales Forecast by Country (2025-2032) & (K Units)
Table 134. North America Military Armored Car Market Size Forecast by Country (2025-2032) & (M USD)
Table 135. Europe Military Armored Car Sales Forecast by Country (2025-2032) & (K Units)
Table 136. Europe Military Armored Car Market Size Forecast by Country (2025-2032) & (M USD)
Table 137. Asia Pacific Military Armored Car Sales Forecast by Region (2025-2032) & (K Units)
Table 138. Asia Pacific Military Armored Car Market Size Forecast by Region (2025-2032) & (M USD)
Table 139. South America Military Armored Car Sales Forecast by Country (2025-2032) & (K Units)
Table 140. South America Military Armored Car Market Size Forecast by Country (2025-2032) & (M USD)
Table 141. Middle East and Africa Military Armored Car Consumption Forecast by Country (2025-2032) & (Units)
Table 142. Middle East and Africa Military Armored Car Market Size Forecast by Country (2025-2032) & (M USD)
Table 143. Global Military Armored Car Sales Forecast by Type (2025-2032) & (K Units)
Table 144. Global Military Armored Car Market Size Forecast by Type (2025-2032) & (M USD)
Table 145. Global Military Armored Car Price Forecast by Type (2025-2032) & (USD/Unit)
Table 146. Global Military Armored Car Sales (K Units) Forecast by Application (2025-2032)
Table 147. Global Military Armored Car Market Size Forecast by Application (2025-2032) & (M USD)
List of Figures
Figure 1. Product Picture of Military Armored Car
Figure 2. Data Triangulation
Figure 3. Key Caveats
Figure 4. Global Motor Vehicle Production (M Units)
Figure 5. Global Military Armored Car Market Size (M USD), 2019-2032
Figure 6. Global Military Armored Car Market Size (M USD) (2019-2032)
Figure 7. Global Military Armored Car Sales (K Units) & (2019-2032)
Figure 8. Evaluation Matrix of Segment Market Development Potential (Type)
Figure 9. Evaluation Matrix of Segment Market Development Potential (Application)
Figure 10. Evaluation Matrix of Regional Market Development Potential
Figure 11. Military Armored Car Market Size by Country (M USD)
Figure 12. Military Armored Car Sales Share by Manufacturers in 2023
Figure 13. Global Military Armored Car Revenue Share by Manufacturers in 2023
Figure 14. Military Armored Car Market Share by Company Type (Tier 1, Tier 2 and Tier 3): 2023
Figure 15. Global Market Military Armored Car Average Price (USD/Unit) of Key Manufacturers in 2023
Figure 16. The Global 5 and 10 Largest Players: Market Share by Military Armored Car Revenue in 2023
Figure 17. Evaluation Matrix of Segment Market Development Potential (Type)
Figure 18. Global Military Armored Car Market Share by Type
Figure 19. Sales Market Share of Military Armored Car by Type (2019-2025)
Figure 20. Sales Market Share of Military Armored Car by Type in 2023
Figure 21. Market Size Share of Military Armored Car by Type (2019-2025)
Figure 22. Market Size Market Share of Military Armored Car by Type in 2023
Figure 23. Evaluation Matrix of Segment Market Development Potential (Application)
Figure 24. Global Military Armored Car Market Share by Application
Figure 25. Global Military Armored Car Sales Market Share by Application (2019-2025)
Figure 26. Global Military Armored Car Sales Market Share by Application in 2023
Figure 27. Global Military Armored Car Market Share by Application (2019-2025)
Figure 28. Global Military Armored Car Market Share by Application in 2023
Figure 29. Global Military Armored Car Sales Growth Rate by Application (2019-2025)
Figure 30. Global Military Armored Car Sales Market Share by Region (2019-2025)
Figure 31. North America Military Armored Car Sales and Growth Rate (2019-2025) & (K Units)
Figure 32. North America Military Armored Car Sales Market Share by Country in 2023
Figure 33. U.S. Military Armored Car Sales and Growth Rate (2019-2025) & (K Units)
Figure 34. Canada Military Armored Car Sales (K Units) and Growth Rate (2019-2025)
Figure 35. Mexico Military Armored Car Sales (Units) and Growth Rate (2019-2025)
Figure 36. Europe Military Armored Car Sales and Growth Rate (2019-2025) & (K Units)
Figure 37. Europe Military Armored Car Sales Market Share by Country in 2023
Figure 38. Germany Military Armored Car Sales and Growth Rate (2019-2025) & (K Units)
Figure 39. France Military Armored Car Sales and Growth Rate (2019-2025) & (K Units)
Figure 40. U.K. Military Armored Car Sales and Growth Rate (2019-2025) & (K Units)
Figure 41. Italy Military Armored Car Sales and Growth Rate (2019-2025) & (K Units)
Figure 42. Russia Military Armored Car Sales and Growth Rate (2019-2025) & (K Units)
Figure 43. Asia Pacific Military Armored Car Sales and Growth Rate (K Units)
Figure 44. Asia Pacific Military Armored Car Sales Market Share by Region in 2023
Figure 45. China Military Armored Car Sales and Growth Rate (2019-2025) & (K Units)
Figure 46. Japan Military Armored Car Sales and Growth Rate (2019-2025) & (K Units)
Figure 47. South Korea Military Armored Car Sales and Growth Rate (2019-2025) & (K Units)
Figure 48. India Military Armored Car Sales and Growth Rate (2019-2025) & (K Units)
Figure 49. Southeast Asia Military Armored Car Sales and Growth Rate (2019-2025) & (K Units)
Figure 50. South America Military Armored Car Sales and Growth Rate (K Units)
Figure 51. South America Military Armored Car Sales Market Share by Country in 2023
Figure 52. Brazil Military Armored Car Sales and Growth Rate (2019-2025) & (K Units)
Figure 53. Argentina Military Armored Car Sales and Growth Rate (2019-2025) & (K Units)
Figure 54. Columbia Military Armored Car Sales and Growth Rate (2019-2025) & (K Units)
Figure 55. Middle East and Africa Military Armored Car Sales and Growth Rate (K Units)
Figure 56. Middle East and Africa Military Armored Car Sales Market Share by Region in 2023
Figure 57. Saudi Arabia Military Armored Car Sales and Growth Rate (2019-2025) & (K Units)
Figure 58. UAE Military Armored Car Sales and Growth Rate (2019-2025) & (K Units)
Figure 59. Egypt Military Armored Car Sales and Growth Rate (2019-2025) & (K Units)
Figure 60. Nigeria Military Armored Car Sales and Growth Rate (2019-2025) & (K Units)
Figure 61. South Africa Military Armored Car Sales and Growth Rate (2019-2025) & (K Units)
Figure 62. Global Military Armored Car Production Market Share by Region (2019-2025)
Figure 63. North America Military Armored Car Production (K Units) Growth Rate (2019-2025)
Figure 64. Europe Military Armored Car Production (K Units) Growth Rate (2019-2025)
Figure 65. Japan Military Armored Car Production (K Units) Growth Rate (2019-2025)
Figure 66. China Military Armored Car Production (K Units) Growth Rate (2019-2025)
Figure 67. Global Military Armored Car Sales Forecast by Volume (2019-2032) & (K Units)
Figure 68. Global Military Armored Car Market Size Forecast by Value (2019-2032) & (M USD)
Figure 69. Global Military Armored Car Sales Market Share Forecast by Type (2025-2032)
Figure 70. Global Military Armored Car Market Share Forecast by Type (2025-2032)
Figure 71. Global Military Armored Car Sales Forecast by Application (2025-2032)
Figure 72. Global Military Armored Car Market Share Forecast by Application (2025-2032)

