Monoclonal antibodies (MABs) are a class of targeted drug therapies designed to recognize and bind to specific proteins found on the surface of cancer cells. These antibodies are crafted in laboratories to mimic the immune system's ability to fight off harmful pathogens such as viruses and bacteria. In the context of cancer treatment, MABs are used to directly target and either kill or inhibit the growth of cancer cells.
Monoclonal antibody drugs for cancer come in various forms, including mouse-derived, chimeric, and humanized antibodies. These therapies have revolutionized cancer treatment by offering more precise and effective options compared to traditional chemotherapy. As a result, the global monoclonal antibody drugs market for cancer has experienced substantial growth.
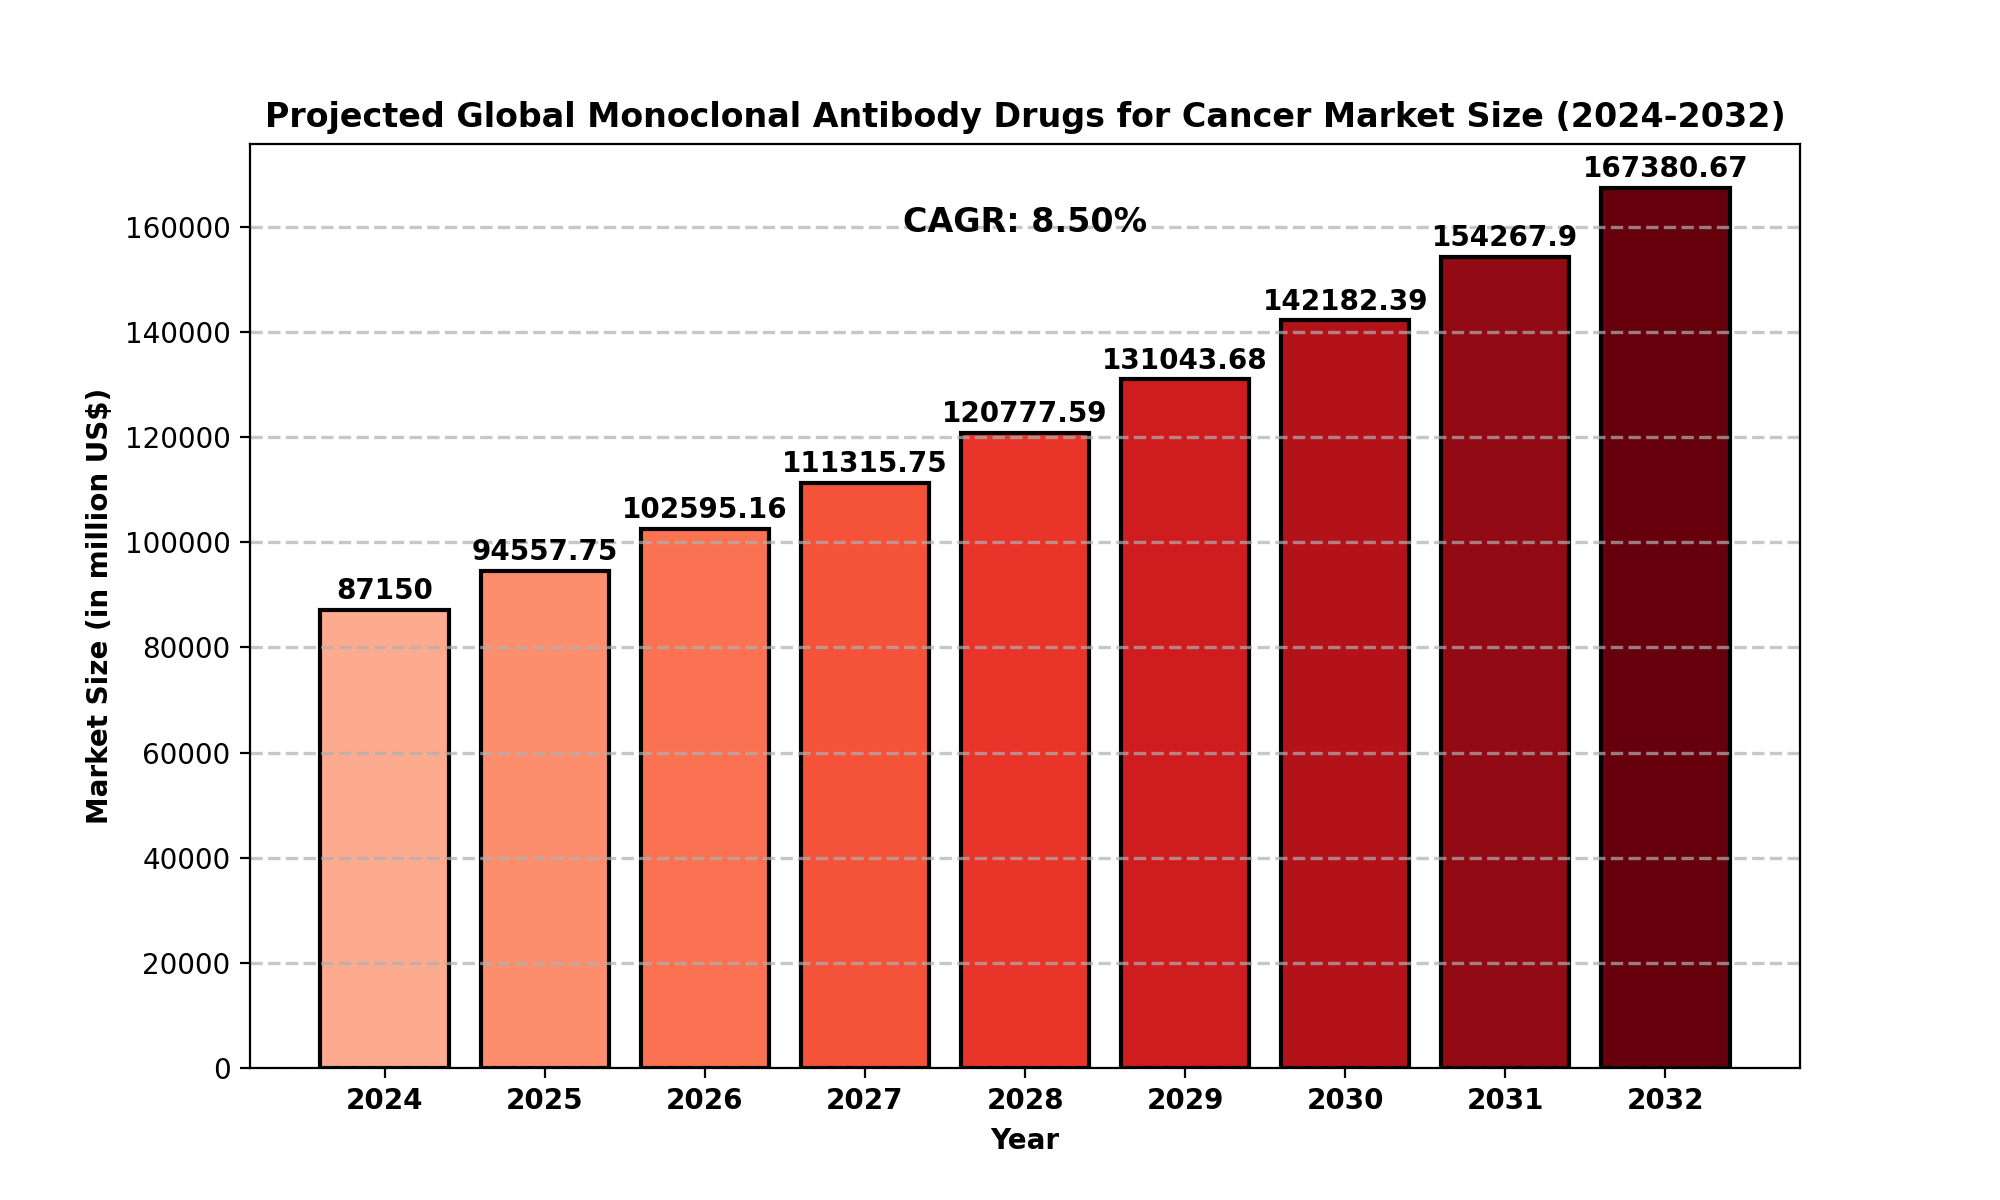
Market Size
The global Monoclonal Antibody Drugs for Cancer Market is valued at approximately USD 87,150 million in 2024. This market is projected to grow significantly, reaching an estimated USD 167,380.67 million by 2032, reflecting a compound annual growth rate (CAGR) of 8.50% during the forecast period.
This growth can be attributed to the increasing prevalence of cancer, technological advancements in drug development, and the rising adoption of monoclonal antibodies in oncology treatments.
In North America, the monoclonal antibody drugs for cancer market is valued at approximately USD 26,138.34 million in 2024. The region is expected to maintain a robust growth trajectory with a CAGR of 7.29% from 2025 to 2032, driven by the strong healthcare infrastructure, continuous research and development (R&D), and favorable regulatory environment.
Market Dynamics
Drivers
Several key factors are driving the growth of the monoclonal antibody drugs for cancer market:
-
Rising Cancer Incidence: The global increase in cancer cases is one of the primary drivers for the demand for effective cancer treatments.
-
Technological Advancements: Continuous innovation in biotechnology and medicine has resulted in more targeted, effective, and less toxic treatments, making monoclonal antibodies an attractive option for oncologists.
-
Enhanced Efficacy and Safety Profiles: Monoclonal antibodies have shown higher success rates with fewer side effects compared to traditional chemotherapy, making them increasingly preferred by patients and healthcare providers.
-
Regulatory Approvals: Ongoing approvals by regulatory bodies such as the FDA and EMA for new monoclonal antibody drugs further fuel the market’s growth.
Restraints
Despite their potential, the monoclonal antibody drugs for cancer market faces several challenges:
-
High Treatment Costs: The high cost of monoclonal antibody drugs remains a significant barrier for widespread adoption, especially in low- and middle-income countries.
-
Complex Manufacturing Process: Producing monoclonal antibodies is a highly complex process, requiring state-of-the-art infrastructure and resulting in increased production costs.
-
Regulatory Hurdles: While the approval process for monoclonal antibodies has accelerated, regulatory delays can still impact market growth, especially for newly developed drugs.
Opportunities
-
Expanding Applications: The use of monoclonal antibodies is expanding beyond oncology into other therapeutic areas such as autoimmune diseases, which presents a significant opportunity for market growth.
-
Personalized Medicine: With advancements in genomics and biomarkers, monoclonal antibodies can be tailored for specific genetic profiles, offering more personalized and effective treatments for cancer patients.
-
Emerging Markets: Increasing healthcare access and improving infrastructure in emerging markets such as Asia-Pacific and Latin America offer new opportunities for growth.
Challenges
-
Drug Resistance: Some cancer cells may develop resistance to monoclonal antibody therapies, posing a challenge in long-term treatment efficacy.
-
Adverse Reactions: Though generally safer than traditional therapies, some patients may still experience severe side effects, limiting the widespread use of these treatments.
Regional Analysis
North America
North America holds a significant share of the global monoclonal antibody drugs for cancer market. The region is expected to maintain a leading position due to well-established healthcare systems, high healthcare spending, and strong R&D activities. The United States, in particular, leads in the development and approval of new monoclonal antibody therapies, with key players such as Johnson & Johnson and Roche driving market growth.
Europe
Europe is another key market for monoclonal antibody drugs, with Germany, the UK, and France being major contributors. The European market is characterized by high healthcare standards, government support for cancer research, and the adoption of cutting-edge therapies.
Asia-Pacific
The Asia-Pacific region is experiencing rapid growth in the monoclonal antibody drugs for cancer market. Countries like China, Japan, and India are seeing increasing cancer rates and an expanding healthcare infrastructure. This has led to growing demand for advanced cancer therapies, including monoclonal antibodies.
South America & MEA
South America and the Middle East & Africa are emerging markets for monoclonal antibody drugs for cancer. While still in the early stages of development, these regions offer vast growth potential due to improving healthcare access and rising awareness of cancer treatments.
Competitor Analysis (Brief)
The monoclonal antibody drugs for cancer market is highly competitive, with several major players leading the industry:
-
Johnson & Johnson: A major player in the market, known for its diverse oncology portfolio, including several monoclonal antibody drugs for cancer.
-
Novartis: Another leader in the market, Novartis has a strong oncology pipeline that includes monoclonal antibodies.
-
Roche: A leading pharmaceutical company with a robust portfolio of cancer drugs, including successful monoclonal antibodies.
-
Amgen: Known for its innovative biologics, Amgen is a significant player in the monoclonal antibody space, particularly in cancer treatment.
Other players include Bristol-Myers Squibb, Gilead Sciences, AstraZeneca, Merck & Co, and more.
Global Monoclonal Antibody Drugs for Cancer Market: Market Segmentation Analysis
This report provides a deep insight into the global monoclonal antibody drugs for cancer market, covering all its essential aspects. This ranges from a macro overview of the market to micro details of the market size, competitive landscape, development trend, niche market, key market drivers and challenges, SWOT analysis, value chain analysis, etc.
The analysis helps the reader shape the competition within the industry and strategies for the competitive environment to enhance potential profit. Furthermore, it provides a simple framework for evaluating and assessing the position of the business organization. The report structure also focuses on the competitive landscape of the Global monoclonal antibody drugs for cancer market. This report introduces in detail the market share, market performance, product situation, operation situation, etc., of the main players, which helps the readers in the industry identify the main competitors and deeply understand the competition pattern of the market.
In a word, this report is a must-read for industry players, investors, researchers, consultants, business strategists, and all those who have any kind of stake or are planning to foray into the monoclonal antibody drugs for cancer market in any manner.
Market Segmentation (by Application)
-
Lung Cancer
-
Breast Cancer
-
Prostate Cancer
-
Blood-related Cancer
-
Other
Market Segmentation (by Type)
-
Mouse-derived Antibodies
-
Chimeric Antibodies
-
Humanized Antibodies
Key Company
-
Johnson & Johnson
-
Novartis
-
Gilead Sciences
-
Roche
-
Bristol-Myers Squibb
-
Amgen
-
AstraZeneca
-
Merck & Co
-
Takeda
-
Merck KGaA
-
Seagen
-
Eli Lilly
-
Ono Pharmaceutical
-
Pfizer
-
Regeneron
-
Innovent
-
Hengrui Medicine
Geographic Segmentation
-
North America (USA, Canada, Mexico)
-
Europe (Germany, UK, France, Russia, Italy, Rest of Europe)
-
Asia-Pacific (China, Japan, South Korea, India, Southeast Asia, Rest of Asia-Pacific)
-
South America (Brazil, Argentina, Columbia, Rest of South America)
-
The Middle East and Africa (Saudi Arabia, UAE, Egypt, Nigeria, South Africa, Rest of MEA)
FAQ
-
What is the current market size of monoclonal antibody drugs for cancer?
-
Which are the key companies operating in the monoclonal antibody drugs for cancer market?
-
Key players include Johnson & Johnson, Novartis, Gilead Sciences, Roche, Bristol-Myers Squibb, Amgen, and several others.
-
What are the key growth drivers in the monoclonal antibody drugs for cancer market?
-
Key drivers include rising cancer incidence, technological advancements in drug development, enhanced efficacy, and regulatory approvals.
-
Which regions dominate the monoclonal antibody drugs for cancer market?
-
What are the emerging trends in the monoclonal antibody drugs for cancer market?
Key Benefits of This Market Research:
- Industry drivers, restraints, and opportunities covered in the study
- Neutral perspective on the market performance
- Recent industry trends and developments
- Competitive landscape & strategies of key players
- Potential & niche segments and regions exhibiting promising growth covered
- Historical, current, and projected market size, in terms of value
- In-depth analysis of the Monoclonal Antibody Drugs for Cancer Market
- Overview of the regional outlook of the Monoclonal Antibody Drugs for Cancer Market:
Key Reasons to Buy this Report:
- Access to date statistics compiled by our researchers. These provide you with historical and forecast data, which is analyzed to tell you why your market is set to change
- This enables you to anticipate market changes to remain ahead of your competitors
- You will be able to copy data from the Excel spreadsheet straight into your marketing plans, business presentations, or other strategic documents
- The concise analysis, clear graph, and table format will enable you to pinpoint the information you require quickly
- Provision of market value data for each segment and sub-segment
- Indicates the region and segment that is expected to witness the fastest growth as well as to dominate the market
- Analysis by geography highlighting the consumption of the product/service in the region as well as indicating the factors that are affecting the market within each region
- Competitive landscape which incorporates the market ranking of the major players, along with new service/product launches, partnerships, business expansions, and acquisitions in the past five years of companies profiled
- Extensive company profiles comprising of company overview, company insights, product benchmarking, and SWOT analysis for the major market players
- The current as well as the future market outlook of the industry concerning recent developments which involve growth opportunities and drivers as well as challenges and restraints of both emerging as well as developed regions
- Includes in-depth analysis of the market from various perspectives through Porter
TABLE OF CONTENTS
Table of Contents
1 Research Methodology and Statistical Scope
1.1 Market Definition and Statistical Scope of Monoclonal Antibody Drugs for Cancer
1.2 Key Market Segments
1.2.1 Monoclonal Antibody Drugs for Cancer Segment by Type
1.2.2 Monoclonal Antibody Drugs for Cancer Segment by Application
1.3 Methodology & Sources of Information
1.3.1 Research Methodology
1.3.2 Research Process
1.3.3 Market Breakdown and Data Triangulation
1.3.4 Base Year
1.3.5 Report Assumptions & Caveats
2 Monoclonal Antibody Drugs for Cancer Market Overview
2.1 Global Market Overview
2.1.1 Global Monoclonal Antibody Drugs for Cancer Market Size (M USD) Estimates and Forecasts (2019-2032)
2.1.2 Global Monoclonal Antibody Drugs for Cancer Sales Estimates and Forecasts (2019-2032)
2.2 Market Segment Executive Summary
2.3 Global Market Size by Region
3 Monoclonal Antibody Drugs for Cancer Market Competitive Landscape
3.1 Global Monoclonal Antibody Drugs for Cancer Sales by Manufacturers (2019-2025)
3.2 Global Monoclonal Antibody Drugs for Cancer Revenue Market Share by Manufacturers (2019-2025)
3.3 Monoclonal Antibody Drugs for Cancer Market Share by Company Type (Tier 1, Tier 2, and Tier 3)
3.4 Global Monoclonal Antibody Drugs for Cancer Average Price by Manufacturers (2019-2025)
3.5 Manufacturers Monoclonal Antibody Drugs for Cancer Sales Sites, Area Served, Product Type
3.6 Monoclonal Antibody Drugs for Cancer Market Competitive Situation and Trends
3.6.1 Monoclonal Antibody Drugs for Cancer Market Concentration Rate
3.6.2 Global 5 and 10 Largest Monoclonal Antibody Drugs for Cancer Players Market Share by Revenue
3.6.3 Mergers & Acquisitions, Expansion
4 Monoclonal Antibody Drugs for Cancer Industry Chain Analysis
4.1 Monoclonal Antibody Drugs for Cancer Industry Chain Analysis
4.2 Market Overview of Key Raw Materials
4.3 Midstream Market Analysis
4.4 Downstream Customer Analysis
5 The Development and Dynamics of Monoclonal Antibody Drugs for Cancer Market
5.1 Key Development Trends
5.2 Driving Factors
5.3 Market Challenges
5.4 Market Restraints
5.5 Industry News
5.5.1 New Product Developments
5.5.2 Mergers & Acquisitions
5.5.3 Expansions
5.5.4 Collaboration/Supply Contracts
5.6 Industry Policies
6 Monoclonal Antibody Drugs for Cancer Market Segmentation by Type
6.1 Evaluation Matrix of Segment Market Development Potential (Type)
6.2 Global Monoclonal Antibody Drugs for Cancer Sales Market Share by Type (2019-2025)
6.3 Global Monoclonal Antibody Drugs for Cancer Market Size Market Share by Type (2019-2025)
6.4 Global Monoclonal Antibody Drugs for Cancer Price by Type (2019-2025)
7 Monoclonal Antibody Drugs for Cancer Market Segmentation by Application
7.1 Evaluation Matrix of Segment Market Development Potential (Application)
7.2 Global Monoclonal Antibody Drugs for Cancer Market Sales by Application (2019-2025)
7.3 Global Monoclonal Antibody Drugs for Cancer Market Size (M USD) by Application (2019-2025)
7.4 Global Monoclonal Antibody Drugs for Cancer Sales Growth Rate by Application (2019-2025)
8 Monoclonal Antibody Drugs for Cancer Market Consumption by Region
8.1 Global Monoclonal Antibody Drugs for Cancer Sales by Region
8.1.1 Global Monoclonal Antibody Drugs for Cancer Sales by Region
8.1.2 Global Monoclonal Antibody Drugs for Cancer Sales Market Share by Region
8.2 North America
8.2.1 North America Monoclonal Antibody Drugs for Cancer Sales by Country
8.2.2 U.S.
8.2.3 Canada
8.2.4 Mexico
8.3 Europe
8.3.1 Europe Monoclonal Antibody Drugs for Cancer Sales by Country
8.3.2 Germany
8.3.3 France
8.3.4 U.K.
8.3.5 Italy
8.3.6 Russia
8.4 Asia Pacific
8.4.1 Asia Pacific Monoclonal Antibody Drugs for Cancer Sales by Region
8.4.2 China
8.4.3 Japan
8.4.4 South Korea
8.4.5 India
8.4.6 Southeast Asia
8.5 South America
8.5.1 South America Monoclonal Antibody Drugs for Cancer Sales by Country
8.5.2 Brazil
8.5.3 Argentina
8.5.4 Columbia
8.6 Middle East and Africa
8.6.1 Middle East and Africa Monoclonal Antibody Drugs for Cancer Sales by Region
8.6.2 Saudi Arabia
8.6.3 UAE
8.6.4 Egypt
8.6.5 Nigeria
8.6.6 South Africa
9 Monoclonal Antibody Drugs for Cancer Market Production by Region
9.1 Global Production of Monoclonal Antibody Drugs for Cancer by Region (2019-2025)
9.2 Global Monoclonal Antibody Drugs for Cancer Revenue Market Share by Region (2019-2025)
9.3 Global Monoclonal Antibody Drugs for Cancer Production, Revenue, Price and Gross Margin (2019-2025)
9.4 North America Monoclonal Antibody Drugs for Cancer Production
9.4.1 North America Monoclonal Antibody Drugs for Cancer Production Growth Rate (2019-2025)
9.4.2 North America Monoclonal Antibody Drugs for Cancer Production, Revenue, Price and Gross Margin (2019-2025)
9.5 Europe Monoclonal Antibody Drugs for Cancer Production
9.5.1 Europe Monoclonal Antibody Drugs for Cancer Production Growth Rate (2019-2025)
9.5.2 Europe Monoclonal Antibody Drugs for Cancer Production, Revenue, Price and Gross Margin (2019-2025)
9.6 Japan Monoclonal Antibody Drugs for Cancer Production (2019-2025)
9.6.1 Japan Monoclonal Antibody Drugs for Cancer Production Growth Rate (2019-2025)
9.6.2 Japan Monoclonal Antibody Drugs for Cancer Production, Revenue, Price and Gross Margin (2019-2025)
9.7 China Monoclonal Antibody Drugs for Cancer Production (2019-2025)
9.7.1 China Monoclonal Antibody Drugs for Cancer Production Growth Rate (2019-2025)
9.7.2 China Monoclonal Antibody Drugs for Cancer Production, Revenue, Price and Gross Margin (2019-2025)
10 Key Companies Profile
10.1 Johnson and Johnson
10.1.1 Johnson and Johnson Monoclonal Antibody Drugs for Cancer Basic Information
10.1.2 Johnson and Johnson Monoclonal Antibody Drugs for Cancer Product Overview
10.1.3 Johnson and Johnson Monoclonal Antibody Drugs for Cancer Product Market Performance
10.1.4 Johnson and Johnson Business Overview
10.1.5 Johnson and Johnson Monoclonal Antibody Drugs for Cancer SWOT Analysis
10.1.6 Johnson and Johnson Recent Developments
10.2 Novartis
10.2.1 Novartis Monoclonal Antibody Drugs for Cancer Basic Information
10.2.2 Novartis Monoclonal Antibody Drugs for Cancer Product Overview
10.2.3 Novartis Monoclonal Antibody Drugs for Cancer Product Market Performance
10.2.4 Novartis Business Overview
10.2.5 Novartis Monoclonal Antibody Drugs for Cancer SWOT Analysis
10.2.6 Novartis Recent Developments
10.3 Gilead Sciences
10.3.1 Gilead Sciences Monoclonal Antibody Drugs for Cancer Basic Information
10.3.2 Gilead Sciences Monoclonal Antibody Drugs for Cancer Product Overview
10.3.3 Gilead Sciences Monoclonal Antibody Drugs for Cancer Product Market Performance
10.3.4 Gilead Sciences Monoclonal Antibody Drugs for Cancer SWOT Analysis
10.3.5 Gilead Sciences Business Overview
10.3.6 Gilead Sciences Recent Developments
10.4 Roche
10.4.1 Roche Monoclonal Antibody Drugs for Cancer Basic Information
10.4.2 Roche Monoclonal Antibody Drugs for Cancer Product Overview
10.4.3 Roche Monoclonal Antibody Drugs for Cancer Product Market Performance
10.4.4 Roche Business Overview
10.4.5 Roche Recent Developments
10.5 Bristol-Myers Squibb
10.5.1 Bristol-Myers Squibb Monoclonal Antibody Drugs for Cancer Basic Information
10.5.2 Bristol-Myers Squibb Monoclonal Antibody Drugs for Cancer Product Overview
10.5.3 Bristol-Myers Squibb Monoclonal Antibody Drugs for Cancer Product Market Performance
10.5.4 Bristol-Myers Squibb Business Overview
10.5.5 Bristol-Myers Squibb Recent Developments
10.6 Amgen
10.6.1 Amgen Monoclonal Antibody Drugs for Cancer Basic Information
10.6.2 Amgen Monoclonal Antibody Drugs for Cancer Product Overview
10.6.3 Amgen Monoclonal Antibody Drugs for Cancer Product Market Performance
10.6.4 Amgen Business Overview
10.6.5 Amgen Recent Developments
10.7 AstraZeneca
10.7.1 AstraZeneca Monoclonal Antibody Drugs for Cancer Basic Information
10.7.2 AstraZeneca Monoclonal Antibody Drugs for Cancer Product Overview
10.7.3 AstraZeneca Monoclonal Antibody Drugs for Cancer Product Market Performance
10.7.4 AstraZeneca Business Overview
10.7.5 AstraZeneca Recent Developments
10.8 Merck and Co
10.8.1 Merck and Co Monoclonal Antibody Drugs for Cancer Basic Information
10.8.2 Merck and Co Monoclonal Antibody Drugs for Cancer Product Overview
10.8.3 Merck and Co Monoclonal Antibody Drugs for Cancer Product Market Performance
10.8.4 Merck and Co Business Overview
10.8.5 Merck and Co Recent Developments
10.9 Takeda
10.9.1 Takeda Monoclonal Antibody Drugs for Cancer Basic Information
10.9.2 Takeda Monoclonal Antibody Drugs for Cancer Product Overview
10.9.3 Takeda Monoclonal Antibody Drugs for Cancer Product Market Performance
10.9.4 Takeda Business Overview
10.9.5 Takeda Recent Developments
10.10 Merck KGaA
10.10.1 Merck KGaA Monoclonal Antibody Drugs for Cancer Basic Information
10.10.2 Merck KGaA Monoclonal Antibody Drugs for Cancer Product Overview
10.10.3 Merck KGaA Monoclonal Antibody Drugs for Cancer Product Market Performance
10.10.4 Merck KGaA Business Overview
10.10.5 Merck KGaA Recent Developments
10.11 Seagen
10.11.1 Seagen Monoclonal Antibody Drugs for Cancer Basic Information
10.11.2 Seagen Monoclonal Antibody Drugs for Cancer Product Overview
10.11.3 Seagen Monoclonal Antibody Drugs for Cancer Product Market Performance
10.11.4 Seagen Business Overview
10.11.5 Seagen Recent Developments
10.12 Eli Lilly
10.12.1 Eli Lilly Monoclonal Antibody Drugs for Cancer Basic Information
10.12.2 Eli Lilly Monoclonal Antibody Drugs for Cancer Product Overview
10.12.3 Eli Lilly Monoclonal Antibody Drugs for Cancer Product Market Performance
10.12.4 Eli Lilly Business Overview
10.12.5 Eli Lilly Recent Developments
10.13 Ono Pharmaceutical
10.13.1 Ono Pharmaceutical Monoclonal Antibody Drugs for Cancer Basic Information
10.13.2 Ono Pharmaceutical Monoclonal Antibody Drugs for Cancer Product Overview
10.13.3 Ono Pharmaceutical Monoclonal Antibody Drugs for Cancer Product Market Performance
10.13.4 Ono Pharmaceutical Business Overview
10.13.5 Ono Pharmaceutical Recent Developments
10.14 Pfizer
10.14.1 Pfizer Monoclonal Antibody Drugs for Cancer Basic Information
10.14.2 Pfizer Monoclonal Antibody Drugs for Cancer Product Overview
10.14.3 Pfizer Monoclonal Antibody Drugs for Cancer Product Market Performance
10.14.4 Pfizer Business Overview
10.14.5 Pfizer Recent Developments
10.15 Regeneron
10.15.1 Regeneron Monoclonal Antibody Drugs for Cancer Basic Information
10.15.2 Regeneron Monoclonal Antibody Drugs for Cancer Product Overview
10.15.3 Regeneron Monoclonal Antibody Drugs for Cancer Product Market Performance
10.15.4 Regeneron Business Overview
10.15.5 Regeneron Recent Developments
10.16 Innovent
10.16.1 Innovent Monoclonal Antibody Drugs for Cancer Basic Information
10.16.2 Innovent Monoclonal Antibody Drugs for Cancer Product Overview
10.16.3 Innovent Monoclonal Antibody Drugs for Cancer Product Market Performance
10.16.4 Innovent Business Overview
10.16.5 Innovent Recent Developments
10.17 Hengrui Medicine
10.17.1 Hengrui Medicine Monoclonal Antibody Drugs for Cancer Basic Information
10.17.2 Hengrui Medicine Monoclonal Antibody Drugs for Cancer Product Overview
10.17.3 Hengrui Medicine Monoclonal Antibody Drugs for Cancer Product Market Performance
10.17.4 Hengrui Medicine Business Overview
10.17.5 Hengrui Medicine Recent Developments
11 Monoclonal Antibody Drugs for Cancer Market Forecast by Region
11.1 Global Monoclonal Antibody Drugs for Cancer Market Size Forecast
11.2 Global Monoclonal Antibody Drugs for Cancer Market Forecast by Region
11.2.1 North America Market Size Forecast by Country
11.2.2 Europe Monoclonal Antibody Drugs for Cancer Market Size Forecast by Country
11.2.3 Asia Pacific Monoclonal Antibody Drugs for Cancer Market Size Forecast by Region
11.2.4 South America Monoclonal Antibody Drugs for Cancer Market Size Forecast by Country
11.2.5 Middle East and Africa Forecasted Consumption of Monoclonal Antibody Drugs for Cancer by Country
12 Forecast Market by Type and by Application (2025-2032)
12.1 Global Monoclonal Antibody Drugs for Cancer Market Forecast by Type (2025-2032)
12.1.1 Global Forecasted Sales of Monoclonal Antibody Drugs for Cancer by Type (2025-2032)
12.1.2 Global Monoclonal Antibody Drugs for Cancer Market Size Forecast by Type (2025-2032)
12.1.3 Global Forecasted Price of Monoclonal Antibody Drugs for Cancer by Type (2025-2032)
12.2 Global Monoclonal Antibody Drugs for Cancer Market Forecast by Application (2025-2032)
12.2.1 Global Monoclonal Antibody Drugs for Cancer Sales (K MT) Forecast by Application
12.2.2 Global Monoclonal Antibody Drugs for Cancer Market Size (M USD) Forecast by Application (2025-2032)
13 Conclusion and Key Findings
LIST OF TABLES & FIGURES
List of Tables
Table 1. Introduction of the Type
Table 2. Introduction of the Application
Table 3. Market Size (M USD) Segment Executive Summary
Table 4. Monoclonal Antibody Drugs for Cancer Market Size Comparison by Region (M USD)
Table 5. Global Monoclonal Antibody Drugs for Cancer Sales (K MT) by Manufacturers (2019-2025)
Table 6. Global Monoclonal Antibody Drugs for Cancer Sales Market Share by Manufacturers (2019-2025)
Table 7. Global Monoclonal Antibody Drugs for Cancer Revenue (M USD) by Manufacturers (2019-2025)
Table 8. Global Monoclonal Antibody Drugs for Cancer Revenue Share by Manufacturers (2019-2025)
Table 9. Company Type (Tier 1, Tier 2, and Tier 3) & (based on the Revenue in Monoclonal Antibody Drugs for Cancer as of 2022)
Table 10. Global Market Monoclonal Antibody Drugs for Cancer Average Price (USD/MT) of Key Manufacturers (2019-2025)
Table 11. Manufacturers Monoclonal Antibody Drugs for Cancer Sales Sites and Area Served
Table 12. Manufacturers Monoclonal Antibody Drugs for Cancer Product Type
Table 13. Global Monoclonal Antibody Drugs for Cancer Manufacturers Market Concentration Ratio (CR5 and HHI)
Table 14. Mergers & Acquisitions, Expansion Plans
Table 15. Industry Chain Map of Monoclonal Antibody Drugs for Cancer
Table 16. Market Overview of Key Raw Materials
Table 17. Midstream Market Analysis
Table 18. Downstream Customer Analysis
Table 19. Key Development Trends
Table 20. Driving Factors
Table 21. Monoclonal Antibody Drugs for Cancer Market Challenges
Table 22. Global Monoclonal Antibody Drugs for Cancer Sales by Type (K MT)
Table 23. Global Monoclonal Antibody Drugs for Cancer Market Size by Type (M USD)
Table 24. Global Monoclonal Antibody Drugs for Cancer Sales (K MT) by Type (2019-2025)
Table 25. Global Monoclonal Antibody Drugs for Cancer Sales Market Share by Type (2019-2025)
Table 26. Global Monoclonal Antibody Drugs for Cancer Market Size (M USD) by Type (2019-2025)
Table 27. Global Monoclonal Antibody Drugs for Cancer Market Size Share by Type (2019-2025)
Table 28. Global Monoclonal Antibody Drugs for Cancer Price (USD/MT) by Type (2019-2025)
Table 29. Global Monoclonal Antibody Drugs for Cancer Sales (K MT) by Application
Table 30. Global Monoclonal Antibody Drugs for Cancer Market Size by Application
Table 31. Global Monoclonal Antibody Drugs for Cancer Sales by Application (2019-2025) & (K MT)
Table 32. Global Monoclonal Antibody Drugs for Cancer Sales Market Share by Application (2019-2025)
Table 33. Global Monoclonal Antibody Drugs for Cancer Sales by Application (2019-2025) & (M USD)
Table 34. Global Monoclonal Antibody Drugs for Cancer Market Share by Application (2019-2025)
Table 35. Global Monoclonal Antibody Drugs for Cancer Sales Growth Rate by Application (2019-2025)
Table 36. Global Monoclonal Antibody Drugs for Cancer Sales by Region (2019-2025) & (K MT)
Table 37. Global Monoclonal Antibody Drugs for Cancer Sales Market Share by Region (2019-2025)
Table 38. North America Monoclonal Antibody Drugs for Cancer Sales by Country (2019-2025) & (K MT)
Table 39. Europe Monoclonal Antibody Drugs for Cancer Sales by Country (2019-2025) & (K MT)
Table 40. Asia Pacific Monoclonal Antibody Drugs for Cancer Sales by Region (2019-2025) & (K MT)
Table 41. South America Monoclonal Antibody Drugs for Cancer Sales by Country (2019-2025) & (K MT)
Table 42. Middle East and Africa Monoclonal Antibody Drugs for Cancer Sales by Region (2019-2025) & (K MT)
Table 43. Global Monoclonal Antibody Drugs for Cancer Production (K MT) by Region (2019-2025)
Table 44. Global Monoclonal Antibody Drugs for Cancer Revenue (US$ Million) by Region (2019-2025)
Table 45. Global Monoclonal Antibody Drugs for Cancer Revenue Market Share by Region (2019-2025)
Table 46. Global Monoclonal Antibody Drugs for Cancer Production (K MT), Revenue (US$ Million), Price (USD/MT) and Gross Margin (2019-2025)
Table 47. North America Monoclonal Antibody Drugs for Cancer Production (K MT), Revenue (US$ Million), Price (USD/MT) and Gross Margin (2019-2025)
Table 48. Europe Monoclonal Antibody Drugs for Cancer Production (K MT), Revenue (US$ Million), Price (USD/MT) and Gross Margin (2019-2025)
Table 49. Japan Monoclonal Antibody Drugs for Cancer Production (K MT), Revenue (US$ Million), Price (USD/MT) and Gross Margin (2019-2025)
Table 50. China Monoclonal Antibody Drugs for Cancer Production (K MT), Revenue (US$ Million), Price (USD/MT) and Gross Margin (2019-2025)
Table 51. Johnson and Johnson Monoclonal Antibody Drugs for Cancer Basic Information
Table 52. Johnson and Johnson Monoclonal Antibody Drugs for Cancer Product Overview
Table 53. Johnson and Johnson Monoclonal Antibody Drugs for Cancer Sales (K MT), Revenue (M USD), Price (USD/MT) and Gross Margin (2019-2025)
Table 54. Johnson and Johnson Business Overview
Table 55. Johnson and Johnson Monoclonal Antibody Drugs for Cancer SWOT Analysis
Table 56. Johnson and Johnson Recent Developments
Table 57. Novartis Monoclonal Antibody Drugs for Cancer Basic Information
Table 58. Novartis Monoclonal Antibody Drugs for Cancer Product Overview
Table 59. Novartis Monoclonal Antibody Drugs for Cancer Sales (K MT), Revenue (M USD), Price (USD/MT) and Gross Margin (2019-2025)
Table 60. Novartis Business Overview
Table 61. Novartis Monoclonal Antibody Drugs for Cancer SWOT Analysis
Table 62. Novartis Recent Developments
Table 63. Gilead Sciences Monoclonal Antibody Drugs for Cancer Basic Information
Table 64. Gilead Sciences Monoclonal Antibody Drugs for Cancer Product Overview
Table 65. Gilead Sciences Monoclonal Antibody Drugs for Cancer Sales (K MT), Revenue (M USD), Price (USD/MT) and Gross Margin (2019-2025)
Table 66. Gilead Sciences Monoclonal Antibody Drugs for Cancer SWOT Analysis
Table 67. Gilead Sciences Business Overview
Table 68. Gilead Sciences Recent Developments
Table 69. Roche Monoclonal Antibody Drugs for Cancer Basic Information
Table 70. Roche Monoclonal Antibody Drugs for Cancer Product Overview
Table 71. Roche Monoclonal Antibody Drugs for Cancer Sales (K MT), Revenue (M USD), Price (USD/MT) and Gross Margin (2019-2025)
Table 72. Roche Business Overview
Table 73. Roche Recent Developments
Table 74. Bristol-Myers Squibb Monoclonal Antibody Drugs for Cancer Basic Information
Table 75. Bristol-Myers Squibb Monoclonal Antibody Drugs for Cancer Product Overview
Table 76. Bristol-Myers Squibb Monoclonal Antibody Drugs for Cancer Sales (K MT), Revenue (M USD), Price (USD/MT) and Gross Margin (2019-2025)
Table 77. Bristol-Myers Squibb Business Overview
Table 78. Bristol-Myers Squibb Recent Developments
Table 79. Amgen Monoclonal Antibody Drugs for Cancer Basic Information
Table 80. Amgen Monoclonal Antibody Drugs for Cancer Product Overview
Table 81. Amgen Monoclonal Antibody Drugs for Cancer Sales (K MT), Revenue (M USD), Price (USD/MT) and Gross Margin (2019-2025)
Table 82. Amgen Business Overview
Table 83. Amgen Recent Developments
Table 84. AstraZeneca Monoclonal Antibody Drugs for Cancer Basic Information
Table 85. AstraZeneca Monoclonal Antibody Drugs for Cancer Product Overview
Table 86. AstraZeneca Monoclonal Antibody Drugs for Cancer Sales (K MT), Revenue (M USD), Price (USD/MT) and Gross Margin (2019-2025)
Table 87. AstraZeneca Business Overview
Table 88. AstraZeneca Recent Developments
Table 89. Merck and Co Monoclonal Antibody Drugs for Cancer Basic Information
Table 90. Merck and Co Monoclonal Antibody Drugs for Cancer Product Overview
Table 91. Merck and Co Monoclonal Antibody Drugs for Cancer Sales (K MT), Revenue (M USD), Price (USD/MT) and Gross Margin (2019-2025)
Table 92. Merck and Co Business Overview
Table 93. Merck and Co Recent Developments
Table 94. Takeda Monoclonal Antibody Drugs for Cancer Basic Information
Table 95. Takeda Monoclonal Antibody Drugs for Cancer Product Overview
Table 96. Takeda Monoclonal Antibody Drugs for Cancer Sales (K MT), Revenue (M USD), Price (USD/MT) and Gross Margin (2019-2025)
Table 97. Takeda Business Overview
Table 98. Takeda Recent Developments
Table 99. Merck KGaA Monoclonal Antibody Drugs for Cancer Basic Information
Table 100. Merck KGaA Monoclonal Antibody Drugs for Cancer Product Overview
Table 101. Merck KGaA Monoclonal Antibody Drugs for Cancer Sales (K MT), Revenue (M USD), Price (USD/MT) and Gross Margin (2019-2025)
Table 102. Merck KGaA Business Overview
Table 103. Merck KGaA Recent Developments
Table 104. Seagen Monoclonal Antibody Drugs for Cancer Basic Information
Table 105. Seagen Monoclonal Antibody Drugs for Cancer Product Overview
Table 106. Seagen Monoclonal Antibody Drugs for Cancer Sales (K MT), Revenue (M USD), Price (USD/MT) and Gross Margin (2019-2025)
Table 107. Seagen Business Overview
Table 108. Seagen Recent Developments
Table 109. Eli Lilly Monoclonal Antibody Drugs for Cancer Basic Information
Table 110. Eli Lilly Monoclonal Antibody Drugs for Cancer Product Overview
Table 111. Eli Lilly Monoclonal Antibody Drugs for Cancer Sales (K MT), Revenue (M USD), Price (USD/MT) and Gross Margin (2019-2025)
Table 112. Eli Lilly Business Overview
Table 113. Eli Lilly Recent Developments
Table 114. Ono Pharmaceutical Monoclonal Antibody Drugs for Cancer Basic Information
Table 115. Ono Pharmaceutical Monoclonal Antibody Drugs for Cancer Product Overview
Table 116. Ono Pharmaceutical Monoclonal Antibody Drugs for Cancer Sales (K MT), Revenue (M USD), Price (USD/MT) and Gross Margin (2019-2025)
Table 117. Ono Pharmaceutical Business Overview
Table 118. Ono Pharmaceutical Recent Developments
Table 119. Pfizer Monoclonal Antibody Drugs for Cancer Basic Information
Table 120. Pfizer Monoclonal Antibody Drugs for Cancer Product Overview
Table 121. Pfizer Monoclonal Antibody Drugs for Cancer Sales (K MT), Revenue (M USD), Price (USD/MT) and Gross Margin (2019-2025)
Table 122. Pfizer Business Overview
Table 123. Pfizer Recent Developments
Table 124. Regeneron Monoclonal Antibody Drugs for Cancer Basic Information
Table 125. Regeneron Monoclonal Antibody Drugs for Cancer Product Overview
Table 126. Regeneron Monoclonal Antibody Drugs for Cancer Sales (K MT), Revenue (M USD), Price (USD/MT) and Gross Margin (2019-2025)
Table 127. Regeneron Business Overview
Table 128. Regeneron Recent Developments
Table 129. Innovent Monoclonal Antibody Drugs for Cancer Basic Information
Table 130. Innovent Monoclonal Antibody Drugs for Cancer Product Overview
Table 131. Innovent Monoclonal Antibody Drugs for Cancer Sales (K MT), Revenue (M USD), Price (USD/MT) and Gross Margin (2019-2025)
Table 132. Innovent Business Overview
Table 133. Innovent Recent Developments
Table 134. Hengrui Medicine Monoclonal Antibody Drugs for Cancer Basic Information
Table 135. Hengrui Medicine Monoclonal Antibody Drugs for Cancer Product Overview
Table 136. Hengrui Medicine Monoclonal Antibody Drugs for Cancer Sales (K MT), Revenue (M USD), Price (USD/MT) and Gross Margin (2019-2025)
Table 137. Hengrui Medicine Business Overview
Table 138. Hengrui Medicine Recent Developments
Table 139. Global Monoclonal Antibody Drugs for Cancer Sales Forecast by Region (2025-2032) & (K MT)
Table 140. Global Monoclonal Antibody Drugs for Cancer Market Size Forecast by Region (2025-2032) & (M USD)
Table 141. North America Monoclonal Antibody Drugs for Cancer Sales Forecast by Country (2025-2032) & (K MT)
Table 142. North America Monoclonal Antibody Drugs for Cancer Market Size Forecast by Country (2025-2032) & (M USD)
Table 143. Europe Monoclonal Antibody Drugs for Cancer Sales Forecast by Country (2025-2032) & (K MT)
Table 144. Europe Monoclonal Antibody Drugs for Cancer Market Size Forecast by Country (2025-2032) & (M USD)
Table 145. Asia Pacific Monoclonal Antibody Drugs for Cancer Sales Forecast by Region (2025-2032) & (K MT)
Table 146. Asia Pacific Monoclonal Antibody Drugs for Cancer Market Size Forecast by Region (2025-2032) & (M USD)
Table 147. South America Monoclonal Antibody Drugs for Cancer Sales Forecast by Country (2025-2032) & (K MT)
Table 148. South America Monoclonal Antibody Drugs for Cancer Market Size Forecast by Country (2025-2032) & (M USD)
Table 149. Middle East and Africa Monoclonal Antibody Drugs for Cancer Consumption Forecast by Country (2025-2032) & (Units)
Table 150. Middle East and Africa Monoclonal Antibody Drugs for Cancer Market Size Forecast by Country (2025-2032) & (M USD)
Table 151. Global Monoclonal Antibody Drugs for Cancer Sales Forecast by Type (2025-2032) & (K MT)
Table 152. Global Monoclonal Antibody Drugs for Cancer Market Size Forecast by Type (2025-2032) & (M USD)
Table 153. Global Monoclonal Antibody Drugs for Cancer Price Forecast by Type (2025-2032) & (USD/MT)
Table 154. Global Monoclonal Antibody Drugs for Cancer Sales (K MT) Forecast by Application (2025-2032)
Table 155. Global Monoclonal Antibody Drugs for Cancer Market Size Forecast by Application (2025-2032) & (M USD)
List of Figures
Figure 1. Product Picture of Monoclonal Antibody Drugs for Cancer
Figure 2. Data Triangulation
Figure 3. Key Caveats
Figure 4. Global Monoclonal Antibody Drugs for Cancer Market Size (M USD), 2019-2032
Figure 5. Global Monoclonal Antibody Drugs for Cancer Market Size (M USD) (2019-2032)
Figure 6. Global Monoclonal Antibody Drugs for Cancer Sales (K MT) & (2019-2032)
Figure 7. Evaluation Matrix of Segment Market Development Potential (Type)
Figure 8. Evaluation Matrix of Segment Market Development Potential (Application)
Figure 9. Evaluation Matrix of Regional Market Development Potential
Figure 10. Monoclonal Antibody Drugs for Cancer Market Size by Country (M USD)
Figure 11. Monoclonal Antibody Drugs for Cancer Sales Share by Manufacturers in 2023
Figure 12. Global Monoclonal Antibody Drugs for Cancer Revenue Share by Manufacturers in 2023
Figure 13. Monoclonal Antibody Drugs for Cancer Market Share by Company Type (Tier 1, Tier 2 and Tier 3): 2023
Figure 14. Global Market Monoclonal Antibody Drugs for Cancer Average Price (USD/MT) of Key Manufacturers in 2023
Figure 15. The Global 5 and 10 Largest Players: Market Share by Monoclonal Antibody Drugs for Cancer Revenue in 2023
Figure 16. Evaluation Matrix of Segment Market Development Potential (Type)
Figure 17. Global Monoclonal Antibody Drugs for Cancer Market Share by Type
Figure 18. Sales Market Share of Monoclonal Antibody Drugs for Cancer by Type (2019-2025)
Figure 19. Sales Market Share of Monoclonal Antibody Drugs for Cancer by Type in 2023
Figure 20. Market Size Share of Monoclonal Antibody Drugs for Cancer by Type (2019-2025)
Figure 21. Market Size Market Share of Monoclonal Antibody Drugs for Cancer by Type in 2023
Figure 22. Evaluation Matrix of Segment Market Development Potential (Application)
Figure 23. Global Monoclonal Antibody Drugs for Cancer Market Share by Application
Figure 24. Global Monoclonal Antibody Drugs for Cancer Sales Market Share by Application (2019-2025)
Figure 25. Global Monoclonal Antibody Drugs for Cancer Sales Market Share by Application in 2023
Figure 26. Global Monoclonal Antibody Drugs for Cancer Market Share by Application (2019-2025)
Figure 27. Global Monoclonal Antibody Drugs for Cancer Market Share by Application in 2023
Figure 28. Global Monoclonal Antibody Drugs for Cancer Sales Growth Rate by Application (2019-2025)
Figure 29. Global Monoclonal Antibody Drugs for Cancer Sales Market Share by Region (2019-2025)
Figure 30. North America Monoclonal Antibody Drugs for Cancer Sales and Growth Rate (2019-2025) & (K MT)
Figure 31. North America Monoclonal Antibody Drugs for Cancer Sales Market Share by Country in 2023
Figure 32. U.S. Monoclonal Antibody Drugs for Cancer Sales and Growth Rate (2019-2025) & (K MT)
Figure 33. Canada Monoclonal Antibody Drugs for Cancer Sales (K MT) and Growth Rate (2019-2025)
Figure 34. Mexico Monoclonal Antibody Drugs for Cancer Sales (Units) and Growth Rate (2019-2025)
Figure 35. Europe Monoclonal Antibody Drugs for Cancer Sales and Growth Rate (2019-2025) & (K MT)
Figure 36. Europe Monoclonal Antibody Drugs for Cancer Sales Market Share by Country in 2023
Figure 37. Germany Monoclonal Antibody Drugs for Cancer Sales and Growth Rate (2019-2025) & (K MT)
Figure 38. France Monoclonal Antibody Drugs for Cancer Sales and Growth Rate (2019-2025) & (K MT)
Figure 39. U.K. Monoclonal Antibody Drugs for Cancer Sales and Growth Rate (2019-2025) & (K MT)
Figure 40. Italy Monoclonal Antibody Drugs for Cancer Sales and Growth Rate (2019-2025) & (K MT)
Figure 41. Russia Monoclonal Antibody Drugs for Cancer Sales and Growth Rate (2019-2025) & (K MT)
Figure 42. Asia Pacific Monoclonal Antibody Drugs for Cancer Sales and Growth Rate (K MT)
Figure 43. Asia Pacific Monoclonal Antibody Drugs for Cancer Sales Market Share by Region in 2023
Figure 44. China Monoclonal Antibody Drugs for Cancer Sales and Growth Rate (2019-2025) & (K MT)
Figure 45. Japan Monoclonal Antibody Drugs for Cancer Sales and Growth Rate (2019-2025) & (K MT)
Figure 46. South Korea Monoclonal Antibody Drugs for Cancer Sales and Growth Rate (2019-2025) & (K MT)
Figure 47. India Monoclonal Antibody Drugs for Cancer Sales and Growth Rate (2019-2025) & (K MT)
Figure 48. Southeast Asia Monoclonal Antibody Drugs for Cancer Sales and Growth Rate (2019-2025) & (K MT)
Figure 49. South America Monoclonal Antibody Drugs for Cancer Sales and Growth Rate (K MT)
Figure 50. South America Monoclonal Antibody Drugs for Cancer Sales Market Share by Country in 2023
Figure 51. Brazil Monoclonal Antibody Drugs for Cancer Sales and Growth Rate (2019-2025) & (K MT)
Figure 52. Argentina Monoclonal Antibody Drugs for Cancer Sales and Growth Rate (2019-2025) & (K MT)
Figure 53. Columbia Monoclonal Antibody Drugs for Cancer Sales and Growth Rate (2019-2025) & (K MT)
Figure 54. Middle East and Africa Monoclonal Antibody Drugs for Cancer Sales and Growth Rate (K MT)
Figure 55. Middle East and Africa Monoclonal Antibody Drugs for Cancer Sales Market Share by Region in 2023
Figure 56. Saudi Arabia Monoclonal Antibody Drugs for Cancer Sales and Growth Rate (2019-2025) & (K MT)
Figure 57. UAE Monoclonal Antibody Drugs for Cancer Sales and Growth Rate (2019-2025) & (K MT)
Figure 58. Egypt Monoclonal Antibody Drugs for Cancer Sales and Growth Rate (2019-2025) & (K MT)
Figure 59. Nigeria Monoclonal Antibody Drugs for Cancer Sales and Growth Rate (2019-2025) & (K MT)
Figure 60. South Africa Monoclonal Antibody Drugs for Cancer Sales and Growth Rate (2019-2025) & (K MT)
Figure 61. Global Monoclonal Antibody Drugs for Cancer Production Market Share by Region (2019-2025)
Figure 62. North America Monoclonal Antibody Drugs for Cancer Production (K MT) Growth Rate (2019-2025)
Figure 63. Europe Monoclonal Antibody Drugs for Cancer Production (K MT) Growth Rate (2019-2025)
Figure 64. Japan Monoclonal Antibody Drugs for Cancer Production (K MT) Growth Rate (2019-2025)
Figure 65. China Monoclonal Antibody Drugs for Cancer Production (K MT) Growth Rate (2019-2025)
Figure 66. Global Monoclonal Antibody Drugs for Cancer Sales Forecast by Volume (2019-2032) & (K MT)
Figure 67. Global Monoclonal Antibody Drugs for Cancer Market Size Forecast by Value (2019-2032) & (M USD)
Figure 68. Global Monoclonal Antibody Drugs for Cancer Sales Market Share Forecast by Type (2025-2032)
Figure 69. Global Monoclonal Antibody Drugs for Cancer Market Share Forecast by Type (2025-2032)
Figure 70. Global Monoclonal Antibody Drugs for Cancer Sales Forecast by Application (2025-2032)
Figure 71. Global Monoclonal Antibody Drugs for Cancer Market Share Forecast by Application (2025-2032)

