Nanocrystalline materials are advanced crystalline materials characterized by their particle size, which ranges from 1 to 100 nanometers. Their unique microstructure and size effect confer exceptional physical, chemical, and mechanical properties, making them highly versatile and valuable across various applications. Specifically, in the field of new energy vehicles (NEVs), nanocrystalline materials are indispensable due to their superior magnetic and electrical properties. They play a pivotal role in motors, inductors, transformers, and wireless charging systems, significantly enhancing the performance of power transmission and energy conversion components.
Market Size
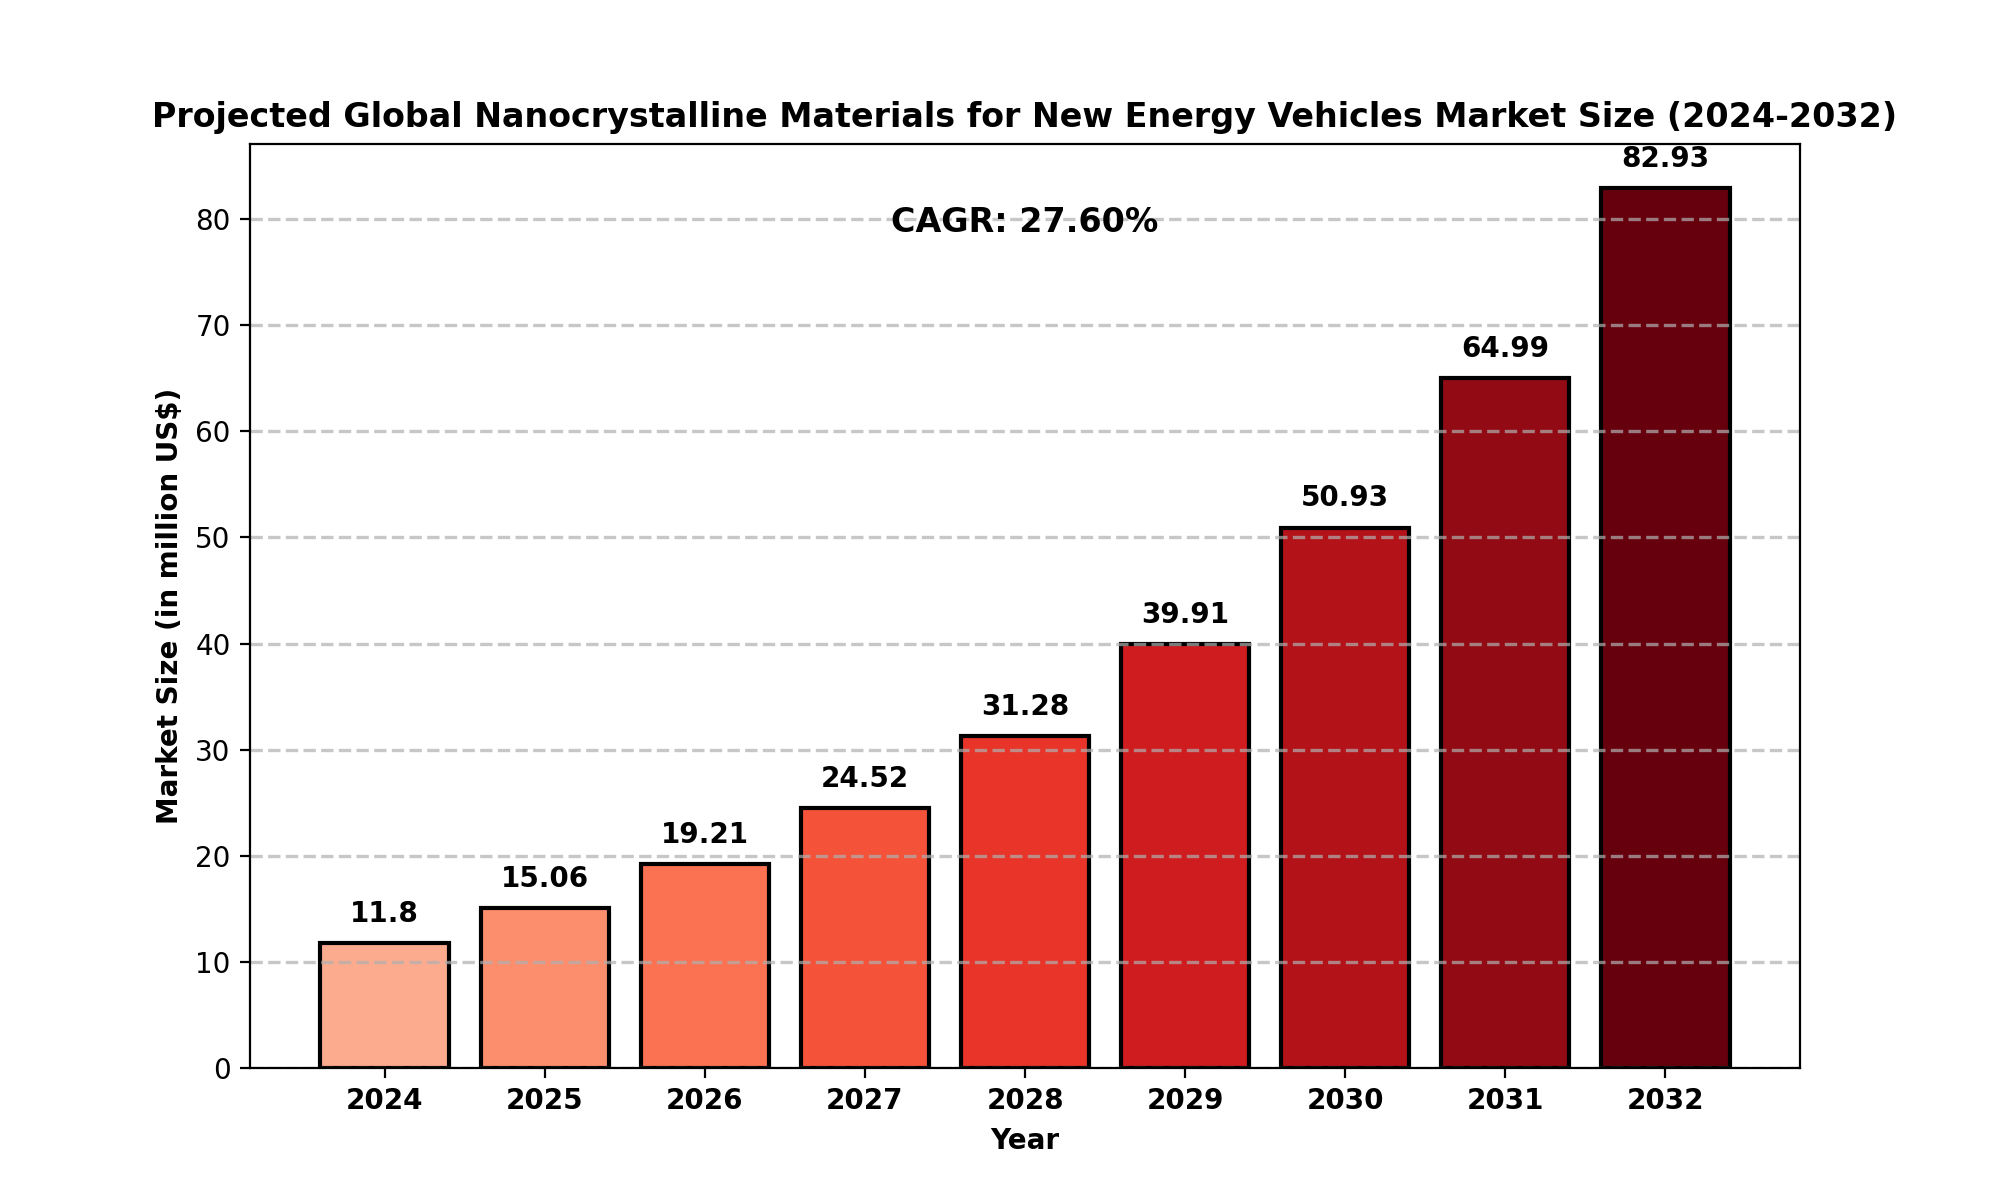
The global Nanocrystalline Materials for New Energy Vehicles Market was estimated at USD 11.80 million in 2024 and is projected to surge to USD 82.93 million by 2032, reflecting an impressive compound annual growth rate (CAGR) of 27.60% during the forecast period.
In North America alone, the market size was valued at USD 4.70 million in 2024, with a projected CAGR of 23.66% between 2025 and 2032.
These growth figures underscore the increasing adoption of nanocrystalline materials as NEV technologies advance and the global push towards sustainable energy solutions accelerates. The expansion of electric vehicle production, coupled with continuous innovations in material science, will further propel this market.
Market Dynamics (Drivers, Restraints, Opportunities, and Challenges)
Drivers
-
Advancements in Electric Vehicle Technologies: As the demand for efficient and high-performing electric vehicles rises, the superior magnetic and electrical properties of nanocrystalline materials are becoming increasingly vital in powertrain components.
-
Sustainability Goals: Governments and industries worldwide are striving to reduce carbon footprints, driving the adoption of NEVs and, consequently, the materials that enhance their performance.
-
Technological Innovations: Continuous research in material science is unlocking new potential applications for nanocrystalline materials, expanding their utility beyond traditional uses.
Restraints
-
High Production Costs: The manufacturing processes for nanocrystalline materials remain expensive, posing a significant barrier to mass adoption.
-
Limited Awareness: Despite their benefits, many industries lack awareness of the advantages offered by nanocrystalline materials, particularly in emerging markets.
Opportunities
-
Expansion into Emerging Markets: Rapid industrialization and the growing adoption of electric vehicles in regions such as Asia-Pacific and South America present untapped opportunities for market growth.
-
Integration with Renewable Energy Systems: Beyond NEVs, nanocrystalline materials hold potential in renewable energy applications, such as solar power inverters and wind turbines.
Challenges
-
Complex Manufacturing Processes: Producing nanocrystalline materials with consistent quality and properties is technically challenging.
-
Supply Chain Constraints: Dependence on raw material availability and geopolitical factors can disrupt the supply chain.
Regional Analysis
North America
North America, with an estimated market size of USD 4.70 million in 2024, is expected to witness substantial growth due to robust government support for clean energy initiatives and advancements in NEV technologies. The United States leads the region, driven by high R&D investments and the presence of major automotive players.
Europe
Europe is poised for significant growth, driven by stringent emissions regulations and the region’s strong commitment to electrification. Countries like Germany, the UK, and France are at the forefront of adopting nanocrystalline materials in NEV components.
Asia-Pacific
Asia-Pacific dominates the market, led by China’s massive NEV production capacity and strong government incentives. Japan and South Korea also contribute significantly due to their advanced automotive and electronics industries.
South America and MEA
South America and the Middle East & Africa (MEA) are emerging markets, where growing NEV adoption and industrialization are expected to drive demand for nanocrystalline materials.
Competitor Analysis
Key Companies
-
Proterial
-
Bomatec
-
Vacuumschmelze
-
Qingdao Yunlu Advanced Materials
-
Henan Zhongyue Amorphous New Materials
-
Foshan Huaxin Microlite Metal
-
Londerful New Material
-
Orient Group
-
Zhaojing Electrical Technology
-
OJSC MSTATOR
-
Advanced Technology & Materials
-
Vikarsh Nano
-
Nippon Chemi-Con
These companies are at the forefront of innovation, focusing on expanding their product portfolios and strengthening their global presence through strategic partnerships, mergers, and acquisitions.
Market Segmentation (by Application)
-
Motor Core
-
Inductor
-
Transformer
-
Wireless Charging System
-
Other
Market Segmentation (by Type)
Geographic Segmentation
-
North America (USA, Canada, Mexico)
-
Europe (Germany, UK, France, Russia, Italy, Rest of Europe)
-
Asia-Pacific (China, Japan, South Korea, India, Southeast Asia, Rest of Asia-Pacific)
-
South America (Brazil, Argentina, Columbia, Rest of South America)
-
Middle East and Africa (Saudi Arabia, UAE, Egypt, Nigeria, South Africa, Rest of MEA)
FAQ Section
What is the current market size of Nanocrystalline Materials for New Energy Vehicles?
Which are the key companies operating in the Nanocrystalline Materials for New Energy Vehicles market?
-
Key companies include Proterial, Bomatec, Vacuumschmelze, Qingdao Yunlu Advanced Materials, and Nippon Chemi-Con, among others.
What are the key growth drivers in the Nanocrystalline Materials for New Energy Vehicles market?
Which regions dominate the Nanocrystalline Materials for New Energy Vehicles market?
What are the emerging trends in the Nanocrystalline Materials for New Energy Vehicles market?
Key Benefits of This Market Research:
-
Industry drivers, restraints, and opportunities covered in the study
-
Neutral perspective on the market performance
-
Recent industry trends and developments
-
Competitive landscape & strategies of key players
-
Potential & niche segments and regions exhibiting promising growth covered
-
Historical, current, and projected market size, in terms of value
-
In-depth analysis of the Nanocrystalline Materials for New Energy Vehicles Market
-
Overview of the regional outlook of the Nanocrystalline Materials for New Energy Vehicles Market:
Key Reasons to Buy this Report:
-
Access to date statistics compiled by our researchers. These provide you with historical and forecast data, which is analyzed to tell you why your market is set to change
-
This enables you to anticipate market changes to remain ahead of your competitors
-
You will be able to copy data from the Excel spreadsheet straight into your marketing plans, business presentations, or other strategic documents
-
The concise analysis, clear graph, and table format will enable you to pinpoint the information you require quickly
-
Provision of market value data for each segment and sub-segment
-
Indicates the region and segment that is expected to witness the fastest growth as well as to dominate the market
-
Analysis by geography highlighting the consumption of the product/service in the region as well as indicating the factors that are affecting the market within each region
-
Competitive landscape which incorporates the market ranking of the major players, along with new service/product launches, partnerships, business expansions, and acquisitions in the past five years of companies profiled
-
Extensive company profiles comprising of company overview, company insights, product benchmarking, and SWOT analysis for the major market players
-
The current as well as the future market outlook of the industry concerning recent developments which involve growth opportunities and drivers as well as challenges and restraints of both emerging as well as developed regions
-
Includes in-depth analysis of the market from various perspectives through Porter
TABLE OF CONTENTS
Table of Contents
1 Research Methodology and Statistical Scope
1.1 Market Definition and Statistical Scope of Nanocrystalline Materials for New Energy Vehicles
1.2 Key Market Segments
1.2.1 Nanocrystalline Materials for New Energy Vehicles Segment by Type
1.2.2 Nanocrystalline Materials for New Energy Vehicles Segment by Application
1.3 Methodology & Sources of Information
1.3.1 Research Methodology
1.3.2 Research Process
1.3.3 Market Breakdown and Data Triangulation
1.3.4 Base Year
1.3.5 Report Assumptions & Caveats
2 Nanocrystalline Materials for New Energy Vehicles Market Overview
2.1 Global Market Overview
2.1.1 Global Nanocrystalline Materials for New Energy Vehicles Market Size (M USD) Estimates and Forecasts (2019-2032)
2.1.2 Global Nanocrystalline Materials for New Energy Vehicles Sales Estimates and Forecasts (2019-2032)
2.2 Market Segment Executive Summary
2.3 Global Market Size by Region
3 Nanocrystalline Materials for New Energy Vehicles Market Competitive Landscape
3.1 Global Nanocrystalline Materials for New Energy Vehicles Sales by Manufacturers (2019-2025)
3.2 Global Nanocrystalline Materials for New Energy Vehicles Revenue Market Share by Manufacturers (2019-2025)
3.3 Nanocrystalline Materials for New Energy Vehicles Market Share by Company Type (Tier 1, Tier 2, and Tier 3)
3.4 Global Nanocrystalline Materials for New Energy Vehicles Average Price by Manufacturers (2019-2025)
3.5 Manufacturers Nanocrystalline Materials for New Energy Vehicles Sales Sites, Area Served, Product Type
3.6 Nanocrystalline Materials for New Energy Vehicles Market Competitive Situation and Trends
3.6.1 Nanocrystalline Materials for New Energy Vehicles Market Concentration Rate
3.6.2 Global 5 and 10 Largest Nanocrystalline Materials for New Energy Vehicles Players Market Share by Revenue
3.6.3 Mergers & Acquisitions, Expansion
4 Nanocrystalline Materials for New Energy Vehicles Industry Chain Analysis
4.1 Nanocrystalline Materials for New Energy Vehicles Industry Chain Analysis
4.2 Market Overview of Key Raw Materials
4.3 Midstream Market Analysis
4.4 Downstream Customer Analysis
5 The Development and Dynamics of Nanocrystalline Materials for New Energy Vehicles Market
5.1 Key Development Trends
5.2 Driving Factors
5.3 Market Challenges
5.4 Market Restraints
5.5 Industry News
5.5.1 New Product Developments
5.5.2 Mergers & Acquisitions
5.5.3 Expansions
5.5.4 Collaboration/Supply Contracts
5.6 Industry Policies
6 Nanocrystalline Materials for New Energy Vehicles Market Segmentation by Type
6.1 Evaluation Matrix of Segment Market Development Potential (Type)
6.2 Global Nanocrystalline Materials for New Energy Vehicles Sales Market Share by Type (2019-2025)
6.3 Global Nanocrystalline Materials for New Energy Vehicles Market Size Market Share by Type (2019-2025)
6.4 Global Nanocrystalline Materials for New Energy Vehicles Price by Type (2019-2025)
7 Nanocrystalline Materials for New Energy Vehicles Market Segmentation by Application
7.1 Evaluation Matrix of Segment Market Development Potential (Application)
7.2 Global Nanocrystalline Materials for New Energy Vehicles Market Sales by Application (2019-2025)
7.3 Global Nanocrystalline Materials for New Energy Vehicles Market Size (M USD) by Application (2019-2025)
7.4 Global Nanocrystalline Materials for New Energy Vehicles Sales Growth Rate by Application (2019-2025)
8 Nanocrystalline Materials for New Energy Vehicles Market Consumption by Region
8.1 Global Nanocrystalline Materials for New Energy Vehicles Sales by Region
8.1.1 Global Nanocrystalline Materials for New Energy Vehicles Sales by Region
8.1.2 Global Nanocrystalline Materials for New Energy Vehicles Sales Market Share by Region
8.2 North America
8.2.1 North America Nanocrystalline Materials for New Energy Vehicles Sales by Country
8.2.2 U.S.
8.2.3 Canada
8.2.4 Mexico
8.3 Europe
8.3.1 Europe Nanocrystalline Materials for New Energy Vehicles Sales by Country
8.3.2 Germany
8.3.3 France
8.3.4 U.K.
8.3.5 Italy
8.3.6 Russia
8.4 Asia Pacific
8.4.1 Asia Pacific Nanocrystalline Materials for New Energy Vehicles Sales by Region
8.4.2 China
8.4.3 Japan
8.4.4 South Korea
8.4.5 India
8.4.6 Southeast Asia
8.5 South America
8.5.1 South America Nanocrystalline Materials for New Energy Vehicles Sales by Country
8.5.2 Brazil
8.5.3 Argentina
8.5.4 Columbia
8.6 Middle East and Africa
8.6.1 Middle East and Africa Nanocrystalline Materials for New Energy Vehicles Sales by Region
8.6.2 Saudi Arabia
8.6.3 UAE
8.6.4 Egypt
8.6.5 Nigeria
8.6.6 South Africa
9 Nanocrystalline Materials for New Energy Vehicles Market Production by Region
9.1 Global Production of Nanocrystalline Materials for New Energy Vehicles by Region (2019-2025)
9.2 Global Nanocrystalline Materials for New Energy Vehicles Revenue Market Share by Region (2019-2025)
9.3 Global Nanocrystalline Materials for New Energy Vehicles Production, Revenue, Price and Gross Margin (2019-2025)
9.4 North America Nanocrystalline Materials for New Energy Vehicles Production
9.4.1 North America Nanocrystalline Materials for New Energy Vehicles Production Growth Rate (2019-2025)
9.4.2 North America Nanocrystalline Materials for New Energy Vehicles Production, Revenue, Price and Gross Margin (2019-2025)
9.5 Europe Nanocrystalline Materials for New Energy Vehicles Production
9.5.1 Europe Nanocrystalline Materials for New Energy Vehicles Production Growth Rate (2019-2025)
9.5.2 Europe Nanocrystalline Materials for New Energy Vehicles Production, Revenue, Price and Gross Margin (2019-2025)
9.6 Japan Nanocrystalline Materials for New Energy Vehicles Production (2019-2025)
9.6.1 Japan Nanocrystalline Materials for New Energy Vehicles Production Growth Rate (2019-2025)
9.6.2 Japan Nanocrystalline Materials for New Energy Vehicles Production, Revenue, Price and Gross Margin (2019-2025)
9.7 China Nanocrystalline Materials for New Energy Vehicles Production (2019-2025)
9.7.1 China Nanocrystalline Materials for New Energy Vehicles Production Growth Rate (2019-2025)
9.7.2 China Nanocrystalline Materials for New Energy Vehicles Production, Revenue, Price and Gross Margin (2019-2025)
10 Key Companies Profile
10.1 Proterial
10.1.1 Proterial Nanocrystalline Materials for New Energy Vehicles Basic Information
10.1.2 Proterial Nanocrystalline Materials for New Energy Vehicles Product Overview
10.1.3 Proterial Nanocrystalline Materials for New Energy Vehicles Product Market Performance
10.1.4 Proterial Business Overview
10.1.5 Proterial Nanocrystalline Materials for New Energy Vehicles SWOT Analysis
10.1.6 Proterial Recent Developments
10.2 Bomatec
10.2.1 Bomatec Nanocrystalline Materials for New Energy Vehicles Basic Information
10.2.2 Bomatec Nanocrystalline Materials for New Energy Vehicles Product Overview
10.2.3 Bomatec Nanocrystalline Materials for New Energy Vehicles Product Market Performance
10.2.4 Bomatec Business Overview
10.2.5 Bomatec Nanocrystalline Materials for New Energy Vehicles SWOT Analysis
10.2.6 Bomatec Recent Developments
10.3 Vacuumschmelze
10.3.1 Vacuumschmelze Nanocrystalline Materials for New Energy Vehicles Basic Information
10.3.2 Vacuumschmelze Nanocrystalline Materials for New Energy Vehicles Product Overview
10.3.3 Vacuumschmelze Nanocrystalline Materials for New Energy Vehicles Product Market Performance
10.3.4 Vacuumschmelze Nanocrystalline Materials for New Energy Vehicles SWOT Analysis
10.3.5 Vacuumschmelze Business Overview
10.3.6 Vacuumschmelze Recent Developments
10.4 Qingdao Yunlu Advanced Materials
10.4.1 Qingdao Yunlu Advanced Materials Nanocrystalline Materials for New Energy Vehicles Basic Information
10.4.2 Qingdao Yunlu Advanced Materials Nanocrystalline Materials for New Energy Vehicles Product Overview
10.4.3 Qingdao Yunlu Advanced Materials Nanocrystalline Materials for New Energy Vehicles Product Market Performance
10.4.4 Qingdao Yunlu Advanced Materials Business Overview
10.4.5 Qingdao Yunlu Advanced Materials Recent Developments
10.5 Henan Zhongyue Amorphous New Materials
10.5.1 Henan Zhongyue Amorphous New Materials Nanocrystalline Materials for New Energy Vehicles Basic Information
10.5.2 Henan Zhongyue Amorphous New Materials Nanocrystalline Materials for New Energy Vehicles Product Overview
10.5.3 Henan Zhongyue Amorphous New Materials Nanocrystalline Materials for New Energy Vehicles Product Market Performance
10.5.4 Henan Zhongyue Amorphous New Materials Business Overview
10.5.5 Henan Zhongyue Amorphous New Materials Recent Developments
10.6 Foshan Huaxin Microlite Metal
10.6.1 Foshan Huaxin Microlite Metal Nanocrystalline Materials for New Energy Vehicles Basic Information
10.6.2 Foshan Huaxin Microlite Metal Nanocrystalline Materials for New Energy Vehicles Product Overview
10.6.3 Foshan Huaxin Microlite Metal Nanocrystalline Materials for New Energy Vehicles Product Market Performance
10.6.4 Foshan Huaxin Microlite Metal Business Overview
10.6.5 Foshan Huaxin Microlite Metal Recent Developments
10.7 Londerful New Material
10.7.1 Londerful New Material Nanocrystalline Materials for New Energy Vehicles Basic Information
10.7.2 Londerful New Material Nanocrystalline Materials for New Energy Vehicles Product Overview
10.7.3 Londerful New Material Nanocrystalline Materials for New Energy Vehicles Product Market Performance
10.7.4 Londerful New Material Business Overview
10.7.5 Londerful New Material Recent Developments
10.8 Orient Group
10.8.1 Orient Group Nanocrystalline Materials for New Energy Vehicles Basic Information
10.8.2 Orient Group Nanocrystalline Materials for New Energy Vehicles Product Overview
10.8.3 Orient Group Nanocrystalline Materials for New Energy Vehicles Product Market Performance
10.8.4 Orient Group Business Overview
10.8.5 Orient Group Recent Developments
10.9 Zhaojing Electrical Technology
10.9.1 Zhaojing Electrical Technology Nanocrystalline Materials for New Energy Vehicles Basic Information
10.9.2 Zhaojing Electrical Technology Nanocrystalline Materials for New Energy Vehicles Product Overview
10.9.3 Zhaojing Electrical Technology Nanocrystalline Materials for New Energy Vehicles Product Market Performance
10.9.4 Zhaojing Electrical Technology Business Overview
10.9.5 Zhaojing Electrical Technology Recent Developments
10.10 OJSC MSTATOR
10.10.1 OJSC MSTATOR Nanocrystalline Materials for New Energy Vehicles Basic Information
10.10.2 OJSC MSTATOR Nanocrystalline Materials for New Energy Vehicles Product Overview
10.10.3 OJSC MSTATOR Nanocrystalline Materials for New Energy Vehicles Product Market Performance
10.10.4 OJSC MSTATOR Business Overview
10.10.5 OJSC MSTATOR Recent Developments
10.11 Advanced Technology and Materials
10.11.1 Advanced Technology and Materials Nanocrystalline Materials for New Energy Vehicles Basic Information
10.11.2 Advanced Technology and Materials Nanocrystalline Materials for New Energy Vehicles Product Overview
10.11.3 Advanced Technology and Materials Nanocrystalline Materials for New Energy Vehicles Product Market Performance
10.11.4 Advanced Technology and Materials Business Overview
10.11.5 Advanced Technology and Materials Recent Developments
10.12 Vikarsh Nano
10.12.1 Vikarsh Nano Nanocrystalline Materials for New Energy Vehicles Basic Information
10.12.2 Vikarsh Nano Nanocrystalline Materials for New Energy Vehicles Product Overview
10.12.3 Vikarsh Nano Nanocrystalline Materials for New Energy Vehicles Product Market Performance
10.12.4 Vikarsh Nano Business Overview
10.12.5 Vikarsh Nano Recent Developments
10.13 Nippon Chemi-Con
10.13.1 Nippon Chemi-Con Nanocrystalline Materials for New Energy Vehicles Basic Information
10.13.2 Nippon Chemi-Con Nanocrystalline Materials for New Energy Vehicles Product Overview
10.13.3 Nippon Chemi-Con Nanocrystalline Materials for New Energy Vehicles Product Market Performance
10.13.4 Nippon Chemi-Con Business Overview
10.13.5 Nippon Chemi-Con Recent Developments
11 Nanocrystalline Materials for New Energy Vehicles Market Forecast by Region
11.1 Global Nanocrystalline Materials for New Energy Vehicles Market Size Forecast
11.2 Global Nanocrystalline Materials for New Energy Vehicles Market Forecast by Region
11.2.1 North America Market Size Forecast by Country
11.2.2 Europe Nanocrystalline Materials for New Energy Vehicles Market Size Forecast by Country
11.2.3 Asia Pacific Nanocrystalline Materials for New Energy Vehicles Market Size Forecast by Region
11.2.4 South America Nanocrystalline Materials for New Energy Vehicles Market Size Forecast by Country
11.2.5 Middle East and Africa Forecasted Consumption of Nanocrystalline Materials for New Energy Vehicles by Country
12 Forecast Market by Type and by Application (2025-2032)
12.1 Global Nanocrystalline Materials for New Energy Vehicles Market Forecast by Type (2025-2032)
12.1.1 Global Forecasted Sales of Nanocrystalline Materials for New Energy Vehicles by Type (2025-2032)
12.1.2 Global Nanocrystalline Materials for New Energy Vehicles Market Size Forecast by Type (2025-2032)
12.1.3 Global Forecasted Price of Nanocrystalline Materials for New Energy Vehicles by Type (2025-2032)
12.2 Global Nanocrystalline Materials for New Energy Vehicles Market Forecast by Application (2025-2032)
12.2.1 Global Nanocrystalline Materials for New Energy Vehicles Sales (K MT) Forecast by Application
12.2.2 Global Nanocrystalline Materials for New Energy Vehicles Market Size (M USD) Forecast by Application (2025-2032)
13 Conclusion and Key Findings
LIST OF TABLES & FIGURES
List of Tables
Table 1. Introduction of the Type
Table 2. Introduction of the Application
Table 3. Market Size (M USD) Segment Executive Summary
Table 4. Nanocrystalline Materials for New Energy Vehicles Market Size Comparison by Region (M USD)
Table 5. Global Nanocrystalline Materials for New Energy Vehicles Sales (K MT) by Manufacturers (2019-2025)
Table 6. Global Nanocrystalline Materials for New Energy Vehicles Sales Market Share by Manufacturers (2019-2025)
Table 7. Global Nanocrystalline Materials for New Energy Vehicles Revenue (M USD) by Manufacturers (2019-2025)
Table 8. Global Nanocrystalline Materials for New Energy Vehicles Revenue Share by Manufacturers (2019-2025)
Table 9. Company Type (Tier 1, Tier 2, and Tier 3) & (based on the Revenue in Nanocrystalline Materials for New Energy Vehicles as of 2022)
Table 10. Global Market Nanocrystalline Materials for New Energy Vehicles Average Price (USD/MT) of Key Manufacturers (2019-2025)
Table 11. Manufacturers Nanocrystalline Materials for New Energy Vehicles Sales Sites and Area Served
Table 12. Manufacturers Nanocrystalline Materials for New Energy Vehicles Product Type
Table 13. Global Nanocrystalline Materials for New Energy Vehicles Manufacturers Market Concentration Ratio (CR5 and HHI)
Table 14. Mergers & Acquisitions, Expansion Plans
Table 15. Industry Chain Map of Nanocrystalline Materials for New Energy Vehicles
Table 16. Market Overview of Key Raw Materials
Table 17. Midstream Market Analysis
Table 18. Downstream Customer Analysis
Table 19. Key Development Trends
Table 20. Driving Factors
Table 21. Nanocrystalline Materials for New Energy Vehicles Market Challenges
Table 22. Global Nanocrystalline Materials for New Energy Vehicles Sales by Type (K MT)
Table 23. Global Nanocrystalline Materials for New Energy Vehicles Market Size by Type (M USD)
Table 24. Global Nanocrystalline Materials for New Energy Vehicles Sales (K MT) by Type (2019-2025)
Table 25. Global Nanocrystalline Materials for New Energy Vehicles Sales Market Share by Type (2019-2025)
Table 26. Global Nanocrystalline Materials for New Energy Vehicles Market Size (M USD) by Type (2019-2025)
Table 27. Global Nanocrystalline Materials for New Energy Vehicles Market Size Share by Type (2019-2025)
Table 28. Global Nanocrystalline Materials for New Energy Vehicles Price (USD/MT) by Type (2019-2025)
Table 29. Global Nanocrystalline Materials for New Energy Vehicles Sales (K MT) by Application
Table 30. Global Nanocrystalline Materials for New Energy Vehicles Market Size by Application
Table 31. Global Nanocrystalline Materials for New Energy Vehicles Sales by Application (2019-2025) & (K MT)
Table 32. Global Nanocrystalline Materials for New Energy Vehicles Sales Market Share by Application (2019-2025)
Table 33. Global Nanocrystalline Materials for New Energy Vehicles Sales by Application (2019-2025) & (M USD)
Table 34. Global Nanocrystalline Materials for New Energy Vehicles Market Share by Application (2019-2025)
Table 35. Global Nanocrystalline Materials for New Energy Vehicles Sales Growth Rate by Application (2019-2025)
Table 36. Global Nanocrystalline Materials for New Energy Vehicles Sales by Region (2019-2025) & (K MT)
Table 37. Global Nanocrystalline Materials for New Energy Vehicles Sales Market Share by Region (2019-2025)
Table 38. North America Nanocrystalline Materials for New Energy Vehicles Sales by Country (2019-2025) & (K MT)
Table 39. Europe Nanocrystalline Materials for New Energy Vehicles Sales by Country (2019-2025) & (K MT)
Table 40. Asia Pacific Nanocrystalline Materials for New Energy Vehicles Sales by Region (2019-2025) & (K MT)
Table 41. South America Nanocrystalline Materials for New Energy Vehicles Sales by Country (2019-2025) & (K MT)
Table 42. Middle East and Africa Nanocrystalline Materials for New Energy Vehicles Sales by Region (2019-2025) & (K MT)
Table 43. Global Nanocrystalline Materials for New Energy Vehicles Production (K MT) by Region (2019-2025)
Table 44. Global Nanocrystalline Materials for New Energy Vehicles Revenue (US$ Million) by Region (2019-2025)
Table 45. Global Nanocrystalline Materials for New Energy Vehicles Revenue Market Share by Region (2019-2025)
Table 46. Global Nanocrystalline Materials for New Energy Vehicles Production (K MT), Revenue (US$ Million), Price (USD/MT) and Gross Margin (2019-2025)
Table 47. North America Nanocrystalline Materials for New Energy Vehicles Production (K MT), Revenue (US$ Million), Price (USD/MT) and Gross Margin (2019-2025)
Table 48. Europe Nanocrystalline Materials for New Energy Vehicles Production (K MT), Revenue (US$ Million), Price (USD/MT) and Gross Margin (2019-2025)
Table 49. Japan Nanocrystalline Materials for New Energy Vehicles Production (K MT), Revenue (US$ Million), Price (USD/MT) and Gross Margin (2019-2025)
Table 50. China Nanocrystalline Materials for New Energy Vehicles Production (K MT), Revenue (US$ Million), Price (USD/MT) and Gross Margin (2019-2025)
Table 51. Proterial Nanocrystalline Materials for New Energy Vehicles Basic Information
Table 52. Proterial Nanocrystalline Materials for New Energy Vehicles Product Overview
Table 53. Proterial Nanocrystalline Materials for New Energy Vehicles Sales (K MT), Revenue (M USD), Price (USD/MT) and Gross Margin (2019-2025)
Table 54. Proterial Business Overview
Table 55. Proterial Nanocrystalline Materials for New Energy Vehicles SWOT Analysis
Table 56. Proterial Recent Developments
Table 57. Bomatec Nanocrystalline Materials for New Energy Vehicles Basic Information
Table 58. Bomatec Nanocrystalline Materials for New Energy Vehicles Product Overview
Table 59. Bomatec Nanocrystalline Materials for New Energy Vehicles Sales (K MT), Revenue (M USD), Price (USD/MT) and Gross Margin (2019-2025)
Table 60. Bomatec Business Overview
Table 61. Bomatec Nanocrystalline Materials for New Energy Vehicles SWOT Analysis
Table 62. Bomatec Recent Developments
Table 63. Vacuumschmelze Nanocrystalline Materials for New Energy Vehicles Basic Information
Table 64. Vacuumschmelze Nanocrystalline Materials for New Energy Vehicles Product Overview
Table 65. Vacuumschmelze Nanocrystalline Materials for New Energy Vehicles Sales (K MT), Revenue (M USD), Price (USD/MT) and Gross Margin (2019-2025)
Table 66. Vacuumschmelze Nanocrystalline Materials for New Energy Vehicles SWOT Analysis
Table 67. Vacuumschmelze Business Overview
Table 68. Vacuumschmelze Recent Developments
Table 69. Qingdao Yunlu Advanced Materials Nanocrystalline Materials for New Energy Vehicles Basic Information
Table 70. Qingdao Yunlu Advanced Materials Nanocrystalline Materials for New Energy Vehicles Product Overview
Table 71. Qingdao Yunlu Advanced Materials Nanocrystalline Materials for New Energy Vehicles Sales (K MT), Revenue (M USD), Price (USD/MT) and Gross Margin (2019-2025)
Table 72. Qingdao Yunlu Advanced Materials Business Overview
Table 73. Qingdao Yunlu Advanced Materials Recent Developments
Table 74. Henan Zhongyue Amorphous New Materials Nanocrystalline Materials for New Energy Vehicles Basic Information
Table 75. Henan Zhongyue Amorphous New Materials Nanocrystalline Materials for New Energy Vehicles Product Overview
Table 76. Henan Zhongyue Amorphous New Materials Nanocrystalline Materials for New Energy Vehicles Sales (K MT), Revenue (M USD), Price (USD/MT) and Gross Margin (2019-2025)
Table 77. Henan Zhongyue Amorphous New Materials Business Overview
Table 78. Henan Zhongyue Amorphous New Materials Recent Developments
Table 79. Foshan Huaxin Microlite Metal Nanocrystalline Materials for New Energy Vehicles Basic Information
Table 80. Foshan Huaxin Microlite Metal Nanocrystalline Materials for New Energy Vehicles Product Overview
Table 81. Foshan Huaxin Microlite Metal Nanocrystalline Materials for New Energy Vehicles Sales (K MT), Revenue (M USD), Price (USD/MT) and Gross Margin (2019-2025)
Table 82. Foshan Huaxin Microlite Metal Business Overview
Table 83. Foshan Huaxin Microlite Metal Recent Developments
Table 84. Londerful New Material Nanocrystalline Materials for New Energy Vehicles Basic Information
Table 85. Londerful New Material Nanocrystalline Materials for New Energy Vehicles Product Overview
Table 86. Londerful New Material Nanocrystalline Materials for New Energy Vehicles Sales (K MT), Revenue (M USD), Price (USD/MT) and Gross Margin (2019-2025)
Table 87. Londerful New Material Business Overview
Table 88. Londerful New Material Recent Developments
Table 89. Orient Group Nanocrystalline Materials for New Energy Vehicles Basic Information
Table 90. Orient Group Nanocrystalline Materials for New Energy Vehicles Product Overview
Table 91. Orient Group Nanocrystalline Materials for New Energy Vehicles Sales (K MT), Revenue (M USD), Price (USD/MT) and Gross Margin (2019-2025)
Table 92. Orient Group Business Overview
Table 93. Orient Group Recent Developments
Table 94. Zhaojing Electrical Technology Nanocrystalline Materials for New Energy Vehicles Basic Information
Table 95. Zhaojing Electrical Technology Nanocrystalline Materials for New Energy Vehicles Product Overview
Table 96. Zhaojing Electrical Technology Nanocrystalline Materials for New Energy Vehicles Sales (K MT), Revenue (M USD), Price (USD/MT) and Gross Margin (2019-2025)
Table 97. Zhaojing Electrical Technology Business Overview
Table 98. Zhaojing Electrical Technology Recent Developments
Table 99. OJSC MSTATOR Nanocrystalline Materials for New Energy Vehicles Basic Information
Table 100. OJSC MSTATOR Nanocrystalline Materials for New Energy Vehicles Product Overview
Table 101. OJSC MSTATOR Nanocrystalline Materials for New Energy Vehicles Sales (K MT), Revenue (M USD), Price (USD/MT) and Gross Margin (2019-2025)
Table 102. OJSC MSTATOR Business Overview
Table 103. OJSC MSTATOR Recent Developments
Table 104. Advanced Technology and Materials Nanocrystalline Materials for New Energy Vehicles Basic Information
Table 105. Advanced Technology and Materials Nanocrystalline Materials for New Energy Vehicles Product Overview
Table 106. Advanced Technology and Materials Nanocrystalline Materials for New Energy Vehicles Sales (K MT), Revenue (M USD), Price (USD/MT) and Gross Margin (2019-2025)
Table 107. Advanced Technology and Materials Business Overview
Table 108. Advanced Technology and Materials Recent Developments
Table 109. Vikarsh Nano Nanocrystalline Materials for New Energy Vehicles Basic Information
Table 110. Vikarsh Nano Nanocrystalline Materials for New Energy Vehicles Product Overview
Table 111. Vikarsh Nano Nanocrystalline Materials for New Energy Vehicles Sales (K MT), Revenue (M USD), Price (USD/MT) and Gross Margin (2019-2025)
Table 112. Vikarsh Nano Business Overview
Table 113. Vikarsh Nano Recent Developments
Table 114. Nippon Chemi-Con Nanocrystalline Materials for New Energy Vehicles Basic Information
Table 115. Nippon Chemi-Con Nanocrystalline Materials for New Energy Vehicles Product Overview
Table 116. Nippon Chemi-Con Nanocrystalline Materials for New Energy Vehicles Sales (K MT), Revenue (M USD), Price (USD/MT) and Gross Margin (2019-2025)
Table 117. Nippon Chemi-Con Business Overview
Table 118. Nippon Chemi-Con Recent Developments
Table 119. Global Nanocrystalline Materials for New Energy Vehicles Sales Forecast by Region (2025-2032) & (K MT)
Table 120. Global Nanocrystalline Materials for New Energy Vehicles Market Size Forecast by Region (2025-2032) & (M USD)
Table 121. North America Nanocrystalline Materials for New Energy Vehicles Sales Forecast by Country (2025-2032) & (K MT)
Table 122. North America Nanocrystalline Materials for New Energy Vehicles Market Size Forecast by Country (2025-2032) & (M USD)
Table 123. Europe Nanocrystalline Materials for New Energy Vehicles Sales Forecast by Country (2025-2032) & (K MT)
Table 124. Europe Nanocrystalline Materials for New Energy Vehicles Market Size Forecast by Country (2025-2032) & (M USD)
Table 125. Asia Pacific Nanocrystalline Materials for New Energy Vehicles Sales Forecast by Region (2025-2032) & (K MT)
Table 126. Asia Pacific Nanocrystalline Materials for New Energy Vehicles Market Size Forecast by Region (2025-2032) & (M USD)
Table 127. South America Nanocrystalline Materials for New Energy Vehicles Sales Forecast by Country (2025-2032) & (K MT)
Table 128. South America Nanocrystalline Materials for New Energy Vehicles Market Size Forecast by Country (2025-2032) & (M USD)
Table 129. Middle East and Africa Nanocrystalline Materials for New Energy Vehicles Consumption Forecast by Country (2025-2032) & (Units)
Table 130. Middle East and Africa Nanocrystalline Materials for New Energy Vehicles Market Size Forecast by Country (2025-2032) & (M USD)
Table 131. Global Nanocrystalline Materials for New Energy Vehicles Sales Forecast by Type (2025-2032) & (K MT)
Table 132. Global Nanocrystalline Materials for New Energy Vehicles Market Size Forecast by Type (2025-2032) & (M USD)
Table 133. Global Nanocrystalline Materials for New Energy Vehicles Price Forecast by Type (2025-2032) & (USD/MT)
Table 134. Global Nanocrystalline Materials for New Energy Vehicles Sales (K MT) Forecast by Application (2025-2032)
Table 135. Global Nanocrystalline Materials for New Energy Vehicles Market Size Forecast by Application (2025-2032) & (M USD)
List of Figures
Figure 1. Product Picture of Nanocrystalline Materials for New Energy Vehicles
Figure 2. Data Triangulation
Figure 3. Key Caveats
Figure 4. Global Nanocrystalline Materials for New Energy Vehicles Market Size (M USD), 2019-2032
Figure 5. Global Nanocrystalline Materials for New Energy Vehicles Market Size (M USD) (2019-2032)
Figure 6. Global Nanocrystalline Materials for New Energy Vehicles Sales (K MT) & (2019-2032)
Figure 7. Evaluation Matrix of Segment Market Development Potential (Type)
Figure 8. Evaluation Matrix of Segment Market Development Potential (Application)
Figure 9. Evaluation Matrix of Regional Market Development Potential
Figure 10. Nanocrystalline Materials for New Energy Vehicles Market Size by Country (M USD)
Figure 11. Nanocrystalline Materials for New Energy Vehicles Sales Share by Manufacturers in 2023
Figure 12. Global Nanocrystalline Materials for New Energy Vehicles Revenue Share by Manufacturers in 2023
Figure 13. Nanocrystalline Materials for New Energy Vehicles Market Share by Company Type (Tier 1, Tier 2 and Tier 3): 2023
Figure 14. Global Market Nanocrystalline Materials for New Energy Vehicles Average Price (USD/MT) of Key Manufacturers in 2023
Figure 15. The Global 5 and 10 Largest Players: Market Share by Nanocrystalline Materials for New Energy Vehicles Revenue in 2023
Figure 16. Evaluation Matrix of Segment Market Development Potential (Type)
Figure 17. Global Nanocrystalline Materials for New Energy Vehicles Market Share by Type
Figure 18. Sales Market Share of Nanocrystalline Materials for New Energy Vehicles by Type (2019-2025)
Figure 19. Sales Market Share of Nanocrystalline Materials for New Energy Vehicles by Type in 2023
Figure 20. Market Size Share of Nanocrystalline Materials for New Energy Vehicles by Type (2019-2025)
Figure 21. Market Size Market Share of Nanocrystalline Materials for New Energy Vehicles by Type in 2023
Figure 22. Evaluation Matrix of Segment Market Development Potential (Application)
Figure 23. Global Nanocrystalline Materials for New Energy Vehicles Market Share by Application
Figure 24. Global Nanocrystalline Materials for New Energy Vehicles Sales Market Share by Application (2019-2025)
Figure 25. Global Nanocrystalline Materials for New Energy Vehicles Sales Market Share by Application in 2023
Figure 26. Global Nanocrystalline Materials for New Energy Vehicles Market Share by Application (2019-2025)
Figure 27. Global Nanocrystalline Materials for New Energy Vehicles Market Share by Application in 2023
Figure 28. Global Nanocrystalline Materials for New Energy Vehicles Sales Growth Rate by Application (2019-2025)
Figure 29. Global Nanocrystalline Materials for New Energy Vehicles Sales Market Share by Region (2019-2025)
Figure 30. North America Nanocrystalline Materials for New Energy Vehicles Sales and Growth Rate (2019-2025) & (K MT)
Figure 31. North America Nanocrystalline Materials for New Energy Vehicles Sales Market Share by Country in 2023
Figure 32. U.S. Nanocrystalline Materials for New Energy Vehicles Sales and Growth Rate (2019-2025) & (K MT)
Figure 33. Canada Nanocrystalline Materials for New Energy Vehicles Sales (K MT) and Growth Rate (2019-2025)
Figure 34. Mexico Nanocrystalline Materials for New Energy Vehicles Sales (Units) and Growth Rate (2019-2025)
Figure 35. Europe Nanocrystalline Materials for New Energy Vehicles Sales and Growth Rate (2019-2025) & (K MT)
Figure 36. Europe Nanocrystalline Materials for New Energy Vehicles Sales Market Share by Country in 2023
Figure 37. Germany Nanocrystalline Materials for New Energy Vehicles Sales and Growth Rate (2019-2025) & (K MT)
Figure 38. France Nanocrystalline Materials for New Energy Vehicles Sales and Growth Rate (2019-2025) & (K MT)
Figure 39. U.K. Nanocrystalline Materials for New Energy Vehicles Sales and Growth Rate (2019-2025) & (K MT)
Figure 40. Italy Nanocrystalline Materials for New Energy Vehicles Sales and Growth Rate (2019-2025) & (K MT)
Figure 41. Russia Nanocrystalline Materials for New Energy Vehicles Sales and Growth Rate (2019-2025) & (K MT)
Figure 42. Asia Pacific Nanocrystalline Materials for New Energy Vehicles Sales and Growth Rate (K MT)
Figure 43. Asia Pacific Nanocrystalline Materials for New Energy Vehicles Sales Market Share by Region in 2023
Figure 44. China Nanocrystalline Materials for New Energy Vehicles Sales and Growth Rate (2019-2025) & (K MT)
Figure 45. Japan Nanocrystalline Materials for New Energy Vehicles Sales and Growth Rate (2019-2025) & (K MT)
Figure 46. South Korea Nanocrystalline Materials for New Energy Vehicles Sales and Growth Rate (2019-2025) & (K MT)
Figure 47. India Nanocrystalline Materials for New Energy Vehicles Sales and Growth Rate (2019-2025) & (K MT)
Figure 48. Southeast Asia Nanocrystalline Materials for New Energy Vehicles Sales and Growth Rate (2019-2025) & (K MT)
Figure 49. South America Nanocrystalline Materials for New Energy Vehicles Sales and Growth Rate (K MT)
Figure 50. South America Nanocrystalline Materials for New Energy Vehicles Sales Market Share by Country in 2023
Figure 51. Brazil Nanocrystalline Materials for New Energy Vehicles Sales and Growth Rate (2019-2025) & (K MT)
Figure 52. Argentina Nanocrystalline Materials for New Energy Vehicles Sales and Growth Rate (2019-2025) & (K MT)
Figure 53. Columbia Nanocrystalline Materials for New Energy Vehicles Sales and Growth Rate (2019-2025) & (K MT)
Figure 54. Middle East and Africa Nanocrystalline Materials for New Energy Vehicles Sales and Growth Rate (K MT)
Figure 55. Middle East and Africa Nanocrystalline Materials for New Energy Vehicles Sales Market Share by Region in 2023
Figure 56. Saudi Arabia Nanocrystalline Materials for New Energy Vehicles Sales and Growth Rate (2019-2025) & (K MT)
Figure 57. UAE Nanocrystalline Materials for New Energy Vehicles Sales and Growth Rate (2019-2025) & (K MT)
Figure 58. Egypt Nanocrystalline Materials for New Energy Vehicles Sales and Growth Rate (2019-2025) & (K MT)
Figure 59. Nigeria Nanocrystalline Materials for New Energy Vehicles Sales and Growth Rate (2019-2025) & (K MT)
Figure 60. South Africa Nanocrystalline Materials for New Energy Vehicles Sales and Growth Rate (2019-2025) & (K MT)
Figure 61. Global Nanocrystalline Materials for New Energy Vehicles Production Market Share by Region (2019-2025)
Figure 62. North America Nanocrystalline Materials for New Energy Vehicles Production (K MT) Growth Rate (2019-2025)
Figure 63. Europe Nanocrystalline Materials for New Energy Vehicles Production (K MT) Growth Rate (2019-2025)
Figure 64. Japan Nanocrystalline Materials for New Energy Vehicles Production (K MT) Growth Rate (2019-2025)
Figure 65. China Nanocrystalline Materials for New Energy Vehicles Production (K MT) Growth Rate (2019-2025)
Figure 66. Global Nanocrystalline Materials for New Energy Vehicles Sales Forecast by Volume (2019-2032) & (K MT)
Figure 67. Global Nanocrystalline Materials for New Energy Vehicles Market Size Forecast by Value (2019-2032) & (M USD)
Figure 68. Global Nanocrystalline Materials for New Energy Vehicles Sales Market Share Forecast by Type (2025-2032)
Figure 69. Global Nanocrystalline Materials for New Energy Vehicles Market Share Forecast by Type (2025-2032)
Figure 70. Global Nanocrystalline Materials for New Energy Vehicles Sales Forecast by Application (2025-2032)
Figure 71. Global Nanocrystalline Materials for New Energy Vehicles Market Share Forecast by Application (2025-2032)

