Nanosized aluminum oxide (nano-alumina) refers to aluminum oxide particles with dimensions in the nanometer range. These particles exist as spherical or nearly spherical nanoparticles and in the form of fibers that can be oriented or undirected. Nano-alumina is characterized by its low electrical conductivity, resistance to chemical attack, high strength, extreme hardness, and high melting point, making it a versatile material for various industrial applications.
Market Size
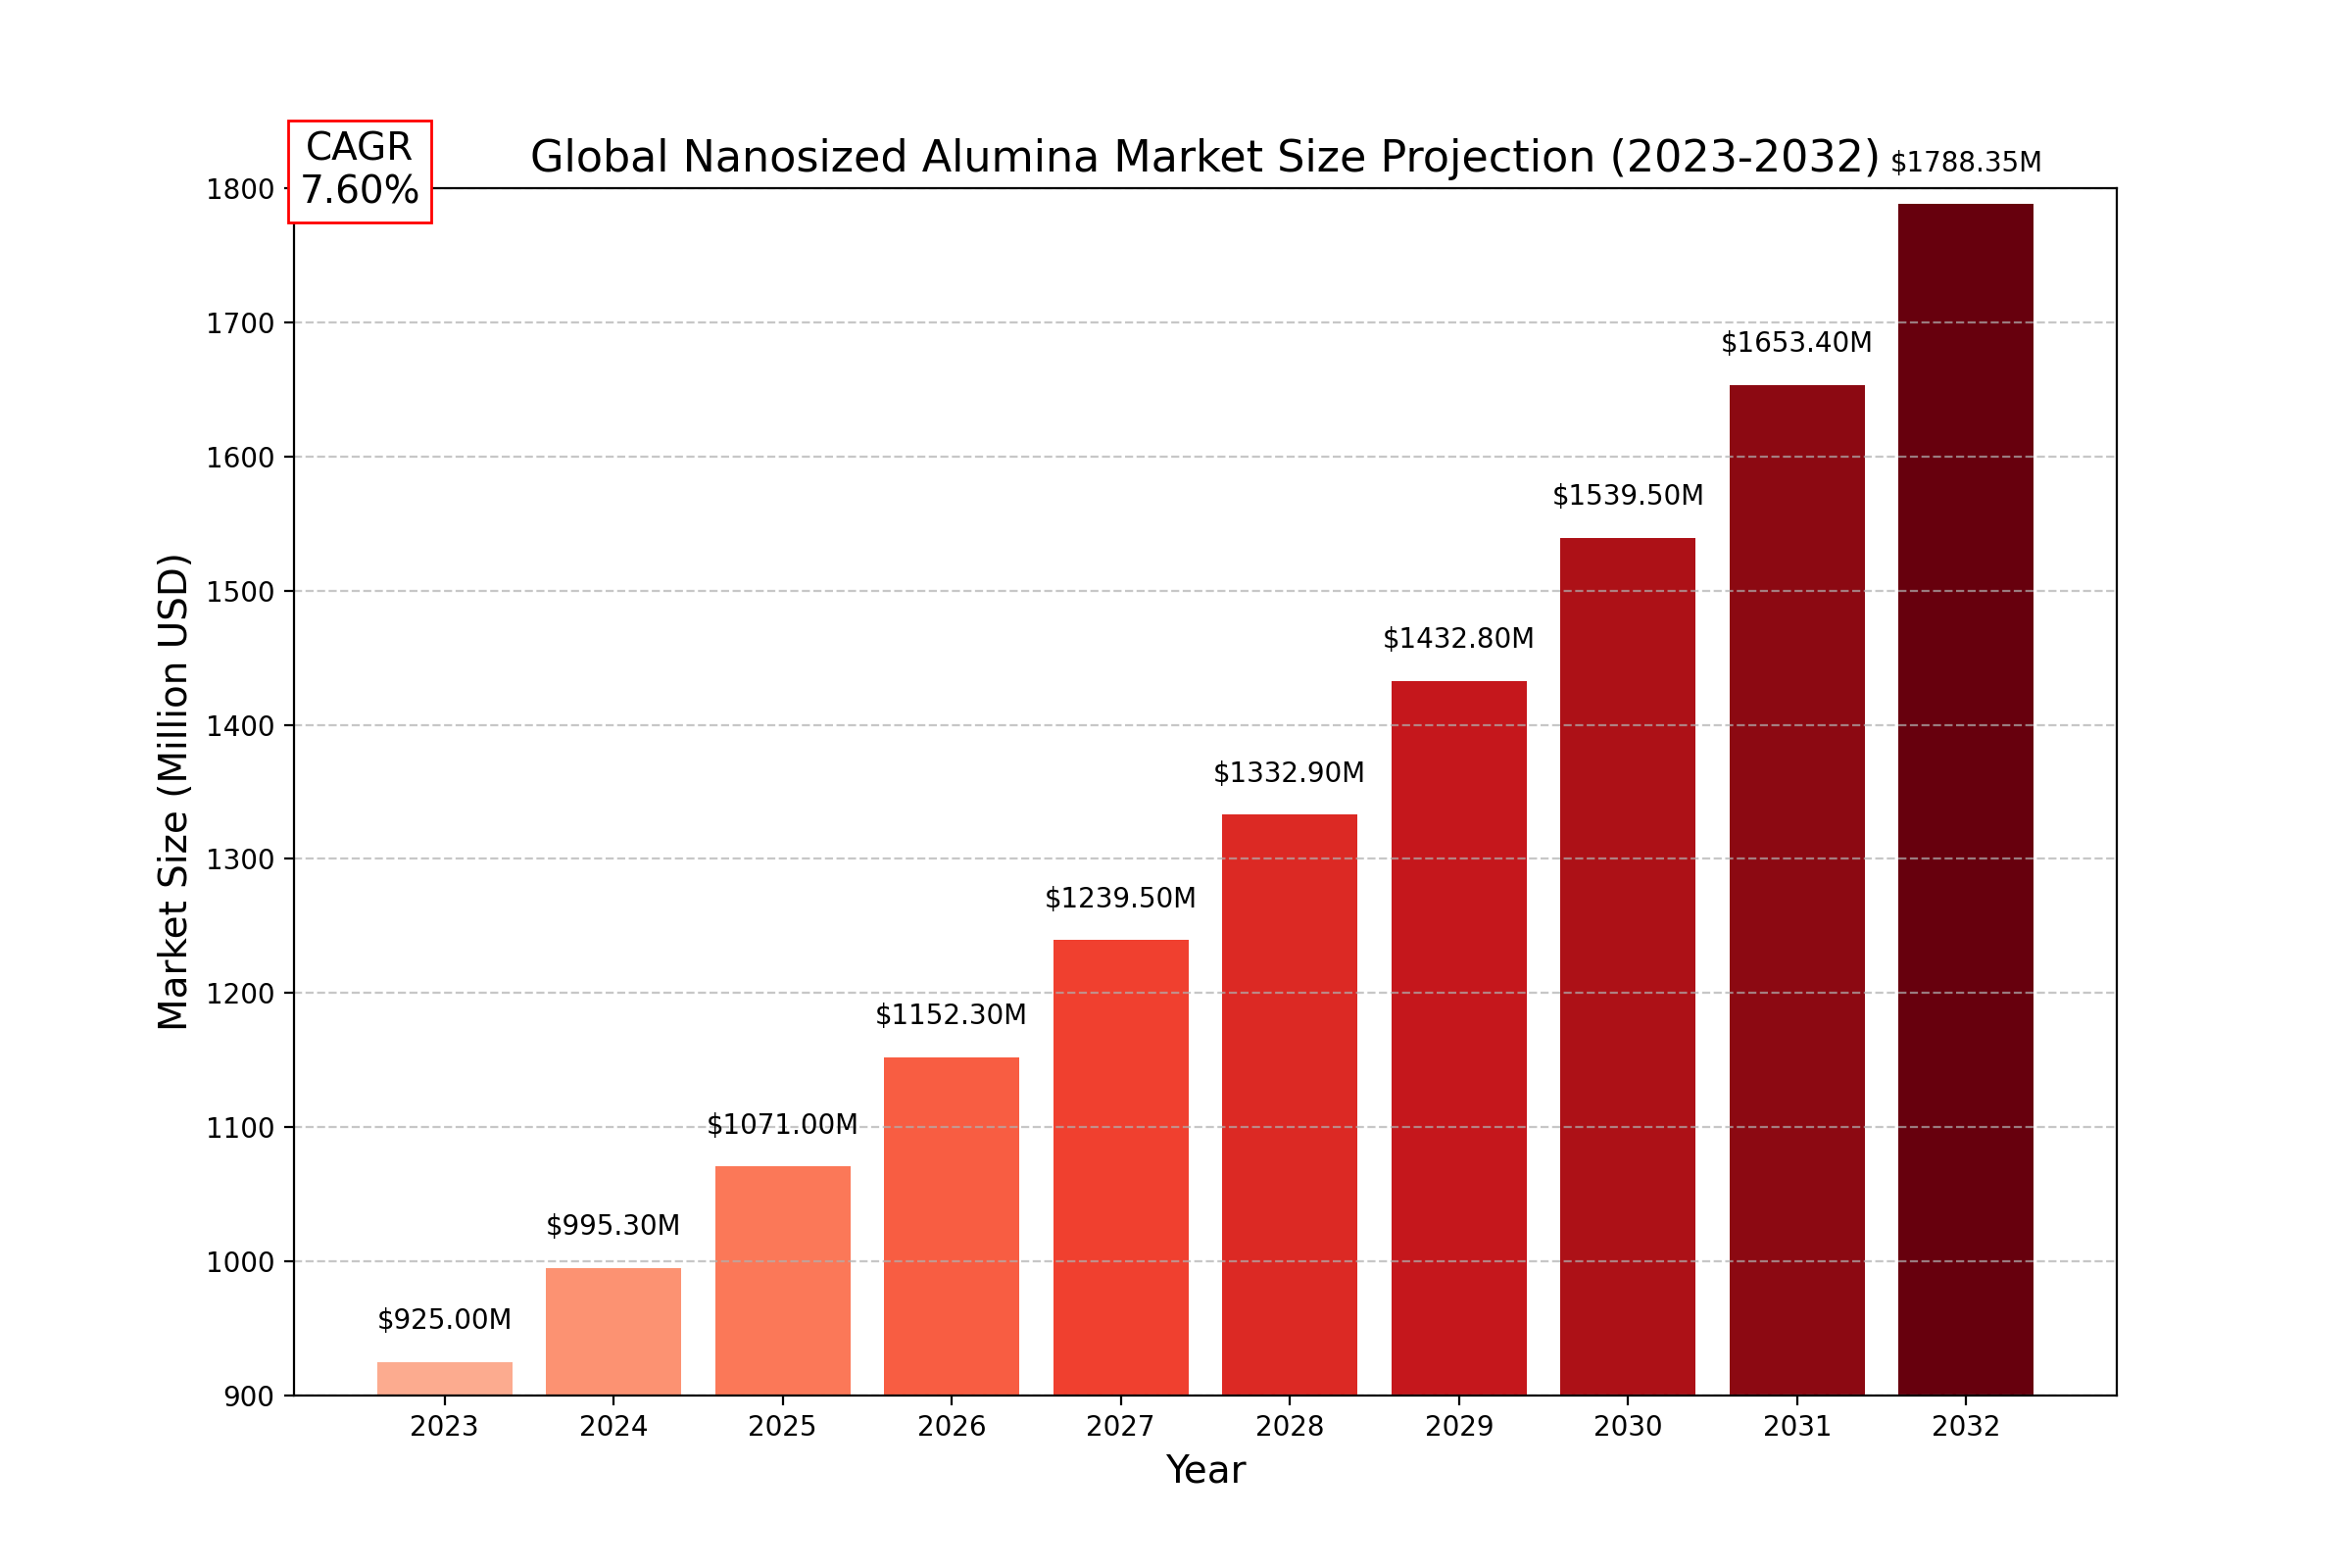
The global nanosized alumina market size was estimated at USD 925 million in 2023 and is projected to grow to USD 1,788.35 million by 2032, exhibiting a CAGR of 7.60% during the forecast period.
Regional Breakdown
-
North America: Estimated market size of USD 273.45 million in 2023, expected to grow at a CAGR of 6.51% through 2032, driven by advancements in coatings, electronics, and defense applications.
-
Europe: Witnessing steady demand due to developments in energy and automotive sectors.
-
Asia-Pacific: The largest and fastest-growing region, led by China and India, driven by increasing industrialization and rising demand in electronics and coatings.
-
South America & Middle East and Africa: Emerging markets with untapped potential in oil and gas, energy, and automotive applications.
Market Dynamics (Drivers, Restraints, Opportunities, and Challenges)
Drivers
-
Increased Demand for High-Performance Materials: Nano-alumina’s unique properties make it indispensable in industries requiring high strength and durability.
-
Advancements in Electronics and Coatings: Growing use in semiconductors, LED technologies, and protective coatings boosts market demand.
-
Expansion in Renewable Energy: Rising investments in renewable energy create demand for high-performance nanomaterials, particularly in photovoltaic cells and battery technologies.
Restraints
-
High Production Costs: The synthesis of nanosized alumina requires advanced technology, leading to higher production costs.
-
Environmental Concerns: The potential environmental impact of nanoparticle release may pose regulatory challenges.
Opportunities
-
Emerging Applications in Medicine: Increasing use of nanosized alumina in drug delivery and medical implants offers new growth avenues.
-
Development of Sustainable Manufacturing Processes: Innovations in eco-friendly production methods are likely to reduce costs and environmental impact.
Challenges
-
Regulatory Compliance: Strict environmental and safety regulations could impact production and usage.
-
Technological Barriers: Challenges in scaling up production while maintaining quality and performance hinder market growth.
Regional Analysis
North America
The region’s market is driven by advancements in defense, coatings, and electronics. The U.S. leads in R&D investments, particularly in high-performance nanomaterials.
Asia-Pacific
Asia-Pacific is the fastest-growing region, with China, Japan, and India contributing significantly. Rising industrialization and government initiatives in renewable energy and electronics are key growth drivers.
Europe
Europe’s market is supported by the automotive and energy sectors, with Germany and France leading in innovation and adoption of nano-alumina technologies.
South America & Middle East and Africa
These regions are in the early stages of adoption, with growing investments in oil and gas, energy, and automotive applications offering potential for market expansion.
Competitor Analysis
The nanosized alumina market is competitive, with key players focusing on innovation, strategic collaborations, and expanding production capacities. Major companies include:
-
Advanced Nano Products: A leader in high-performance nanomaterials.
-
Alcoa: Specializes in industrial-grade aluminum oxide products.
-
American Elements: Known for its extensive range of nanoscale materials.
-
Baikowski Chimie: Focused on high-purity alumina solutions.
-
Sumitomo Chemical: A significant player in the chemical and materials industries.
Market Segmentation (by Application)
- Automotive - Nanosized alumina enhances wear resistance and thermal stability in automotive components, improving vehicle performance and durability.
- Military - The material’s high strength and hardness make it ideal for protective coatings and lightweight armor applications.
- Energy - Nano-alumina is used in renewable energy systems, including fuel cells and energy storage devices.
- Coatings - Its resistance to wear and corrosion makes nano-alumina a preferred choice for protective and functional coatings.
- Oil and Gas - Nanosized alumina enhances the performance of drilling fluids and catalysts in oil and gas extraction processes.
- Electronics - Widely used in semiconductors, LEDs, and other electronic components requiring high thermal conductivity and durability.
- Others - Includes niche applications in medical devices, aerospace, and construction.
Market Segmentation (by Type)
- Crystal - High-purity crystal nano-alumina used in electronics and coatings.
- Fiber - Fiber-based nano-alumina offers enhanced mechanical strength for military and aerospace applications.
- Powder - Powder form is widely used in manufacturing ceramics, catalysts, and polishing materials.
Key Company
- Advanced Nano Products
- Alcoa
- Alpha Nanomaterials
- American Elements
- Baikowski Chimie
- BYK-Chemie
- Chengdu Alpha Nanotechnology Corporation
- Eprui Nanoparticles & Microspheres
- Forever Chemical
- Inframat
- Io-Litec Nanomaterials
- Kawaken Fine Chemical
- Meliorum Technologies
- Sumitomo Chemical
Geographic Segmentation
- North America: USA, Canada, Mexico
- Europe: Germany, UK, France, Russia, Italy, Rest of Europe
- Asia-Pacific: China, Japan, South Korea, India, Southeast Asia, Rest of Asia-Pacific
- South America: Brazil, Argentina, Colombia, Rest of South America
- Middle East and Africa: Saudi Arabia, UAE, Egypt, Nigeria, South Africa, Rest of MEA
FAQ Section
1 What is the current market size of the Nanosized Alumina market?
2 Which are the key companies operating in the Nanosized Alumina market?
-
Key companies include Advanced Nano Products, Alcoa, American Elements, Baikowski Chimie, and Sumitomo Chemical.
3 What are the key growth drivers in the Nanosized Alumina market?
4 Which regions dominate the Nanosized Alumina market?
5 What are the emerging trends in the Nanosized Alumina market?
Key Benefits of This Market Research:
- Industry drivers, restraints, and opportunities covered in the study
- Neutral perspective on the market performance
- Recent industry trends and developments
- Competitive landscape & strategies of key players
- Potential & niche segments and regions exhibiting promising growth covered
- Historical, current, and projected market size, in terms of value
- In-depth analysis of the Nanosized Alumina Market
- Overview of the regional outlook of the Nanosized Alumina Market:
Key Reasons to Buy this Report:
- Access to date statistics compiled by our researchers. These provide you with historical and forecast data, which is analyzed to tell you why your market is set to change
- This enables you to anticipate market changes to remain ahead of your competitors
- You will be able to copy data from the Excel spreadsheet straight into your marketing plans, business presentations, or other strategic documents
- The concise analysis, clear graph, and table format will enable you to pinpoint the information you require quickly
- Provision of market value data for each segment and sub-segment
- Indicates the region and segment that is expected to witness the fastest growth as well as to dominate the market
- Analysis by geography highlighting the consumption of the product/service in the region as well as indicating the factors that are affecting the market within each region
- Competitive landscape which incorporates the market ranking of the major players, along with new service/product launches, partnerships, business expansions, and acquisitions in the past five years of companies profiled
- Extensive company profiles comprising of company overview, company insights, product benchmarking, and SWOT analysis for the major market players
- The current as well as the future market outlook of the industry concerning recent developments which involve growth opportunities and drivers as well as challenges and restraints of both emerging as well as developed regions
- Includes in-depth analysis of the market from various perspectives through Porter
TABLE OF CONTENTS
Table of Contents
1 Research Methodology and Statistical Scope
1.1 Market Definition and Statistical Scope of Nanosized Alumina
1.2 Key Market Segments
1.2.1 Nanosized Alumina Segment by Type
1.2.2 Nanosized Alumina Segment by Application
1.3 Methodology & Sources of Information
1.3.1 Research Methodology
1.3.2 Research Process
1.3.3 Market Breakdown and Data Triangulation
1.3.4 Base Year
1.3.5 Report Assumptions & Caveats
2 Nanosized Alumina Market Overview
2.1 Global Market Overview
2.1.1 Global Nanosized Alumina Market Size (M USD) Estimates and Forecasts (2019-2032)
2.1.2 Global Nanosized Alumina Sales Estimates and Forecasts (2019-2032)
2.2 Market Segment Executive Summary
2.3 Global Market Size by Region
3 Nanosized Alumina Market Competitive Landscape
3.1 Global Nanosized Alumina Sales by Manufacturers (2019-2025)
3.2 Global Nanosized Alumina Revenue Market Share by Manufacturers (2019-2025)
3.3 Nanosized Alumina Market Share by Company Type (Tier 1, Tier 2, and Tier 3)
3.4 Global Nanosized Alumina Average Price by Manufacturers (2019-2025)
3.5 Manufacturers Nanosized Alumina Sales Sites, Area Served, Product Type
3.6 Nanosized Alumina Market Competitive Situation and Trends
3.6.1 Nanosized Alumina Market Concentration Rate
3.6.2 Global 5 and 10 Largest Nanosized Alumina Players Market Share by Revenue
3.6.3 Mergers & Acquisitions, Expansion
4 Nanosized Alumina Industry Chain Analysis
4.1 Nanosized Alumina Industry Chain Analysis
4.2 Market Overview of Key Raw Materials
4.3 Midstream Market Analysis
4.4 Downstream Customer Analysis
5 The Development and Dynamics of Nanosized Alumina Market
5.1 Key Development Trends
5.2 Driving Factors
5.3 Market Challenges
5.4 Market Restraints
5.5 Industry News
5.5.1 New Product Developments
5.5.2 Mergers & Acquisitions
5.5.3 Expansions
5.5.4 Collaboration/Supply Contracts
5.6 Industry Policies
6 Nanosized Alumina Market Segmentation by Type
6.1 Evaluation Matrix of Segment Market Development Potential (Type)
6.2 Global Nanosized Alumina Sales Market Share by Type (2019-2025)
6.3 Global Nanosized Alumina Market Size Market Share by Type (2019-2025)
6.4 Global Nanosized Alumina Price by Type (2019-2025)
7 Nanosized Alumina Market Segmentation by Application
7.1 Evaluation Matrix of Segment Market Development Potential (Application)
7.2 Global Nanosized Alumina Market Sales by Application (2019-2025)
7.3 Global Nanosized Alumina Market Size (M USD) by Application (2019-2025)
7.4 Global Nanosized Alumina Sales Growth Rate by Application (2019-2025)
8 Nanosized Alumina Market Consumption by Region
8.1 Global Nanosized Alumina Sales by Region
8.1.1 Global Nanosized Alumina Sales by Region
8.1.2 Global Nanosized Alumina Sales Market Share by Region
8.2 North America
8.2.1 North America Nanosized Alumina Sales by Country
8.2.2 U.S.
8.2.3 Canada
8.2.4 Mexico
8.3 Europe
8.3.1 Europe Nanosized Alumina Sales by Country
8.3.2 Germany
8.3.3 France
8.3.4 U.K.
8.3.5 Italy
8.3.6 Russia
8.4 Asia Pacific
8.4.1 Asia Pacific Nanosized Alumina Sales by Region
8.4.2 China
8.4.3 Japan
8.4.4 South Korea
8.4.5 India
8.4.6 Southeast Asia
8.5 South America
8.5.1 South America Nanosized Alumina Sales by Country
8.5.2 Brazil
8.5.3 Argentina
8.5.4 Columbia
8.6 Middle East and Africa
8.6.1 Middle East and Africa Nanosized Alumina Sales by Region
8.6.2 Saudi Arabia
8.6.3 UAE
8.6.4 Egypt
8.6.5 Nigeria
8.6.6 South Africa
9 Nanosized Alumina Market Production by Region
9.1 Global Production of Nanosized Alumina by Region (2019-2025)
9.2 Global Nanosized Alumina Revenue Market Share by Region (2019-2025)
9.3 Global Nanosized Alumina Production, Revenue, Price and Gross Margin (2019-2025)
9.4 North America Nanosized Alumina Production
9.4.1 North America Nanosized Alumina Production Growth Rate (2019-2025)
9.4.2 North America Nanosized Alumina Production, Revenue, Price and Gross Margin (2019-2025)
9.5 Europe Nanosized Alumina Production
9.5.1 Europe Nanosized Alumina Production Growth Rate (2019-2025)
9.5.2 Europe Nanosized Alumina Production, Revenue, Price and Gross Margin (2019-2025)
9.6 Japan Nanosized Alumina Production (2019-2025)
9.6.1 Japan Nanosized Alumina Production Growth Rate (2019-2025)
9.6.2 Japan Nanosized Alumina Production, Revenue, Price and Gross Margin (2019-2025)
9.7 China Nanosized Alumina Production (2019-2025)
9.7.1 China Nanosized Alumina Production Growth Rate (2019-2025)
9.7.2 China Nanosized Alumina Production, Revenue, Price and Gross Margin (2019-2025)
10 Key Companies Profile
10.1 Advanced Nano Products
10.1.1 Advanced Nano Products Nanosized Alumina Basic Information
10.1.2 Advanced Nano Products Nanosized Alumina Product Overview
10.1.3 Advanced Nano Products Nanosized Alumina Product Market Performance
10.1.4 Advanced Nano Products Business Overview
10.1.5 Advanced Nano Products Nanosized Alumina SWOT Analysis
10.1.6 Advanced Nano Products Recent Developments
10.2 Alcoa
10.2.1 Alcoa Nanosized Alumina Basic Information
10.2.2 Alcoa Nanosized Alumina Product Overview
10.2.3 Alcoa Nanosized Alumina Product Market Performance
10.2.4 Alcoa Business Overview
10.2.5 Alcoa Nanosized Alumina SWOT Analysis
10.2.6 Alcoa Recent Developments
10.3 Alpha Nanomaterials
10.3.1 Alpha Nanomaterials Nanosized Alumina Basic Information
10.3.2 Alpha Nanomaterials Nanosized Alumina Product Overview
10.3.3 Alpha Nanomaterials Nanosized Alumina Product Market Performance
10.3.4 Alpha Nanomaterials Nanosized Alumina SWOT Analysis
10.3.5 Alpha Nanomaterials Business Overview
10.3.6 Alpha Nanomaterials Recent Developments
10.4 American Elements
10.4.1 American Elements Nanosized Alumina Basic Information
10.4.2 American Elements Nanosized Alumina Product Overview
10.4.3 American Elements Nanosized Alumina Product Market Performance
10.4.4 American Elements Business Overview
10.4.5 American Elements Recent Developments
10.5 Baikowski Chimie
10.5.1 Baikowski Chimie Nanosized Alumina Basic Information
10.5.2 Baikowski Chimie Nanosized Alumina Product Overview
10.5.3 Baikowski Chimie Nanosized Alumina Product Market Performance
10.5.4 Baikowski Chimie Business Overview
10.5.5 Baikowski Chimie Recent Developments
10.6 BYK-Chemie
10.6.1 BYK-Chemie Nanosized Alumina Basic Information
10.6.2 BYK-Chemie Nanosized Alumina Product Overview
10.6.3 BYK-Chemie Nanosized Alumina Product Market Performance
10.6.4 BYK-Chemie Business Overview
10.6.5 BYK-Chemie Recent Developments
10.7 Chengdu Alpha Nanotechology Corporation
10.7.1 Chengdu Alpha Nanotechology Corporation Nanosized Alumina Basic Information
10.7.2 Chengdu Alpha Nanotechology Corporation Nanosized Alumina Product Overview
10.7.3 Chengdu Alpha Nanotechology Corporation Nanosized Alumina Product Market Performance
10.7.4 Chengdu Alpha Nanotechology Corporation Business Overview
10.7.5 Chengdu Alpha Nanotechology Corporation Recent Developments
10.8 Eprui Nanoparticles and Microsphers
10.8.1 Eprui Nanoparticles and Microsphers Nanosized Alumina Basic Information
10.8.2 Eprui Nanoparticles and Microsphers Nanosized Alumina Product Overview
10.8.3 Eprui Nanoparticles and Microsphers Nanosized Alumina Product Market Performance
10.8.4 Eprui Nanoparticles and Microsphers Business Overview
10.8.5 Eprui Nanoparticles and Microsphers Recent Developments
10.9 Forever Chemical
10.9.1 Forever Chemical Nanosized Alumina Basic Information
10.9.2 Forever Chemical Nanosized Alumina Product Overview
10.9.3 Forever Chemical Nanosized Alumina Product Market Performance
10.9.4 Forever Chemical Business Overview
10.9.5 Forever Chemical Recent Developments
10.10 Inframat
10.10.1 Inframat Nanosized Alumina Basic Information
10.10.2 Inframat Nanosized Alumina Product Overview
10.10.3 Inframat Nanosized Alumina Product Market Performance
10.10.4 Inframat Business Overview
10.10.5 Inframat Recent Developments
10.11 Io-Litec Nanomaterials
10.11.1 Io-Litec Nanomaterials Nanosized Alumina Basic Information
10.11.2 Io-Litec Nanomaterials Nanosized Alumina Product Overview
10.11.3 Io-Litec Nanomaterials Nanosized Alumina Product Market Performance
10.11.4 Io-Litec Nanomaterials Business Overview
10.11.5 Io-Litec Nanomaterials Recent Developments
10.12 Kawaken Fine Chemical
10.12.1 Kawaken Fine Chemical Nanosized Alumina Basic Information
10.12.2 Kawaken Fine Chemical Nanosized Alumina Product Overview
10.12.3 Kawaken Fine Chemical Nanosized Alumina Product Market Performance
10.12.4 Kawaken Fine Chemical Business Overview
10.12.5 Kawaken Fine Chemical Recent Developments
10.13 Meliorum Technologies
10.13.1 Meliorum Technologies Nanosized Alumina Basic Information
10.13.2 Meliorum Technologies Nanosized Alumina Product Overview
10.13.3 Meliorum Technologies Nanosized Alumina Product Market Performance
10.13.4 Meliorum Technologies Business Overview
10.13.5 Meliorum Technologies Recent Developments
10.14 Sumitomo Chemical
10.14.1 Sumitomo Chemical Nanosized Alumina Basic Information
10.14.2 Sumitomo Chemical Nanosized Alumina Product Overview
10.14.3 Sumitomo Chemical Nanosized Alumina Product Market Performance
10.14.4 Sumitomo Chemical Business Overview
10.14.5 Sumitomo Chemical Recent Developments
11 Nanosized Alumina Market Forecast by Region
11.1 Global Nanosized Alumina Market Size Forecast
11.2 Global Nanosized Alumina Market Forecast by Region
11.2.1 North America Market Size Forecast by Country
11.2.2 Europe Nanosized Alumina Market Size Forecast by Country
11.2.3 Asia Pacific Nanosized Alumina Market Size Forecast by Region
11.2.4 South America Nanosized Alumina Market Size Forecast by Country
11.2.5 Middle East and Africa Forecasted Consumption of Nanosized Alumina by Country
12 Forecast Market by Type and by Application (2025-2032)
12.1 Global Nanosized Alumina Market Forecast by Type (2025-2032)
12.1.1 Global Forecasted Sales of Nanosized Alumina by Type (2025-2032)
12.1.2 Global Nanosized Alumina Market Size Forecast by Type (2025-2032)
12.1.3 Global Forecasted Price of Nanosized Alumina by Type (2025-2032)
12.2 Global Nanosized Alumina Market Forecast by Application (2025-2032)
12.2.1 Global Nanosized Alumina Sales (K MT) Forecast by Application
12.2.2 Global Nanosized Alumina Market Size (M USD) Forecast by Application (2025-2032)
13 Conclusion and Key Findings
LIST OF TABLES & FIGURES
List of Tables
Table 1. Introduction of the Type
Table 2. Introduction of the Application
Table 3. Market Size (M USD) Segment Executive Summary
Table 4. Nanosized Alumina Market Size Comparison by Region (M USD)
Table 5. Global Nanosized Alumina Sales (K MT) by Manufacturers (2019-2025)
Table 6. Global Nanosized Alumina Sales Market Share by Manufacturers (2019-2025)
Table 7. Global Nanosized Alumina Revenue (M USD) by Manufacturers (2019-2025)
Table 8. Global Nanosized Alumina Revenue Share by Manufacturers (2019-2025)
Table 9. Company Type (Tier 1, Tier 2, and Tier 3) & (based on the Revenue in Nanosized Alumina as of 2022)
Table 10. Global Market Nanosized Alumina Average Price (USD/MT) of Key Manufacturers (2019-2025)
Table 11. Manufacturers Nanosized Alumina Sales Sites and Area Served
Table 12. Manufacturers Nanosized Alumina Product Type
Table 13. Global Nanosized Alumina Manufacturers Market Concentration Ratio (CR5 and HHI)
Table 14. Mergers & Acquisitions, Expansion Plans
Table 15. Industry Chain Map of Nanosized Alumina
Table 16. Market Overview of Key Raw Materials
Table 17. Midstream Market Analysis
Table 18. Downstream Customer Analysis
Table 19. Key Development Trends
Table 20. Driving Factors
Table 21. Nanosized Alumina Market Challenges
Table 22. Global Nanosized Alumina Sales by Type (K MT)
Table 23. Global Nanosized Alumina Market Size by Type (M USD)
Table 24. Global Nanosized Alumina Sales (K MT) by Type (2019-2025)
Table 25. Global Nanosized Alumina Sales Market Share by Type (2019-2025)
Table 26. Global Nanosized Alumina Market Size (M USD) by Type (2019-2025)
Table 27. Global Nanosized Alumina Market Size Share by Type (2019-2025)
Table 28. Global Nanosized Alumina Price (USD/MT) by Type (2019-2025)
Table 29. Global Nanosized Alumina Sales (K MT) by Application
Table 30. Global Nanosized Alumina Market Size by Application
Table 31. Global Nanosized Alumina Sales by Application (2019-2025) & (K MT)
Table 32. Global Nanosized Alumina Sales Market Share by Application (2019-2025)
Table 33. Global Nanosized Alumina Sales by Application (2019-2025) & (M USD)
Table 34. Global Nanosized Alumina Market Share by Application (2019-2025)
Table 35. Global Nanosized Alumina Sales Growth Rate by Application (2019-2025)
Table 36. Global Nanosized Alumina Sales by Region (2019-2025) & (K MT)
Table 37. Global Nanosized Alumina Sales Market Share by Region (2019-2025)
Table 38. North America Nanosized Alumina Sales by Country (2019-2025) & (K MT)
Table 39. Europe Nanosized Alumina Sales by Country (2019-2025) & (K MT)
Table 40. Asia Pacific Nanosized Alumina Sales by Region (2019-2025) & (K MT)
Table 41. South America Nanosized Alumina Sales by Country (2019-2025) & (K MT)
Table 42. Middle East and Africa Nanosized Alumina Sales by Region (2019-2025) & (K MT)
Table 43. Global Nanosized Alumina Production (K MT) by Region (2019-2025)
Table 44. Global Nanosized Alumina Revenue (US$ Million) by Region (2019-2025)
Table 45. Global Nanosized Alumina Revenue Market Share by Region (2019-2025)
Table 46. Global Nanosized Alumina Production (K MT), Revenue (US$ Million), Price (USD/MT) and Gross Margin (2019-2025)
Table 47. North America Nanosized Alumina Production (K MT), Revenue (US$ Million), Price (USD/MT) and Gross Margin (2019-2025)
Table 48. Europe Nanosized Alumina Production (K MT), Revenue (US$ Million), Price (USD/MT) and Gross Margin (2019-2025)
Table 49. Japan Nanosized Alumina Production (K MT), Revenue (US$ Million), Price (USD/MT) and Gross Margin (2019-2025)
Table 50. China Nanosized Alumina Production (K MT), Revenue (US$ Million), Price (USD/MT) and Gross Margin (2019-2025)
Table 51. Advanced Nano Products Nanosized Alumina Basic Information
Table 52. Advanced Nano Products Nanosized Alumina Product Overview
Table 53. Advanced Nano Products Nanosized Alumina Sales (K MT), Revenue (M USD), Price (USD/MT) and Gross Margin (2019-2025)
Table 54. Advanced Nano Products Business Overview
Table 55. Advanced Nano Products Nanosized Alumina SWOT Analysis
Table 56. Advanced Nano Products Recent Developments
Table 57. Alcoa Nanosized Alumina Basic Information
Table 58. Alcoa Nanosized Alumina Product Overview
Table 59. Alcoa Nanosized Alumina Sales (K MT), Revenue (M USD), Price (USD/MT) and Gross Margin (2019-2025)
Table 60. Alcoa Business Overview
Table 61. Alcoa Nanosized Alumina SWOT Analysis
Table 62. Alcoa Recent Developments
Table 63. Alpha Nanomaterials Nanosized Alumina Basic Information
Table 64. Alpha Nanomaterials Nanosized Alumina Product Overview
Table 65. Alpha Nanomaterials Nanosized Alumina Sales (K MT), Revenue (M USD), Price (USD/MT) and Gross Margin (2019-2025)
Table 66. Alpha Nanomaterials Nanosized Alumina SWOT Analysis
Table 67. Alpha Nanomaterials Business Overview
Table 68. Alpha Nanomaterials Recent Developments
Table 69. American Elements Nanosized Alumina Basic Information
Table 70. American Elements Nanosized Alumina Product Overview
Table 71. American Elements Nanosized Alumina Sales (K MT), Revenue (M USD), Price (USD/MT) and Gross Margin (2019-2025)
Table 72. American Elements Business Overview
Table 73. American Elements Recent Developments
Table 74. Baikowski Chimie Nanosized Alumina Basic Information
Table 75. Baikowski Chimie Nanosized Alumina Product Overview
Table 76. Baikowski Chimie Nanosized Alumina Sales (K MT), Revenue (M USD), Price (USD/MT) and Gross Margin (2019-2025)
Table 77. Baikowski Chimie Business Overview
Table 78. Baikowski Chimie Recent Developments
Table 79. BYK-Chemie Nanosized Alumina Basic Information
Table 80. BYK-Chemie Nanosized Alumina Product Overview
Table 81. BYK-Chemie Nanosized Alumina Sales (K MT), Revenue (M USD), Price (USD/MT) and Gross Margin (2019-2025)
Table 82. BYK-Chemie Business Overview
Table 83. BYK-Chemie Recent Developments
Table 84. Chengdu Alpha Nanotechology Corporation Nanosized Alumina Basic Information
Table 85. Chengdu Alpha Nanotechology Corporation Nanosized Alumina Product Overview
Table 86. Chengdu Alpha Nanotechology Corporation Nanosized Alumina Sales (K MT), Revenue (M USD), Price (USD/MT) and Gross Margin (2019-2025)
Table 87. Chengdu Alpha Nanotechology Corporation Business Overview
Table 88. Chengdu Alpha Nanotechology Corporation Recent Developments
Table 89. Eprui Nanoparticles and Microsphers Nanosized Alumina Basic Information
Table 90. Eprui Nanoparticles and Microsphers Nanosized Alumina Product Overview
Table 91. Eprui Nanoparticles and Microsphers Nanosized Alumina Sales (K MT), Revenue (M USD), Price (USD/MT) and Gross Margin (2019-2025)
Table 92. Eprui Nanoparticles and Microsphers Business Overview
Table 93. Eprui Nanoparticles and Microsphers Recent Developments
Table 94. Forever Chemical Nanosized Alumina Basic Information
Table 95. Forever Chemical Nanosized Alumina Product Overview
Table 96. Forever Chemical Nanosized Alumina Sales (K MT), Revenue (M USD), Price (USD/MT) and Gross Margin (2019-2025)
Table 97. Forever Chemical Business Overview
Table 98. Forever Chemical Recent Developments
Table 99. Inframat Nanosized Alumina Basic Information
Table 100. Inframat Nanosized Alumina Product Overview
Table 101. Inframat Nanosized Alumina Sales (K MT), Revenue (M USD), Price (USD/MT) and Gross Margin (2019-2025)
Table 102. Inframat Business Overview
Table 103. Inframat Recent Developments
Table 104. Io-Litec Nanomaterials Nanosized Alumina Basic Information
Table 105. Io-Litec Nanomaterials Nanosized Alumina Product Overview
Table 106. Io-Litec Nanomaterials Nanosized Alumina Sales (K MT), Revenue (M USD), Price (USD/MT) and Gross Margin (2019-2025)
Table 107. Io-Litec Nanomaterials Business Overview
Table 108. Io-Litec Nanomaterials Recent Developments
Table 109. Kawaken Fine Chemical Nanosized Alumina Basic Information
Table 110. Kawaken Fine Chemical Nanosized Alumina Product Overview
Table 111. Kawaken Fine Chemical Nanosized Alumina Sales (K MT), Revenue (M USD), Price (USD/MT) and Gross Margin (2019-2025)
Table 112. Kawaken Fine Chemical Business Overview
Table 113. Kawaken Fine Chemical Recent Developments
Table 114. Meliorum Technologies Nanosized Alumina Basic Information
Table 115. Meliorum Technologies Nanosized Alumina Product Overview
Table 116. Meliorum Technologies Nanosized Alumina Sales (K MT), Revenue (M USD), Price (USD/MT) and Gross Margin (2019-2025)
Table 117. Meliorum Technologies Business Overview
Table 118. Meliorum Technologies Recent Developments
Table 119. Sumitomo Chemical Nanosized Alumina Basic Information
Table 120. Sumitomo Chemical Nanosized Alumina Product Overview
Table 121. Sumitomo Chemical Nanosized Alumina Sales (K MT), Revenue (M USD), Price (USD/MT) and Gross Margin (2019-2025)
Table 122. Sumitomo Chemical Business Overview
Table 123. Sumitomo Chemical Recent Developments
Table 124. Global Nanosized Alumina Sales Forecast by Region (2025-2032) & (K MT)
Table 125. Global Nanosized Alumina Market Size Forecast by Region (2025-2032) & (M USD)
Table 126. North America Nanosized Alumina Sales Forecast by Country (2025-2032) & (K MT)
Table 127. North America Nanosized Alumina Market Size Forecast by Country (2025-2032) & (M USD)
Table 128. Europe Nanosized Alumina Sales Forecast by Country (2025-2032) & (K MT)
Table 129. Europe Nanosized Alumina Market Size Forecast by Country (2025-2032) & (M USD)
Table 130. Asia Pacific Nanosized Alumina Sales Forecast by Region (2025-2032) & (K MT)
Table 131. Asia Pacific Nanosized Alumina Market Size Forecast by Region (2025-2032) & (M USD)
Table 132. South America Nanosized Alumina Sales Forecast by Country (2025-2032) & (K MT)
Table 133. South America Nanosized Alumina Market Size Forecast by Country (2025-2032) & (M USD)
Table 134. Middle East and Africa Nanosized Alumina Consumption Forecast by Country (2025-2032) & (Units)
Table 135. Middle East and Africa Nanosized Alumina Market Size Forecast by Country (2025-2032) & (M USD)
Table 136. Global Nanosized Alumina Sales Forecast by Type (2025-2032) & (K MT)
Table 137. Global Nanosized Alumina Market Size Forecast by Type (2025-2032) & (M USD)
Table 138. Global Nanosized Alumina Price Forecast by Type (2025-2032) & (USD/MT)
Table 139. Global Nanosized Alumina Sales (K MT) Forecast by Application (2025-2032)
Table 140. Global Nanosized Alumina Market Size Forecast by Application (2025-2032) & (M USD)
List of Figures
Figure 1. Product Picture of Nanosized Alumina
Figure 2. Data Triangulation
Figure 3. Key Caveats
Figure 4. Global Nanosized Alumina Market Size (M USD), 2019-2032
Figure 5. Global Nanosized Alumina Market Size (M USD) (2019-2032)
Figure 6. Global Nanosized Alumina Sales (K MT) & (2019-2032)
Figure 7. Evaluation Matrix of Segment Market Development Potential (Type)
Figure 8. Evaluation Matrix of Segment Market Development Potential (Application)
Figure 9. Evaluation Matrix of Regional Market Development Potential
Figure 10. Nanosized Alumina Market Size by Country (M USD)
Figure 11. Nanosized Alumina Sales Share by Manufacturers in 2023
Figure 12. Global Nanosized Alumina Revenue Share by Manufacturers in 2023
Figure 13. Nanosized Alumina Market Share by Company Type (Tier 1, Tier 2 and Tier 3): 2023
Figure 14. Global Market Nanosized Alumina Average Price (USD/MT) of Key Manufacturers in 2023
Figure 15. The Global 5 and 10 Largest Players: Market Share by Nanosized Alumina Revenue in 2023
Figure 16. Evaluation Matrix of Segment Market Development Potential (Type)
Figure 17. Global Nanosized Alumina Market Share by Type
Figure 18. Sales Market Share of Nanosized Alumina by Type (2019-2025)
Figure 19. Sales Market Share of Nanosized Alumina by Type in 2023
Figure 20. Market Size Share of Nanosized Alumina by Type (2019-2025)
Figure 21. Market Size Market Share of Nanosized Alumina by Type in 2023
Figure 22. Evaluation Matrix of Segment Market Development Potential (Application)
Figure 23. Global Nanosized Alumina Market Share by Application
Figure 24. Global Nanosized Alumina Sales Market Share by Application (2019-2025)
Figure 25. Global Nanosized Alumina Sales Market Share by Application in 2023
Figure 26. Global Nanosized Alumina Market Share by Application (2019-2025)
Figure 27. Global Nanosized Alumina Market Share by Application in 2023
Figure 28. Global Nanosized Alumina Sales Growth Rate by Application (2019-2025)
Figure 29. Global Nanosized Alumina Sales Market Share by Region (2019-2025)
Figure 30. North America Nanosized Alumina Sales and Growth Rate (2019-2025) & (K MT)
Figure 31. North America Nanosized Alumina Sales Market Share by Country in 2023
Figure 32. U.S. Nanosized Alumina Sales and Growth Rate (2019-2025) & (K MT)
Figure 33. Canada Nanosized Alumina Sales (K MT) and Growth Rate (2019-2025)
Figure 34. Mexico Nanosized Alumina Sales (Units) and Growth Rate (2019-2025)
Figure 35. Europe Nanosized Alumina Sales and Growth Rate (2019-2025) & (K MT)
Figure 36. Europe Nanosized Alumina Sales Market Share by Country in 2023
Figure 37. Germany Nanosized Alumina Sales and Growth Rate (2019-2025) & (K MT)
Figure 38. France Nanosized Alumina Sales and Growth Rate (2019-2025) & (K MT)
Figure 39. U.K. Nanosized Alumina Sales and Growth Rate (2019-2025) & (K MT)
Figure 40. Italy Nanosized Alumina Sales and Growth Rate (2019-2025) & (K MT)
Figure 41. Russia Nanosized Alumina Sales and Growth Rate (2019-2025) & (K MT)
Figure 42. Asia Pacific Nanosized Alumina Sales and Growth Rate (K MT)
Figure 43. Asia Pacific Nanosized Alumina Sales Market Share by Region in 2023
Figure 44. China Nanosized Alumina Sales and Growth Rate (2019-2025) & (K MT)
Figure 45. Japan Nanosized Alumina Sales and Growth Rate (2019-2025) & (K MT)
Figure 46. South Korea Nanosized Alumina Sales and Growth Rate (2019-2025) & (K MT)
Figure 47. India Nanosized Alumina Sales and Growth Rate (2019-2025) & (K MT)
Figure 48. Southeast Asia Nanosized Alumina Sales and Growth Rate (2019-2025) & (K MT)
Figure 49. South America Nanosized Alumina Sales and Growth Rate (K MT)
Figure 50. South America Nanosized Alumina Sales Market Share by Country in 2023
Figure 51. Brazil Nanosized Alumina Sales and Growth Rate (2019-2025) & (K MT)
Figure 52. Argentina Nanosized Alumina Sales and Growth Rate (2019-2025) & (K MT)
Figure 53. Columbia Nanosized Alumina Sales and Growth Rate (2019-2025) & (K MT)
Figure 54. Middle East and Africa Nanosized Alumina Sales and Growth Rate (K MT)
Figure 55. Middle East and Africa Nanosized Alumina Sales Market Share by Region in 2023
Figure 56. Saudi Arabia Nanosized Alumina Sales and Growth Rate (2019-2025) & (K MT)
Figure 57. UAE Nanosized Alumina Sales and Growth Rate (2019-2025) & (K MT)
Figure 58. Egypt Nanosized Alumina Sales and Growth Rate (2019-2025) & (K MT)
Figure 59. Nigeria Nanosized Alumina Sales and Growth Rate (2019-2025) & (K MT)
Figure 60. South Africa Nanosized Alumina Sales and Growth Rate (2019-2025) & (K MT)
Figure 61. Global Nanosized Alumina Production Market Share by Region (2019-2025)
Figure 62. North America Nanosized Alumina Production (K MT) Growth Rate (2019-2025)
Figure 63. Europe Nanosized Alumina Production (K MT) Growth Rate (2019-2025)
Figure 64. Japan Nanosized Alumina Production (K MT) Growth Rate (2019-2025)
Figure 65. China Nanosized Alumina Production (K MT) Growth Rate (2019-2025)
Figure 66. Global Nanosized Alumina Sales Forecast by Volume (2019-2032) & (K MT)
Figure 67. Global Nanosized Alumina Market Size Forecast by Value (2019-2032) & (M USD)
Figure 68. Global Nanosized Alumina Sales Market Share Forecast by Type (2025-2032)
Figure 69. Global Nanosized Alumina Market Share Forecast by Type (2025-2032)
Figure 70. Global Nanosized Alumina Sales Forecast by Application (2025-2032)
Figure 71. Global Nanosized Alumina Market Share Forecast by Application (2025-2032)

