NB-IoT Ultrasonic Smart Gas Meters are advanced electronic devices that measure gas consumption without the need for mechanical moving parts. These meters utilize ultrasonic waves to detect gas flow with high precision, offering immediate response times to changes in flow and no pressure loss. This cutting-edge technology is particularly valuable for its accuracy, reliability, and ability to remotely monitor gas usage, contributing to the optimization of energy usage, operational efficiency, and cost savings in various sectors, including residential, commercial, and industrial applications.
These smart meters operate on Narrowband IoT (NB-IoT) networks, a global standard for low-power wide-area (LPWA) communication. This provides significant advantages in terms of connectivity in remote or hard-to-reach locations, enabling real-time data transmission and advanced data analytics.
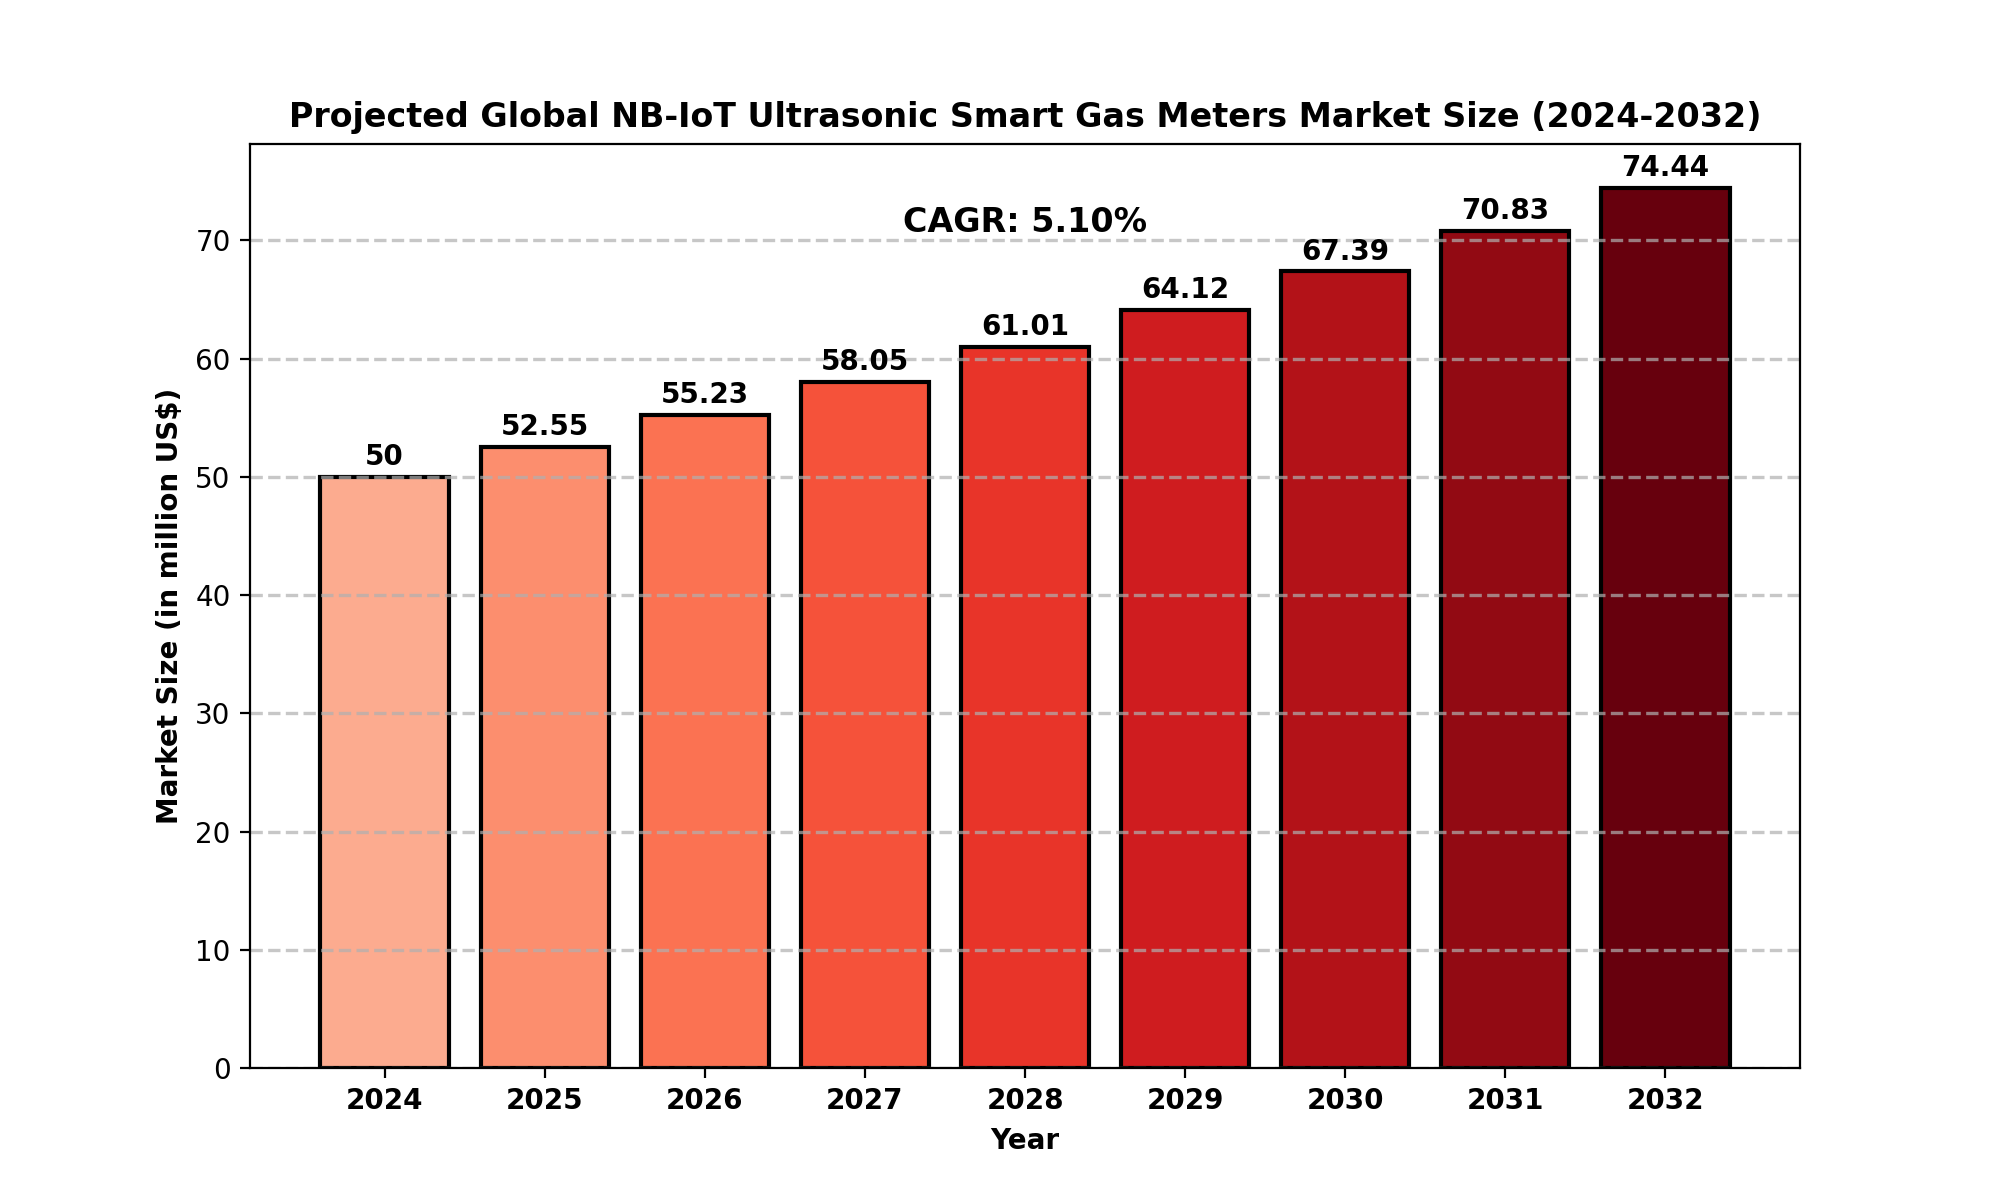
Market Size
The global NB-IoT Ultrasonic Smart Gas Meters Market is expected to experience significant growth over the forecast period. In 2024, the market size is estimated to be valued at USD 50 million, with projections to reach approximately USD 74.44 million by 2032.
This represents a compound annual growth rate (CAGR) of 5.10% during the forecast period. The market is fueled by increasing adoption of smart metering systems, advancements in IoT technologies, and a growing demand for efficient energy management solutions.
Historically, the market has benefitted from the rapid proliferation of IoT devices and the need for more accurate and automated gas monitoring systems, particularly in urban environments. The increasing focus on energy conservation, sustainability, and smart city initiatives further propels the market’s expansion.
Market Dynamics
Drivers
Several factors are driving the growth of the NB-IoT Ultrasonic Smart Gas Meters market:
-
Growing Adoption of IoT Technologies: The increasing reliance on IoT for automation and remote monitoring in various industries boosts the demand for NB-IoT smart meters.
-
Energy Efficiency and Sustainability: These meters help improve energy usage efficiency, a key factor as governments and businesses aim to reduce carbon footprints.
-
Cost Reduction: By eliminating the need for manual meter reading and reducing errors in data collection, NB-IoT Ultrasonic Smart Gas Meters help lower operational costs.
-
Regulatory Support: Many governments are mandating the implementation of smart meters to improve energy management and reduce wastage, thus fueling market growth.
Restraints
Despite the growth prospects, the market faces some challenges:
-
High Initial Installation Costs: The upfront cost of installing these smart meters can be a barrier for some businesses and governments, particularly in developing countries.
-
Complex Infrastructure Requirements: Installing and maintaining the necessary infrastructure for NB-IoT networks in remote areas can be challenging, limiting the reach of these smart meters in certain regions.
Opportunities
The market presents significant opportunities for expansion:
-
Emerging Markets: Countries in Asia-Pacific, Latin America, and Africa are witnessing urbanization and infrastructure upgrades, offering a large untapped market for smart gas meters.
-
Integration with Smart City Projects: The development of smart cities worldwide is a major opportunity for the integration of smart metering solutions, including NB-IoT Ultrasonic Smart Gas Meters.
-
Advancements in Metering Technology: Continuous improvements in sensor technologies, data analytics, and communication networks offer the potential for enhanced product offerings and improved operational efficiencies.
Challenges
Some of the ongoing challenges include:
-
Data Security Concerns: As with any IoT-enabled device, ensuring the security of data transmitted via NB-IoT networks is crucial to prevent unauthorized access or cyberattacks.
-
Market Fragmentation: The presence of several key players, each with its own offerings and standards, creates a fragmented market landscape, which could slow down overall market growth.
Regional Analysis
North America
The North American market for NB-IoT Ultrasonic Smart Gas Meters was valued at USD 14.19 million in 2024. This region is expected to grow at a CAGR of 4.37% during the forecast period. The United States and Canada are key drivers, with extensive investments in smart infrastructure and IoT technologies. Governments and utility companies in this region are keen on reducing energy consumption and improving operational efficiency, further promoting the adoption of smart gas meters.
Europe
Europe is one of the leading regions for the adoption of NB-IoT Ultrasonic Smart Gas Meters. Countries like Germany, the UK, and France are at the forefront, driven by regulatory initiatives such as the EU’s Energy Efficiency Directive and sustainability targets. The region’s strong focus on energy conservation and smart grid technologies creates a favorable environment for the market's growth.
Asia-Pacific
The Asia-Pacific region is expected to witness the fastest growth during the forecast period. Countries like China, India, and Japan are rapidly adopting smart metering systems to manage their growing energy demands. With significant urbanization, industrialization, and government-driven initiatives in the smart city sector, the demand for NB-IoT Ultrasonic Smart Gas Meters is anticipated to rise sharply in the coming years.
South America and MEA
In South America, Brazil and Argentina are key markets, while the Middle East and Africa (MEA) region are emerging as new growth frontiers. Both regions are investing in smart infrastructure, with a focus on energy efficiency and remote monitoring, opening opportunities for the NB-IoT smart gas meters market.
Competitor Analysis
The market for NB-IoT Ultrasonic Smart Gas Meters is highly competitive, with several key players driving technological advancements and market share:
-
Cavagna Group: A leading provider of gas meters and smart metering solutions.
-
Flonidan (AVK Group): Known for innovative solutions in ultrasonic gas metering technology.
-
Smartico: A key player in providing smart metering solutions that leverage NB-IoT technology.
-
Landis+Gyr: Specializes in smart grid technologies and advanced metering systems.
-
Xylem: Offers a range of IoT-based smart water and gas meters.
These companies are focusing on expanding their product portfolios, enhancing meter accuracy, and improving connectivity through the integration of NB-IoT technology.
Global NB-IoT Ultrasonic Smart Gas Meters: Market Segmentation Analysis
This report provides a deep insight into the global NB-IoT Ultrasonic Smart Gas Meters market, covering all its essential aspects. This ranges from a macro overview of the market to micro details of the market size, competitive landscape, development trend, niche market, key market drivers and challenges, SWOT analysis, value chain analysis, etc.
The analysis helps the reader to shape the competition within the industries and strategies for the competitive environment to enhance the potential profit. Furthermore, it provides a simple framework for evaluating and assessing the position of the business organization. The report structure also focuses on the competitive landscape of the Global NB-IoT Ultrasonic Smart Gas Meters Market. This report introduces in detail the market share, market performance, product situation, operation situation, etc., of the main players, which helps the readers in the industry to identify the main competitors and deeply understand the competition pattern of the market.
In a word, this report is a must-read for industry players, investors, researchers, consultants, business strategists, and all those who have any kind of stake or are planning to foray into the NB-IoT Ultrasonic Smart Gas Meters market in any manner.
Market Segmentation (by Application)
-
Residential
-
Commercial
-
Industrial
Market Segmentation (by Type)
-
Size: G-1.6
-
Size: G-2.5
-
Size: G-4
-
Size: G-6
Key Company
-
Cavagna Group
-
Flonidan (AVK Group)
-
Smartico
-
Landis+Gyr
-
Xylem
-
OSAKI Group
-
Krohne
-
Toyo Gas
-
Elster Instromet (Honeywell International)
-
Pietro Fiorentini
-
PowerCom
-
Siemens
-
Lauris Technologies
-
Viewshine
-
Goldcard Smart Group
-
Zhejiang Chint Instrument & Meter
-
Suntront Technolocy
-
HANGZHOU INNOVER TECHNOLOGY
-
Holley Technology
-
Zhejiang Roxyne Smart Meters
Geographic Segmentation
-
North America (USA, Canada, Mexico)
-
Europe (Germany, UK, France, Russia, Italy, Rest of Europe)
-
Asia-Pacific (China, Japan, South Korea, India, Southeast Asia, Rest of Asia-Pacific)
-
South America (Brazil, Argentina, Columbia, Rest of South America)
-
The Middle East and Africa (Saudi Arabia, UAE, Egypt, Nigeria, South Africa, Rest of MEA)
FAQ
What is the current market size of NB-IoT Ultrasonic Smart Gas Meters?
- The global market size is estimated at USD 50 million in 2024 and is projected to reach USD 78.23 million by 2032.
Which are the key companies operating in the NB-IoT Ultrasonic Smart Gas Meters market?
- Key companies include Cavagna Group, Flonidan, Smartico, Landis+Gyr, Xylem, and many others.
What are the key growth drivers in the NB-IoT Ultrasonic Smart Gas Meters market?
- Growth drivers include the increasing adoption of IoT technologies, energy efficiency initiatives, cost reductions in operations, and regulatory mandates.
Which regions dominate the NB-IoT Ultrasonic Smart Gas Meters market?
- North America and Europe are leading regions, with significant market shares. However, Asia-Pacific is expected to witness the fastest growth.
What are the emerging trends in the NB-IoT Ultrasonic Smart Gas Meters market?
- Emerging trends include the integration of these meters with smart city projects, advancements in IoT technologies, and the growing importance of remote monitoring and data analytics.
Key Benefits of This Market Research:
- Industry drivers, restraints, and opportunities covered in the study
- Neutral perspective on the market performance
- Recent industry trends and developments
- Competitive landscape & strategies of key players
- Potential & niche segments and regions exhibiting promising growth covered
- Historical, current, and projected market size, in terms of value
- In-depth analysis of the NB-IoT Ultrasonic Smart Gas Meters Market
- Overview of the regional outlook of the NB-IoT Ultrasonic Smart Gas Meters Market:
Key Reasons to Buy this Report:
- Access to date statistics compiled by our researchers. These provide you with historical and forecast data, which is analyzed to tell you why your market is set to change
- This enables you to anticipate market changes to remain ahead of your competitors
- You will be able to copy data from the Excel spreadsheet straight into your marketing plans, business presentations, or other strategic documents
- The concise analysis, clear graph, and table format will enable you to pinpoint the information you require quickly
- Provision of market value data for each segment and sub-segment
- Indicates the region and segment that is expected to witness the fastest growth as well as to dominate the market
- Analysis by geography highlighting the consumption of the product/service in the region as well as indicating the factors that are affecting the market within each region
- Competitive landscape which incorporates the market ranking of the major players, along with new service/product launches, partnerships, business expansions, and acquisitions in the past five years of companies profiled
- Extensive company profiles comprising of company overview, company insights, product benchmarking, and SWOT analysis for the major market players
- The current as well as the future market outlook of the industry concerning recent developments which involve growth opportunities and drivers as well as challenges and restraints of both emerging as well as developed regions
- Includes in-depth analysis of the market from various perspectives through Porter
TABLE OF CONTENTS
Table of Contents
1 Research Methodology and Statistical Scope
1.1 Market Definition and Statistical Scope of NB-IoT Ultrasonic Smart Gas Meters
1.2 Key Market Segments
1.2.1 NB-IoT Ultrasonic Smart Gas Meters Segment by Type
1.2.2 NB-IoT Ultrasonic Smart Gas Meters Segment by Application
1.3 Methodology & Sources of Information
1.3.1 Research Methodology
1.3.2 Research Process
1.3.3 Market Breakdown and Data Triangulation
1.3.4 Base Year
1.3.5 Report Assumptions & Caveats
2 NB-IoT Ultrasonic Smart Gas Meters Market Overview
2.1 Global Market Overview
2.1.1 Global NB-IoT Ultrasonic Smart Gas Meters Market Size (M USD) Estimates and Forecasts (2019-2032)
2.1.2 Global NB-IoT Ultrasonic Smart Gas Meters Sales Estimates and Forecasts (2019-2032)
2.2 Market Segment Executive Summary
2.3 Global Market Size by Region
3 NB-IoT Ultrasonic Smart Gas Meters Market Competitive Landscape
3.1 Global NB-IoT Ultrasonic Smart Gas Meters Sales by Manufacturers (2019-2025)
3.2 Global NB-IoT Ultrasonic Smart Gas Meters Revenue Market Share by Manufacturers (2019-2025)
3.3 NB-IoT Ultrasonic Smart Gas Meters Market Share by Company Type (Tier 1, Tier 2, and Tier 3)
3.4 Global NB-IoT Ultrasonic Smart Gas Meters Average Price by Manufacturers (2019-2025)
3.5 Manufacturers NB-IoT Ultrasonic Smart Gas Meters Sales Sites, Area Served, Product Type
3.6 NB-IoT Ultrasonic Smart Gas Meters Market Competitive Situation and Trends
3.6.1 NB-IoT Ultrasonic Smart Gas Meters Market Concentration Rate
3.6.2 Global 5 and 10 Largest NB-IoT Ultrasonic Smart Gas Meters Players Market Share by Revenue
3.6.3 Mergers & Acquisitions, Expansion
4 NB-IoT Ultrasonic Smart Gas Meters Industry Chain Analysis
4.1 NB-IoT Ultrasonic Smart Gas Meters Industry Chain Analysis
4.2 Market Overview of Key Raw Materials
4.3 Midstream Market Analysis
4.4 Downstream Customer Analysis
5 The Development and Dynamics of NB-IoT Ultrasonic Smart Gas Meters Market
5.1 Key Development Trends
5.2 Driving Factors
5.3 Market Challenges
5.4 Market Restraints
5.5 Industry News
5.5.1 New Product Developments
5.5.2 Mergers & Acquisitions
5.5.3 Expansions
5.5.4 Collaboration/Supply Contracts
5.6 Industry Policies
6 NB-IoT Ultrasonic Smart Gas Meters Market Segmentation by Type
6.1 Evaluation Matrix of Segment Market Development Potential (Type)
6.2 Global NB-IoT Ultrasonic Smart Gas Meters Sales Market Share by Type (2019-2025)
6.3 Global NB-IoT Ultrasonic Smart Gas Meters Market Size Market Share by Type (2019-2025)
6.4 Global NB-IoT Ultrasonic Smart Gas Meters Price by Type (2019-2025)
7 NB-IoT Ultrasonic Smart Gas Meters Market Segmentation by Application
7.1 Evaluation Matrix of Segment Market Development Potential (Application)
7.2 Global NB-IoT Ultrasonic Smart Gas Meters Market Sales by Application (2019-2025)
7.3 Global NB-IoT Ultrasonic Smart Gas Meters Market Size (M USD) by Application (2019-2025)
7.4 Global NB-IoT Ultrasonic Smart Gas Meters Sales Growth Rate by Application (2019-2025)
8 NB-IoT Ultrasonic Smart Gas Meters Market Consumption by Region
8.1 Global NB-IoT Ultrasonic Smart Gas Meters Sales by Region
8.1.1 Global NB-IoT Ultrasonic Smart Gas Meters Sales by Region
8.1.2 Global NB-IoT Ultrasonic Smart Gas Meters Sales Market Share by Region
8.2 North America
8.2.1 North America NB-IoT Ultrasonic Smart Gas Meters Sales by Country
8.2.2 U.S.
8.2.3 Canada
8.2.4 Mexico
8.3 Europe
8.3.1 Europe NB-IoT Ultrasonic Smart Gas Meters Sales by Country
8.3.2 Germany
8.3.3 France
8.3.4 U.K.
8.3.5 Italy
8.3.6 Russia
8.4 Asia Pacific
8.4.1 Asia Pacific NB-IoT Ultrasonic Smart Gas Meters Sales by Region
8.4.2 China
8.4.3 Japan
8.4.4 South Korea
8.4.5 India
8.4.6 Southeast Asia
8.5 South America
8.5.1 South America NB-IoT Ultrasonic Smart Gas Meters Sales by Country
8.5.2 Brazil
8.5.3 Argentina
8.5.4 Columbia
8.6 Middle East and Africa
8.6.1 Middle East and Africa NB-IoT Ultrasonic Smart Gas Meters Sales by Region
8.6.2 Saudi Arabia
8.6.3 UAE
8.6.4 Egypt
8.6.5 Nigeria
8.6.6 South Africa
9 NB-IoT Ultrasonic Smart Gas Meters Market Production by Region
9.1 Global Production of NB-IoT Ultrasonic Smart Gas Meters by Region (2019-2025)
9.2 Global NB-IoT Ultrasonic Smart Gas Meters Revenue Market Share by Region (2019-2025)
9.3 Global NB-IoT Ultrasonic Smart Gas Meters Production, Revenue, Price and Gross Margin (2019-2025)
9.4 North America NB-IoT Ultrasonic Smart Gas Meters Production
9.4.1 North America NB-IoT Ultrasonic Smart Gas Meters Production Growth Rate (2019-2025)
9.4.2 North America NB-IoT Ultrasonic Smart Gas Meters Production, Revenue, Price and Gross Margin (2019-2025)
9.5 Europe NB-IoT Ultrasonic Smart Gas Meters Production
9.5.1 Europe NB-IoT Ultrasonic Smart Gas Meters Production Growth Rate (2019-2025)
9.5.2 Europe NB-IoT Ultrasonic Smart Gas Meters Production, Revenue, Price and Gross Margin (2019-2025)
9.6 Japan NB-IoT Ultrasonic Smart Gas Meters Production (2019-2025)
9.6.1 Japan NB-IoT Ultrasonic Smart Gas Meters Production Growth Rate (2019-2025)
9.6.2 Japan NB-IoT Ultrasonic Smart Gas Meters Production, Revenue, Price and Gross Margin (2019-2025)
9.7 China NB-IoT Ultrasonic Smart Gas Meters Production (2019-2025)
9.7.1 China NB-IoT Ultrasonic Smart Gas Meters Production Growth Rate (2019-2025)
9.7.2 China NB-IoT Ultrasonic Smart Gas Meters Production, Revenue, Price and Gross Margin (2019-2025)
10 Key Companies Profile
10.1 Cavagna Group
10.1.1 Cavagna Group NB-IoT Ultrasonic Smart Gas Meters Basic Information
10.1.2 Cavagna Group NB-IoT Ultrasonic Smart Gas Meters Product Overview
10.1.3 Cavagna Group NB-IoT Ultrasonic Smart Gas Meters Product Market Performance
10.1.4 Cavagna Group Business Overview
10.1.5 Cavagna Group NB-IoT Ultrasonic Smart Gas Meters SWOT Analysis
10.1.6 Cavagna Group Recent Developments
10.2 Flonidan (AVK Group)
10.2.1 Flonidan (AVK Group) NB-IoT Ultrasonic Smart Gas Meters Basic Information
10.2.2 Flonidan (AVK Group) NB-IoT Ultrasonic Smart Gas Meters Product Overview
10.2.3 Flonidan (AVK Group) NB-IoT Ultrasonic Smart Gas Meters Product Market Performance
10.2.4 Flonidan (AVK Group) Business Overview
10.2.5 Flonidan (AVK Group) NB-IoT Ultrasonic Smart Gas Meters SWOT Analysis
10.2.6 Flonidan (AVK Group) Recent Developments
10.3 Smartico
10.3.1 Smartico NB-IoT Ultrasonic Smart Gas Meters Basic Information
10.3.2 Smartico NB-IoT Ultrasonic Smart Gas Meters Product Overview
10.3.3 Smartico NB-IoT Ultrasonic Smart Gas Meters Product Market Performance
10.3.4 Smartico NB-IoT Ultrasonic Smart Gas Meters SWOT Analysis
10.3.5 Smartico Business Overview
10.3.6 Smartico Recent Developments
10.4 Landis+Gyr
10.4.1 Landis+Gyr NB-IoT Ultrasonic Smart Gas Meters Basic Information
10.4.2 Landis+Gyr NB-IoT Ultrasonic Smart Gas Meters Product Overview
10.4.3 Landis+Gyr NB-IoT Ultrasonic Smart Gas Meters Product Market Performance
10.4.4 Landis+Gyr Business Overview
10.4.5 Landis+Gyr Recent Developments
10.5 Xylem
10.5.1 Xylem NB-IoT Ultrasonic Smart Gas Meters Basic Information
10.5.2 Xylem NB-IoT Ultrasonic Smart Gas Meters Product Overview
10.5.3 Xylem NB-IoT Ultrasonic Smart Gas Meters Product Market Performance
10.5.4 Xylem Business Overview
10.5.5 Xylem Recent Developments
10.6 OSAKI Group
10.6.1 OSAKI Group NB-IoT Ultrasonic Smart Gas Meters Basic Information
10.6.2 OSAKI Group NB-IoT Ultrasonic Smart Gas Meters Product Overview
10.6.3 OSAKI Group NB-IoT Ultrasonic Smart Gas Meters Product Market Performance
10.6.4 OSAKI Group Business Overview
10.6.5 OSAKI Group Recent Developments
10.7 Krohne
10.7.1 Krohne NB-IoT Ultrasonic Smart Gas Meters Basic Information
10.7.2 Krohne NB-IoT Ultrasonic Smart Gas Meters Product Overview
10.7.3 Krohne NB-IoT Ultrasonic Smart Gas Meters Product Market Performance
10.7.4 Krohne Business Overview
10.7.5 Krohne Recent Developments
10.8 Toyo Gas
10.8.1 Toyo Gas NB-IoT Ultrasonic Smart Gas Meters Basic Information
10.8.2 Toyo Gas NB-IoT Ultrasonic Smart Gas Meters Product Overview
10.8.3 Toyo Gas NB-IoT Ultrasonic Smart Gas Meters Product Market Performance
10.8.4 Toyo Gas Business Overview
10.8.5 Toyo Gas Recent Developments
10.9 Elster Instromet (Honeywell International)
10.9.1 Elster Instromet (Honeywell International) NB-IoT Ultrasonic Smart Gas Meters Basic Information
10.9.2 Elster Instromet (Honeywell International) NB-IoT Ultrasonic Smart Gas Meters Product Overview
10.9.3 Elster Instromet (Honeywell International) NB-IoT Ultrasonic Smart Gas Meters Product Market Performance
10.9.4 Elster Instromet (Honeywell International) Business Overview
10.9.5 Elster Instromet (Honeywell International) Recent Developments
10.10 Pietro Fiorentini
10.10.1 Pietro Fiorentini NB-IoT Ultrasonic Smart Gas Meters Basic Information
10.10.2 Pietro Fiorentini NB-IoT Ultrasonic Smart Gas Meters Product Overview
10.10.3 Pietro Fiorentini NB-IoT Ultrasonic Smart Gas Meters Product Market Performance
10.10.4 Pietro Fiorentini Business Overview
10.10.5 Pietro Fiorentini Recent Developments
10.11 PowerCom
10.11.1 PowerCom NB-IoT Ultrasonic Smart Gas Meters Basic Information
10.11.2 PowerCom NB-IoT Ultrasonic Smart Gas Meters Product Overview
10.11.3 PowerCom NB-IoT Ultrasonic Smart Gas Meters Product Market Performance
10.11.4 PowerCom Business Overview
10.11.5 PowerCom Recent Developments
10.12 Siemens
10.12.1 Siemens NB-IoT Ultrasonic Smart Gas Meters Basic Information
10.12.2 Siemens NB-IoT Ultrasonic Smart Gas Meters Product Overview
10.12.3 Siemens NB-IoT Ultrasonic Smart Gas Meters Product Market Performance
10.12.4 Siemens Business Overview
10.12.5 Siemens Recent Developments
10.13 Lauris Technologies
10.13.1 Lauris Technologies NB-IoT Ultrasonic Smart Gas Meters Basic Information
10.13.2 Lauris Technologies NB-IoT Ultrasonic Smart Gas Meters Product Overview
10.13.3 Lauris Technologies NB-IoT Ultrasonic Smart Gas Meters Product Market Performance
10.13.4 Lauris Technologies Business Overview
10.13.5 Lauris Technologies Recent Developments
10.14 Viewshine
10.14.1 Viewshine NB-IoT Ultrasonic Smart Gas Meters Basic Information
10.14.2 Viewshine NB-IoT Ultrasonic Smart Gas Meters Product Overview
10.14.3 Viewshine NB-IoT Ultrasonic Smart Gas Meters Product Market Performance
10.14.4 Viewshine Business Overview
10.14.5 Viewshine Recent Developments
10.15 Goldcard Smart Group
10.15.1 Goldcard Smart Group NB-IoT Ultrasonic Smart Gas Meters Basic Information
10.15.2 Goldcard Smart Group NB-IoT Ultrasonic Smart Gas Meters Product Overview
10.15.3 Goldcard Smart Group NB-IoT Ultrasonic Smart Gas Meters Product Market Performance
10.15.4 Goldcard Smart Group Business Overview
10.15.5 Goldcard Smart Group Recent Developments
10.16 Zhejiang Chint Instrument and Meter
10.16.1 Zhejiang Chint Instrument and Meter NB-IoT Ultrasonic Smart Gas Meters Basic Information
10.16.2 Zhejiang Chint Instrument and Meter NB-IoT Ultrasonic Smart Gas Meters Product Overview
10.16.3 Zhejiang Chint Instrument and Meter NB-IoT Ultrasonic Smart Gas Meters Product Market Performance
10.16.4 Zhejiang Chint Instrument and Meter Business Overview
10.16.5 Zhejiang Chint Instrument and Meter Recent Developments
10.17 Suntront Technolocy
10.17.1 Suntront Technolocy NB-IoT Ultrasonic Smart Gas Meters Basic Information
10.17.2 Suntront Technolocy NB-IoT Ultrasonic Smart Gas Meters Product Overview
10.17.3 Suntront Technolocy NB-IoT Ultrasonic Smart Gas Meters Product Market Performance
10.17.4 Suntront Technolocy Business Overview
10.17.5 Suntront Technolocy Recent Developments
10.18 HANGZHOU INNOVER TECHNOLOGY
10.18.1 HANGZHOU INNOVER TECHNOLOGY NB-IoT Ultrasonic Smart Gas Meters Basic Information
10.18.2 HANGZHOU INNOVER TECHNOLOGY NB-IoT Ultrasonic Smart Gas Meters Product Overview
10.18.3 HANGZHOU INNOVER TECHNOLOGY NB-IoT Ultrasonic Smart Gas Meters Product Market Performance
10.18.4 HANGZHOU INNOVER TECHNOLOGY Business Overview
10.18.5 HANGZHOU INNOVER TECHNOLOGY Recent Developments
10.19 Holley Technology
10.19.1 Holley Technology NB-IoT Ultrasonic Smart Gas Meters Basic Information
10.19.2 Holley Technology NB-IoT Ultrasonic Smart Gas Meters Product Overview
10.19.3 Holley Technology NB-IoT Ultrasonic Smart Gas Meters Product Market Performance
10.19.4 Holley Technology Business Overview
10.19.5 Holley Technology Recent Developments
10.20 Zhejiang Roxyne Smart Meters
10.20.1 Zhejiang Roxyne Smart Meters NB-IoT Ultrasonic Smart Gas Meters Basic Information
10.20.2 Zhejiang Roxyne Smart Meters NB-IoT Ultrasonic Smart Gas Meters Product Overview
10.20.3 Zhejiang Roxyne Smart Meters NB-IoT Ultrasonic Smart Gas Meters Product Market Performance
10.20.4 Zhejiang Roxyne Smart Meters Business Overview
10.20.5 Zhejiang Roxyne Smart Meters Recent Developments
11 NB-IoT Ultrasonic Smart Gas Meters Market Forecast by Region
11.1 Global NB-IoT Ultrasonic Smart Gas Meters Market Size Forecast
11.2 Global NB-IoT Ultrasonic Smart Gas Meters Market Forecast by Region
11.2.1 North America Market Size Forecast by Country
11.2.2 Europe NB-IoT Ultrasonic Smart Gas Meters Market Size Forecast by Country
11.2.3 Asia Pacific NB-IoT Ultrasonic Smart Gas Meters Market Size Forecast by Region
11.2.4 South America NB-IoT Ultrasonic Smart Gas Meters Market Size Forecast by Country
11.2.5 Middle East and Africa Forecasted Consumption of NB-IoT Ultrasonic Smart Gas Meters by Country
12 Forecast Market by Type and by Application (2025-2032)
12.1 Global NB-IoT Ultrasonic Smart Gas Meters Market Forecast by Type (2025-2032)
12.1.1 Global Forecasted Sales of NB-IoT Ultrasonic Smart Gas Meters by Type (2025-2032)
12.1.2 Global NB-IoT Ultrasonic Smart Gas Meters Market Size Forecast by Type (2025-2032)
12.1.3 Global Forecasted Price of NB-IoT Ultrasonic Smart Gas Meters by Type (2025-2032)
12.2 Global NB-IoT Ultrasonic Smart Gas Meters Market Forecast by Application (2025-2032)
12.2.1 Global NB-IoT Ultrasonic Smart Gas Meters Sales (K Units) Forecast by Application
12.2.2 Global NB-IoT Ultrasonic Smart Gas Meters Market Size (M USD) Forecast by Application (2025-2032)
13 Conclusion and Key Findings
LIST OF TABLES & FIGURES
List of Tables
Table 1. Introduction of the Type
Table 2. Introduction of the Application
Table 3. Market Size (M USD) Segment Executive Summary
Table 4. NB-IoT Ultrasonic Smart Gas Meters Market Size Comparison by Region (M USD)
Table 5. Global NB-IoT Ultrasonic Smart Gas Meters Sales (K Units) by Manufacturers (2019-2025)
Table 6. Global NB-IoT Ultrasonic Smart Gas Meters Sales Market Share by Manufacturers (2019-2025)
Table 7. Global NB-IoT Ultrasonic Smart Gas Meters Revenue (M USD) by Manufacturers (2019-2025)
Table 8. Global NB-IoT Ultrasonic Smart Gas Meters Revenue Share by Manufacturers (2019-2025)
Table 9. Company Type (Tier 1, Tier 2, and Tier 3) & (based on the Revenue in NB-IoT Ultrasonic Smart Gas Meters as of 2022)
Table 10. Global Market NB-IoT Ultrasonic Smart Gas Meters Average Price (USD/Unit) of Key Manufacturers (2019-2025)
Table 11. Manufacturers NB-IoT Ultrasonic Smart Gas Meters Sales Sites and Area Served
Table 12. Manufacturers NB-IoT Ultrasonic Smart Gas Meters Product Type
Table 13. Global NB-IoT Ultrasonic Smart Gas Meters Manufacturers Market Concentration Ratio (CR5 and HHI)
Table 14. Mergers & Acquisitions, Expansion Plans
Table 15. Industry Chain Map of NB-IoT Ultrasonic Smart Gas Meters
Table 16. Market Overview of Key Raw Materials
Table 17. Midstream Market Analysis
Table 18. Downstream Customer Analysis
Table 19. Key Development Trends
Table 20. Driving Factors
Table 21. NB-IoT Ultrasonic Smart Gas Meters Market Challenges
Table 22. Global NB-IoT Ultrasonic Smart Gas Meters Sales by Type (K Units)
Table 23. Global NB-IoT Ultrasonic Smart Gas Meters Market Size by Type (M USD)
Table 24. Global NB-IoT Ultrasonic Smart Gas Meters Sales (K Units) by Type (2019-2025)
Table 25. Global NB-IoT Ultrasonic Smart Gas Meters Sales Market Share by Type (2019-2025)
Table 26. Global NB-IoT Ultrasonic Smart Gas Meters Market Size (M USD) by Type (2019-2025)
Table 27. Global NB-IoT Ultrasonic Smart Gas Meters Market Size Share by Type (2019-2025)
Table 28. Global NB-IoT Ultrasonic Smart Gas Meters Price (USD/Unit) by Type (2019-2025)
Table 29. Global NB-IoT Ultrasonic Smart Gas Meters Sales (K Units) by Application
Table 30. Global NB-IoT Ultrasonic Smart Gas Meters Market Size by Application
Table 31. Global NB-IoT Ultrasonic Smart Gas Meters Sales by Application (2019-2025) & (K Units)
Table 32. Global NB-IoT Ultrasonic Smart Gas Meters Sales Market Share by Application (2019-2025)
Table 33. Global NB-IoT Ultrasonic Smart Gas Meters Sales by Application (2019-2025) & (M USD)
Table 34. Global NB-IoT Ultrasonic Smart Gas Meters Market Share by Application (2019-2025)
Table 35. Global NB-IoT Ultrasonic Smart Gas Meters Sales Growth Rate by Application (2019-2025)
Table 36. Global NB-IoT Ultrasonic Smart Gas Meters Sales by Region (2019-2025) & (K Units)
Table 37. Global NB-IoT Ultrasonic Smart Gas Meters Sales Market Share by Region (2019-2025)
Table 38. North America NB-IoT Ultrasonic Smart Gas Meters Sales by Country (2019-2025) & (K Units)
Table 39. Europe NB-IoT Ultrasonic Smart Gas Meters Sales by Country (2019-2025) & (K Units)
Table 40. Asia Pacific NB-IoT Ultrasonic Smart Gas Meters Sales by Region (2019-2025) & (K Units)
Table 41. South America NB-IoT Ultrasonic Smart Gas Meters Sales by Country (2019-2025) & (K Units)
Table 42. Middle East and Africa NB-IoT Ultrasonic Smart Gas Meters Sales by Region (2019-2025) & (K Units)
Table 43. Global NB-IoT Ultrasonic Smart Gas Meters Production (K Units) by Region (2019-2025)
Table 44. Global NB-IoT Ultrasonic Smart Gas Meters Revenue (US$ Million) by Region (2019-2025)
Table 45. Global NB-IoT Ultrasonic Smart Gas Meters Revenue Market Share by Region (2019-2025)
Table 46. Global NB-IoT Ultrasonic Smart Gas Meters Production (K Units), Revenue (US$ Million), Price (USD/Unit) and Gross Margin (2019-2025)
Table 47. North America NB-IoT Ultrasonic Smart Gas Meters Production (K Units), Revenue (US$ Million), Price (USD/Unit) and Gross Margin (2019-2025)
Table 48. Europe NB-IoT Ultrasonic Smart Gas Meters Production (K Units), Revenue (US$ Million), Price (USD/Unit) and Gross Margin (2019-2025)
Table 49. Japan NB-IoT Ultrasonic Smart Gas Meters Production (K Units), Revenue (US$ Million), Price (USD/Unit) and Gross Margin (2019-2025)
Table 50. China NB-IoT Ultrasonic Smart Gas Meters Production (K Units), Revenue (US$ Million), Price (USD/Unit) and Gross Margin (2019-2025)
Table 51. Cavagna Group NB-IoT Ultrasonic Smart Gas Meters Basic Information
Table 52. Cavagna Group NB-IoT Ultrasonic Smart Gas Meters Product Overview
Table 53. Cavagna Group NB-IoT Ultrasonic Smart Gas Meters Sales (K Units), Revenue (M USD), Price (USD/Unit) and Gross Margin (2019-2025)
Table 54. Cavagna Group Business Overview
Table 55. Cavagna Group NB-IoT Ultrasonic Smart Gas Meters SWOT Analysis
Table 56. Cavagna Group Recent Developments
Table 57. Flonidan (AVK Group) NB-IoT Ultrasonic Smart Gas Meters Basic Information
Table 58. Flonidan (AVK Group) NB-IoT Ultrasonic Smart Gas Meters Product Overview
Table 59. Flonidan (AVK Group) NB-IoT Ultrasonic Smart Gas Meters Sales (K Units), Revenue (M USD), Price (USD/Unit) and Gross Margin (2019-2025)
Table 60. Flonidan (AVK Group) Business Overview
Table 61. Flonidan (AVK Group) NB-IoT Ultrasonic Smart Gas Meters SWOT Analysis
Table 62. Flonidan (AVK Group) Recent Developments
Table 63. Smartico NB-IoT Ultrasonic Smart Gas Meters Basic Information
Table 64. Smartico NB-IoT Ultrasonic Smart Gas Meters Product Overview
Table 65. Smartico NB-IoT Ultrasonic Smart Gas Meters Sales (K Units), Revenue (M USD), Price (USD/Unit) and Gross Margin (2019-2025)
Table 66. Smartico NB-IoT Ultrasonic Smart Gas Meters SWOT Analysis
Table 67. Smartico Business Overview
Table 68. Smartico Recent Developments
Table 69. Landis+Gyr NB-IoT Ultrasonic Smart Gas Meters Basic Information
Table 70. Landis+Gyr NB-IoT Ultrasonic Smart Gas Meters Product Overview
Table 71. Landis+Gyr NB-IoT Ultrasonic Smart Gas Meters Sales (K Units), Revenue (M USD), Price (USD/Unit) and Gross Margin (2019-2025)
Table 72. Landis+Gyr Business Overview
Table 73. Landis+Gyr Recent Developments
Table 74. Xylem NB-IoT Ultrasonic Smart Gas Meters Basic Information
Table 75. Xylem NB-IoT Ultrasonic Smart Gas Meters Product Overview
Table 76. Xylem NB-IoT Ultrasonic Smart Gas Meters Sales (K Units), Revenue (M USD), Price (USD/Unit) and Gross Margin (2019-2025)
Table 77. Xylem Business Overview
Table 78. Xylem Recent Developments
Table 79. OSAKI Group NB-IoT Ultrasonic Smart Gas Meters Basic Information
Table 80. OSAKI Group NB-IoT Ultrasonic Smart Gas Meters Product Overview
Table 81. OSAKI Group NB-IoT Ultrasonic Smart Gas Meters Sales (K Units), Revenue (M USD), Price (USD/Unit) and Gross Margin (2019-2025)
Table 82. OSAKI Group Business Overview
Table 83. OSAKI Group Recent Developments
Table 84. Krohne NB-IoT Ultrasonic Smart Gas Meters Basic Information
Table 85. Krohne NB-IoT Ultrasonic Smart Gas Meters Product Overview
Table 86. Krohne NB-IoT Ultrasonic Smart Gas Meters Sales (K Units), Revenue (M USD), Price (USD/Unit) and Gross Margin (2019-2025)
Table 87. Krohne Business Overview
Table 88. Krohne Recent Developments
Table 89. Toyo Gas NB-IoT Ultrasonic Smart Gas Meters Basic Information
Table 90. Toyo Gas NB-IoT Ultrasonic Smart Gas Meters Product Overview
Table 91. Toyo Gas NB-IoT Ultrasonic Smart Gas Meters Sales (K Units), Revenue (M USD), Price (USD/Unit) and Gross Margin (2019-2025)
Table 92. Toyo Gas Business Overview
Table 93. Toyo Gas Recent Developments
Table 94. Elster Instromet (Honeywell International) NB-IoT Ultrasonic Smart Gas Meters Basic Information
Table 95. Elster Instromet (Honeywell International) NB-IoT Ultrasonic Smart Gas Meters Product Overview
Table 96. Elster Instromet (Honeywell International) NB-IoT Ultrasonic Smart Gas Meters Sales (K Units), Revenue (M USD), Price (USD/Unit) and Gross Margin (2019-2025)
Table 97. Elster Instromet (Honeywell International) Business Overview
Table 98. Elster Instromet (Honeywell International) Recent Developments
Table 99. Pietro Fiorentini NB-IoT Ultrasonic Smart Gas Meters Basic Information
Table 100. Pietro Fiorentini NB-IoT Ultrasonic Smart Gas Meters Product Overview
Table 101. Pietro Fiorentini NB-IoT Ultrasonic Smart Gas Meters Sales (K Units), Revenue (M USD), Price (USD/Unit) and Gross Margin (2019-2025)
Table 102. Pietro Fiorentini Business Overview
Table 103. Pietro Fiorentini Recent Developments
Table 104. PowerCom NB-IoT Ultrasonic Smart Gas Meters Basic Information
Table 105. PowerCom NB-IoT Ultrasonic Smart Gas Meters Product Overview
Table 106. PowerCom NB-IoT Ultrasonic Smart Gas Meters Sales (K Units), Revenue (M USD), Price (USD/Unit) and Gross Margin (2019-2025)
Table 107. PowerCom Business Overview
Table 108. PowerCom Recent Developments
Table 109. Siemens NB-IoT Ultrasonic Smart Gas Meters Basic Information
Table 110. Siemens NB-IoT Ultrasonic Smart Gas Meters Product Overview
Table 111. Siemens NB-IoT Ultrasonic Smart Gas Meters Sales (K Units), Revenue (M USD), Price (USD/Unit) and Gross Margin (2019-2025)
Table 112. Siemens Business Overview
Table 113. Siemens Recent Developments
Table 114. Lauris Technologies NB-IoT Ultrasonic Smart Gas Meters Basic Information
Table 115. Lauris Technologies NB-IoT Ultrasonic Smart Gas Meters Product Overview
Table 116. Lauris Technologies NB-IoT Ultrasonic Smart Gas Meters Sales (K Units), Revenue (M USD), Price (USD/Unit) and Gross Margin (2019-2025)
Table 117. Lauris Technologies Business Overview
Table 118. Lauris Technologies Recent Developments
Table 119. Viewshine NB-IoT Ultrasonic Smart Gas Meters Basic Information
Table 120. Viewshine NB-IoT Ultrasonic Smart Gas Meters Product Overview
Table 121. Viewshine NB-IoT Ultrasonic Smart Gas Meters Sales (K Units), Revenue (M USD), Price (USD/Unit) and Gross Margin (2019-2025)
Table 122. Viewshine Business Overview
Table 123. Viewshine Recent Developments
Table 124. Goldcard Smart Group NB-IoT Ultrasonic Smart Gas Meters Basic Information
Table 125. Goldcard Smart Group NB-IoT Ultrasonic Smart Gas Meters Product Overview
Table 126. Goldcard Smart Group NB-IoT Ultrasonic Smart Gas Meters Sales (K Units), Revenue (M USD), Price (USD/Unit) and Gross Margin (2019-2025)
Table 127. Goldcard Smart Group Business Overview
Table 128. Goldcard Smart Group Recent Developments
Table 129. Zhejiang Chint Instrument and Meter NB-IoT Ultrasonic Smart Gas Meters Basic Information
Table 130. Zhejiang Chint Instrument and Meter NB-IoT Ultrasonic Smart Gas Meters Product Overview
Table 131. Zhejiang Chint Instrument and Meter NB-IoT Ultrasonic Smart Gas Meters Sales (K Units), Revenue (M USD), Price (USD/Unit) and Gross Margin (2019-2025)
Table 132. Zhejiang Chint Instrument and Meter Business Overview
Table 133. Zhejiang Chint Instrument and Meter Recent Developments
Table 134. Suntront Technolocy NB-IoT Ultrasonic Smart Gas Meters Basic Information
Table 135. Suntront Technolocy NB-IoT Ultrasonic Smart Gas Meters Product Overview
Table 136. Suntront Technolocy NB-IoT Ultrasonic Smart Gas Meters Sales (K Units), Revenue (M USD), Price (USD/Unit) and Gross Margin (2019-2025)
Table 137. Suntront Technolocy Business Overview
Table 138. Suntront Technolocy Recent Developments
Table 139. HANGZHOU INNOVER TECHNOLOGY NB-IoT Ultrasonic Smart Gas Meters Basic Information
Table 140. HANGZHOU INNOVER TECHNOLOGY NB-IoT Ultrasonic Smart Gas Meters Product Overview
Table 141. HANGZHOU INNOVER TECHNOLOGY NB-IoT Ultrasonic Smart Gas Meters Sales (K Units), Revenue (M USD), Price (USD/Unit) and Gross Margin (2019-2025)
Table 142. HANGZHOU INNOVER TECHNOLOGY Business Overview
Table 143. HANGZHOU INNOVER TECHNOLOGY Recent Developments
Table 144. Holley Technology NB-IoT Ultrasonic Smart Gas Meters Basic Information
Table 145. Holley Technology NB-IoT Ultrasonic Smart Gas Meters Product Overview
Table 146. Holley Technology NB-IoT Ultrasonic Smart Gas Meters Sales (K Units), Revenue (M USD), Price (USD/Unit) and Gross Margin (2019-2025)
Table 147. Holley Technology Business Overview
Table 148. Holley Technology Recent Developments
Table 149. Zhejiang Roxyne Smart Meters NB-IoT Ultrasonic Smart Gas Meters Basic Information
Table 150. Zhejiang Roxyne Smart Meters NB-IoT Ultrasonic Smart Gas Meters Product Overview
Table 151. Zhejiang Roxyne Smart Meters NB-IoT Ultrasonic Smart Gas Meters Sales (K Units), Revenue (M USD), Price (USD/Unit) and Gross Margin (2019-2025)
Table 152. Zhejiang Roxyne Smart Meters Business Overview
Table 153. Zhejiang Roxyne Smart Meters Recent Developments
Table 154. Global NB-IoT Ultrasonic Smart Gas Meters Sales Forecast by Region (2025-2032) & (K Units)
Table 155. Global NB-IoT Ultrasonic Smart Gas Meters Market Size Forecast by Region (2025-2032) & (M USD)
Table 156. North America NB-IoT Ultrasonic Smart Gas Meters Sales Forecast by Country (2025-2032) & (K Units)
Table 157. North America NB-IoT Ultrasonic Smart Gas Meters Market Size Forecast by Country (2025-2032) & (M USD)
Table 158. Europe NB-IoT Ultrasonic Smart Gas Meters Sales Forecast by Country (2025-2032) & (K Units)
Table 159. Europe NB-IoT Ultrasonic Smart Gas Meters Market Size Forecast by Country (2025-2032) & (M USD)
Table 160. Asia Pacific NB-IoT Ultrasonic Smart Gas Meters Sales Forecast by Region (2025-2032) & (K Units)
Table 161. Asia Pacific NB-IoT Ultrasonic Smart Gas Meters Market Size Forecast by Region (2025-2032) & (M USD)
Table 162. South America NB-IoT Ultrasonic Smart Gas Meters Sales Forecast by Country (2025-2032) & (K Units)
Table 163. South America NB-IoT Ultrasonic Smart Gas Meters Market Size Forecast by Country (2025-2032) & (M USD)
Table 164. Middle East and Africa NB-IoT Ultrasonic Smart Gas Meters Consumption Forecast by Country (2025-2032) & (Units)
Table 165. Middle East and Africa NB-IoT Ultrasonic Smart Gas Meters Market Size Forecast by Country (2025-2032) & (M USD)
Table 166. Global NB-IoT Ultrasonic Smart Gas Meters Sales Forecast by Type (2025-2032) & (K Units)
Table 167. Global NB-IoT Ultrasonic Smart Gas Meters Market Size Forecast by Type (2025-2032) & (M USD)
Table 168. Global NB-IoT Ultrasonic Smart Gas Meters Price Forecast by Type (2025-2032) & (USD/Unit)
Table 169. Global NB-IoT Ultrasonic Smart Gas Meters Sales (K Units) Forecast by Application (2025-2032)
Table 170. Global NB-IoT Ultrasonic Smart Gas Meters Market Size Forecast by Application (2025-2032) & (M USD)
List of Figures
Figure 1. Product Picture of NB-IoT Ultrasonic Smart Gas Meters
Figure 2. Data Triangulation
Figure 3. Key Caveats
Figure 4. Global NB-IoT Ultrasonic Smart Gas Meters Market Size (M USD), 2019-2032
Figure 5. Global NB-IoT Ultrasonic Smart Gas Meters Market Size (M USD) (2019-2032)
Figure 6. Global NB-IoT Ultrasonic Smart Gas Meters Sales (K Units) & (2019-2032)
Figure 7. Evaluation Matrix of Segment Market Development Potential (Type)
Figure 8. Evaluation Matrix of Segment Market Development Potential (Application)
Figure 9. Evaluation Matrix of Regional Market Development Potential
Figure 10. NB-IoT Ultrasonic Smart Gas Meters Market Size by Country (M USD)
Figure 11. NB-IoT Ultrasonic Smart Gas Meters Sales Share by Manufacturers in 2023
Figure 12. Global NB-IoT Ultrasonic Smart Gas Meters Revenue Share by Manufacturers in 2023
Figure 13. NB-IoT Ultrasonic Smart Gas Meters Market Share by Company Type (Tier 1, Tier 2 and Tier 3): 2023
Figure 14. Global Market NB-IoT Ultrasonic Smart Gas Meters Average Price (USD/Unit) of Key Manufacturers in 2023
Figure 15. The Global 5 and 10 Largest Players: Market Share by NB-IoT Ultrasonic Smart Gas Meters Revenue in 2023
Figure 16. Evaluation Matrix of Segment Market Development Potential (Type)
Figure 17. Global NB-IoT Ultrasonic Smart Gas Meters Market Share by Type
Figure 18. Sales Market Share of NB-IoT Ultrasonic Smart Gas Meters by Type (2019-2025)
Figure 19. Sales Market Share of NB-IoT Ultrasonic Smart Gas Meters by Type in 2023
Figure 20. Market Size Share of NB-IoT Ultrasonic Smart Gas Meters by Type (2019-2025)
Figure 21. Market Size Market Share of NB-IoT Ultrasonic Smart Gas Meters by Type in 2023
Figure 22. Evaluation Matrix of Segment Market Development Potential (Application)
Figure 23. Global NB-IoT Ultrasonic Smart Gas Meters Market Share by Application
Figure 24. Global NB-IoT Ultrasonic Smart Gas Meters Sales Market Share by Application (2019-2025)
Figure 25. Global NB-IoT Ultrasonic Smart Gas Meters Sales Market Share by Application in 2023
Figure 26. Global NB-IoT Ultrasonic Smart Gas Meters Market Share by Application (2019-2025)
Figure 27. Global NB-IoT Ultrasonic Smart Gas Meters Market Share by Application in 2023
Figure 28. Global NB-IoT Ultrasonic Smart Gas Meters Sales Growth Rate by Application (2019-2025)
Figure 29. Global NB-IoT Ultrasonic Smart Gas Meters Sales Market Share by Region (2019-2025)
Figure 30. North America NB-IoT Ultrasonic Smart Gas Meters Sales and Growth Rate (2019-2025) & (K Units)
Figure 31. North America NB-IoT Ultrasonic Smart Gas Meters Sales Market Share by Country in 2023
Figure 32. U.S. NB-IoT Ultrasonic Smart Gas Meters Sales and Growth Rate (2019-2025) & (K Units)
Figure 33. Canada NB-IoT Ultrasonic Smart Gas Meters Sales (K Units) and Growth Rate (2019-2025)
Figure 34. Mexico NB-IoT Ultrasonic Smart Gas Meters Sales (Units) and Growth Rate (2019-2025)
Figure 35. Europe NB-IoT Ultrasonic Smart Gas Meters Sales and Growth Rate (2019-2025) & (K Units)
Figure 36. Europe NB-IoT Ultrasonic Smart Gas Meters Sales Market Share by Country in 2023
Figure 37. Germany NB-IoT Ultrasonic Smart Gas Meters Sales and Growth Rate (2019-2025) & (K Units)
Figure 38. France NB-IoT Ultrasonic Smart Gas Meters Sales and Growth Rate (2019-2025) & (K Units)
Figure 39. U.K. NB-IoT Ultrasonic Smart Gas Meters Sales and Growth Rate (2019-2025) & (K Units)
Figure 40. Italy NB-IoT Ultrasonic Smart Gas Meters Sales and Growth Rate (2019-2025) & (K Units)
Figure 41. Russia NB-IoT Ultrasonic Smart Gas Meters Sales and Growth Rate (2019-2025) & (K Units)
Figure 42. Asia Pacific NB-IoT Ultrasonic Smart Gas Meters Sales and Growth Rate (K Units)
Figure 43. Asia Pacific NB-IoT Ultrasonic Smart Gas Meters Sales Market Share by Region in 2023
Figure 44. China NB-IoT Ultrasonic Smart Gas Meters Sales and Growth Rate (2019-2025) & (K Units)
Figure 45. Japan NB-IoT Ultrasonic Smart Gas Meters Sales and Growth Rate (2019-2025) & (K Units)
Figure 46. South Korea NB-IoT Ultrasonic Smart Gas Meters Sales and Growth Rate (2019-2025) & (K Units)
Figure 47. India NB-IoT Ultrasonic Smart Gas Meters Sales and Growth Rate (2019-2025) & (K Units)
Figure 48. Southeast Asia NB-IoT Ultrasonic Smart Gas Meters Sales and Growth Rate (2019-2025) & (K Units)
Figure 49. South America NB-IoT Ultrasonic Smart Gas Meters Sales and Growth Rate (K Units)
Figure 50. South America NB-IoT Ultrasonic Smart Gas Meters Sales Market Share by Country in 2023
Figure 51. Brazil NB-IoT Ultrasonic Smart Gas Meters Sales and Growth Rate (2019-2025) & (K Units)
Figure 52. Argentina NB-IoT Ultrasonic Smart Gas Meters Sales and Growth Rate (2019-2025) & (K Units)
Figure 53. Columbia NB-IoT Ultrasonic Smart Gas Meters Sales and Growth Rate (2019-2025) & (K Units)
Figure 54. Middle East and Africa NB-IoT Ultrasonic Smart Gas Meters Sales and Growth Rate (K Units)
Figure 55. Middle East and Africa NB-IoT Ultrasonic Smart Gas Meters Sales Market Share by Region in 2023
Figure 56. Saudi Arabia NB-IoT Ultrasonic Smart Gas Meters Sales and Growth Rate (2019-2025) & (K Units)
Figure 57. UAE NB-IoT Ultrasonic Smart Gas Meters Sales and Growth Rate (2019-2025) & (K Units)
Figure 58. Egypt NB-IoT Ultrasonic Smart Gas Meters Sales and Growth Rate (2019-2025) & (K Units)
Figure 59. Nigeria NB-IoT Ultrasonic Smart Gas Meters Sales and Growth Rate (2019-2025) & (K Units)
Figure 60. South Africa NB-IoT Ultrasonic Smart Gas Meters Sales and Growth Rate (2019-2025) & (K Units)
Figure 61. Global NB-IoT Ultrasonic Smart Gas Meters Production Market Share by Region (2019-2025)
Figure 62. North America NB-IoT Ultrasonic Smart Gas Meters Production (K Units) Growth Rate (2019-2025)
Figure 63. Europe NB-IoT Ultrasonic Smart Gas Meters Production (K Units) Growth Rate (2019-2025)
Figure 64. Japan NB-IoT Ultrasonic Smart Gas Meters Production (K Units) Growth Rate (2019-2025)
Figure 65. China NB-IoT Ultrasonic Smart Gas Meters Production (K Units) Growth Rate (2019-2025)
Figure 66. Global NB-IoT Ultrasonic Smart Gas Meters Sales Forecast by Volume (2019-2032) & (K Units)
Figure 67. Global NB-IoT Ultrasonic Smart Gas Meters Market Size Forecast by Value (2019-2032) & (M USD)
Figure 68. Global NB-IoT Ultrasonic Smart Gas Meters Sales Market Share Forecast by Type (2025-2032)
Figure 69. Global NB-IoT Ultrasonic Smart Gas Meters Market Share Forecast by Type (2025-2032)
Figure 70. Global NB-IoT Ultrasonic Smart Gas Meters Sales Forecast by Application (2025-2032)
Figure 71. Global NB-IoT Ultrasonic Smart Gas Meters Market Share Forecast by Application (2025-2032)

