Near-infrared fluorescence (NIRF) imaging is a medical imaging technique that employs near-infrared (NIR) light to capture images of tissue and structures inside the human body. This method uses fluorescence imaging agents that can be excited by NIR light (typically with wavelengths greater than 760 nm). These agents, when exposed to NIR light, emit fluorescence, allowing the visualization of tissue deposition, enabling surgeons to detect abnormalities and guide surgical interventions. NIRF imaging has been gaining popularity for its non-invasive, high-precision capabilities in real-time during various surgeries, such as cardiovascular surgery, cancer surgery, gastrointestinal surgery, and plastic and reconstructive surgery.
The market for NIRF imaging devices has witnessed considerable growth, driven by increasing adoption in clinical settings, improvements in imaging technologies, and rising demand for precision medicine. The ability of NIRF imaging to enhance visualization and surgical outcomes makes it a preferred choice in complex surgical procedures.
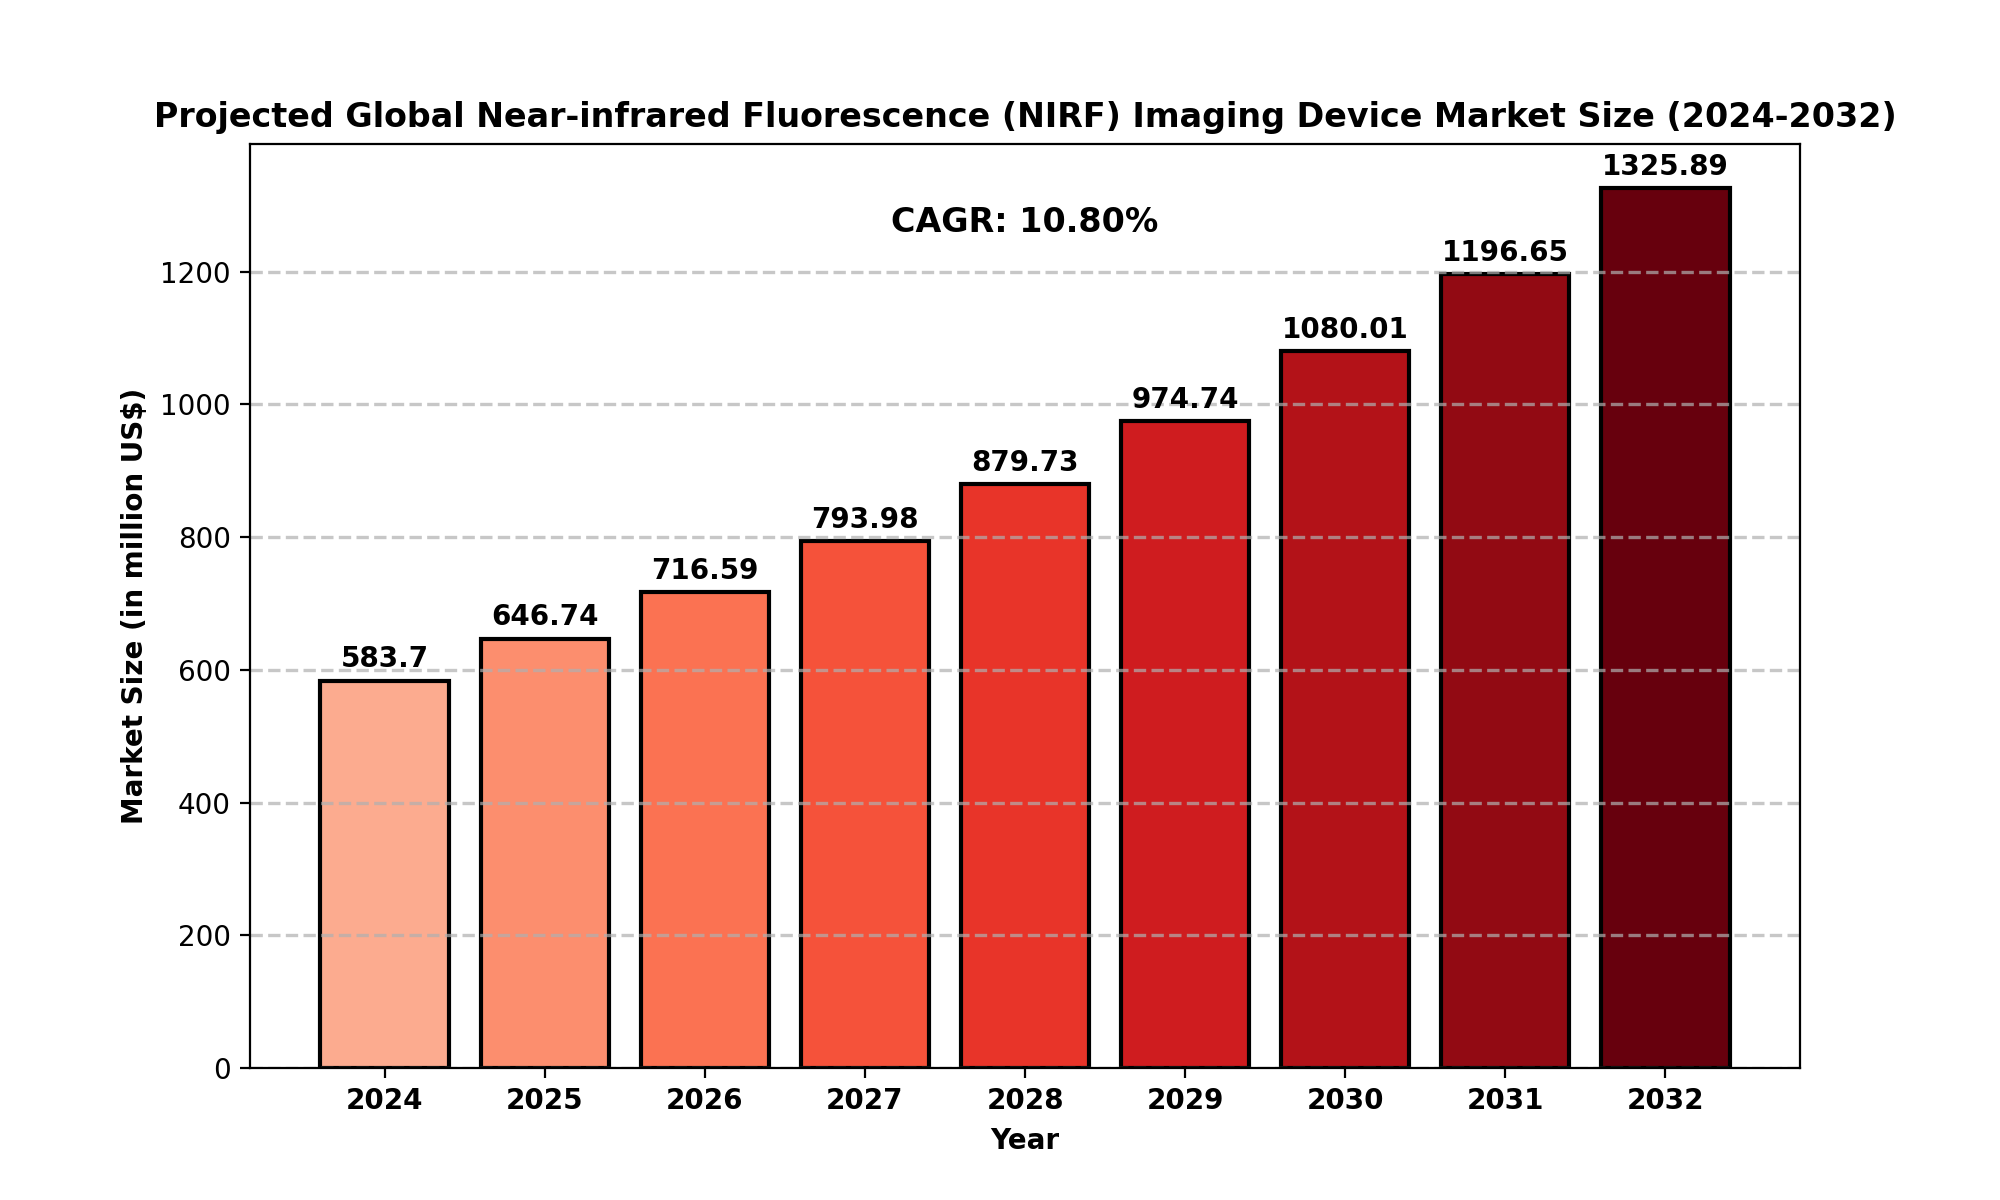
Market Size
The global Near-infrared Fluorescence (NIRF) Imaging Device market was valued at USD 583.70 million in 2024 and is projected to reach USD 1325.89 million by 2032, exhibiting a remarkable compound annual growth rate (CAGR) of 10.80% during the forecast period.
This substantial growth is attributed to several factors, including advancements in medical imaging technologies, growing awareness about the benefits of NIRF imaging, and the increasing prevalence of chronic diseases requiring complex surgeries, such as cancer and cardiovascular conditions.
Key statistics supporting the market's expansion include:
Additionally, North America holds a significant share of the market, with an estimated market size of USD 181.56 million in 2024. The region is expected to grow at a CAGR of 9.26% through 2032, driven by the robust healthcare infrastructure, increasing demand for minimally invasive surgeries, and the presence of leading players in the medical technology sector.
Market Dynamics
Drivers:
Several factors are propelling the growth of the Near-infrared Fluorescence (NIRF) Imaging Device market:
-
Technological Advancements: Continuous improvements in NIRF imaging technology, such as enhanced resolution and deeper tissue penetration, are making these devices more efficient and effective in clinical applications.
-
Minimally Invasive Procedures: There is a growing shift towards minimally invasive surgeries due to benefits such as reduced recovery time, fewer complications, and lower risk of infections. NIRF imaging plays a crucial role in these procedures by providing real-time visualization of tissues.
-
Rising Incidence of Chronic Diseases: The increasing prevalence of chronic conditions, including cancer, cardiovascular diseases, and gastrointestinal disorders, requires precise surgical interventions, which NIRF imaging can support.
-
Aging Population: As the global population ages, the demand for surgeries, especially cancer and cardiovascular surgeries, is rising, further driving the adoption of NIRF imaging in healthcare facilities.
Restraints:
Despite the growth prospects, certain challenges hinder market expansion:
-
High Initial Costs: The high cost of NIRF imaging devices and the need for specialized equipment and training can limit the adoption of these technologies, particularly in resource-constrained healthcare systems.
-
Regulatory Challenges: The approval process for medical imaging devices can be time-consuming and complex, potentially delaying the introduction of innovative NIRF technologies into the market.
-
Lack of Awareness in Emerging Markets: In regions such as Asia-Pacific and Africa, where the awareness and adoption of advanced imaging technologies are still growing, the market may face slower growth.
Opportunities:
The NIRF imaging device market presents several untapped opportunities:
-
Emerging Markets: Increasing healthcare investments in emerging economies, particularly in Asia-Pacific and Latin America, create significant growth opportunities for NIRF imaging providers.
-
Collaborations and Partnerships: Opportunities for collaboration between imaging device manufacturers, research institutions, and healthcare providers are likely to drive innovation and expand market penetration.
-
Integration with Other Imaging Modalities: The integration of NIRF imaging with other imaging techniques, such as MRI and CT scans, could enhance the accuracy and depth of diagnostics and treatment.
Challenges:
The market also faces certain challenges, including:
-
Technological Barriers: Despite advancements, NIRF imaging still has limitations regarding depth of tissue penetration and resolution in some cases, which may restrict its use in certain medical conditions.
-
Competition from Other Imaging Techniques: Traditional imaging methods, such as MRI, CT, and ultrasound, continue to be widely used and may pose competition to the NIRF imaging market.
Regional Analysis
The global Near-infrared Fluorescence (NIRF) Imaging Device market is expanding across several regions, with notable variations in demand, adoption, and market growth.
-
North America: North America is the largest market for NIRF imaging devices, owing to the advanced healthcare infrastructure, high adoption rate of medical technologies, and significant healthcare spending. The USA, Canada, and Mexico are key contributors to the growth in this region.
-
Europe: Europe is also witnessing strong growth, with countries like Germany, the UK, and France leading the charge. The region’s increasing focus on healthcare innovation and adoption of minimally invasive surgical techniques is propelling the market.
-
Asia-Pacific: The Asia-Pacific region presents a high-growth opportunity for NIRF imaging due to the rising healthcare investments, improving medical infrastructure, and growing awareness of advanced surgical technologies.
-
South America: The South American market is relatively underdeveloped but is expected to grow due to the rising demand for better healthcare technologies and the increasing prevalence of diseases like cancer.
-
Middle East and Africa: The Middle East and Africa market is expanding slowly but steadily, as healthcare access and awareness of advanced imaging technologies improve.
Competitor Analysis (in brief)
The Near-infrared Fluorescence (NIRF) Imaging Device market is competitive, with several leading players shaping its growth trajectory. Key players in the market include:
-
Stryker: A major player with a strong portfolio of NIRF imaging systems.
-
Karl Storz: Known for its advanced medical imaging solutions, Karl Storz is a key competitor.
-
Olympus: Olympus offers cutting-edge NIRF imaging technologies for a range of surgical applications.
-
Medtronic: A global healthcare giant involved in the development and distribution of NIRF imaging devices.
-
Leica Microsystems (Danaher): Leica Microsystems provides high-quality imaging products for healthcare settings, including NIRF systems.
-
Shimadzu, Hamamatsu, Mizuho Medical, Fluoptics, and Optomedic: These companies also play significant roles in offering NIRF devices, contributing to market diversity and competition.
Global Near-infrared Fluorescence (NIRF) Imaging Device: Market Segmentation Analysis
This report provides a deep insight into the global Near-infrared Fluorescence (NIRF) Imaging Device market covering all its essential aspects. This ranges from a macro overview of the market to micro details of the market size, competitive landscape, development trend, niche market, key market drivers and challenges, SWOT analysis, value chain analysis, etc.
The analysis helps the reader to shape the competition within the industries and strategies for the competitive environment to enhance the potential profit. Furthermore, it provides a simple framework for evaluating and assessing the position of the business organization. The report structure also focuses on the competitive landscape of the Global Near-infrared Fluorescence (NIRF) Imaging Device Market, this report introduces in detail the market share, market performance, product situation, operation situation, etc., of the main players, which helps the readers in the industry to identify the main competitors and deeply understand the competition pattern of the market.
In a word, this report is a must-read for industry players, investors, researchers, consultants, business strategists, and all those who have any kind of stake or are planning to foray into the Near-infrared Fluorescence (NIRF) Imaging Device market in any manner.
Market Segmentation (by Application)
Market Segmentation (by Type)
-
Open Surgery
-
Laparoscopic Surgery
Key Company
Geographic Segmentation
-
North America (USA, Canada, Mexico)
-
Europe (Germany, UK, France, Russia, Italy, Rest of Europe)
-
Asia-Pacific (China, Japan, South Korea, India, Southeast Asia, Rest of Asia-Pacific)
-
South America (Brazil, Argentina, Columbia, Rest of South America)
-
The Middle East and Africa (Saudi Arabia, UAE, Egypt, Nigeria, South Africa, Rest of MEA)
FAQ Section
What is the current market size of the NIRF Imaging Device Market?
- The current market size of the global NIRF Imaging Device market is USD 583.70 million in 2024, with expectations to reach USD 1469.09 million by 2032.
Which are the key companies operating in the NIRF Imaging Device Market?
- Key companies in the market include Stryker, Karl Storz, Olympus, Medtronic, Leica Microsystems, Shimadzu, Hamamatsu, Mizuho Medical, Fluoptics, and Optomedic.
What are the key growth drivers in the NIRF Imaging Device Market?
- Key drivers include advancements in NIRF technology, growing demand for minimally invasive surgeries, and the increasing prevalence of chronic diseases requiring surgical intervention.
Which regions dominate the NIRF Imaging Device Market?
- North America currently dominates the market, followed by Europe and the Asia-Pacific region, which is experiencing rapid growth.
What are the emerging trends in the NIRF Imaging Device Market?
- Emerging trends include the integration of NIRF imaging with other imaging technologies, rising healthcare investments in emerging markets, and growing adoption of NIRF devices in various surgical procedures.
Key Benefits of This Market Research:
- Industry drivers, restraints, and opportunities covered in the study
- Neutral perspective on the market performance
- Recent industry trends and developments
- Competitive landscape & strategies of key players
- Potential & niche segments and regions exhibiting promising growth covered
- Historical, current, and projected market size, in terms of value
- In-depth analysis of the Near-infrared Fluorescence (NIRF) Imaging Device Market
- Overview of the regional outlook of the Near-infrared Fluorescence (NIRF) Imaging Device Market:
Key Reasons to Buy this Report:
- Access to date statistics compiled by our researchers. These provide you with historical and forecast data, which is analyzed to tell you why your market is set to change
- This enables you to anticipate market changes to remain ahead of your competitors
- You will be able to copy data from the Excel spreadsheet straight into your marketing plans, business presentations, or other strategic documents
- The concise analysis, clear graph, and table format will enable you to pinpoint the information you require quickly
- Provision of market value data for each segment and sub-segment
- Indicates the region and segment that is expected to witness the fastest growth as well as to dominate the market
- Analysis by geography highlighting the consumption of the product/service in the region as well as indicating the factors that are affecting the market within each region
- Competitive landscape which incorporates the market ranking of the major players, along with new service/product launches, partnerships, business expansions, and acquisitions in the past five years of companies profiled
- Extensive company profiles comprising of company overview, company insights, product benchmarking, and SWOT analysis for the major market players
- The current as well as the future market outlook of the industry concerning recent developments which involve growth opportunities and drivers as well as challenges and restraints of both emerging as well as developed regions
- Includes in-depth analysis of the market from various perspectives through Porter
TABLE OF CONTENTS
Table of Contents
1 Research Methodology and Statistical Scope
1.1 Market Definition and Statistical Scope of Near-infrared Fluorescence (NIRF) Imaging Device
1.2 Key Market Segments
1.2.1 Near-infrared Fluorescence (NIRF) Imaging Device Segment by Type
1.2.2 Near-infrared Fluorescence (NIRF) Imaging Device Segment by Application
1.3 Methodology & Sources of Information
1.3.1 Research Methodology
1.3.2 Research Process
1.3.3 Market Breakdown and Data Triangulation
1.3.4 Base Year
1.3.5 Report Assumptions & Caveats
2 Near-infrared Fluorescence (NIRF) Imaging Device Market Overview
2.1 Global Market Overview
2.1.1 Global Near-infrared Fluorescence (NIRF) Imaging Device Market Size (M USD) Estimates and Forecasts (2019-2032)
2.1.2 Global Near-infrared Fluorescence (NIRF) Imaging Device Sales Estimates and Forecasts (2019-2032)
2.2 Market Segment Executive Summary
2.3 Global Market Size by Region
3 Near-infrared Fluorescence (NIRF) Imaging Device Market Competitive Landscape
3.1 Global Near-infrared Fluorescence (NIRF) Imaging Device Sales by Manufacturers (2019-2025)
3.2 Global Near-infrared Fluorescence (NIRF) Imaging Device Revenue Market Share by Manufacturers (2019-2025)
3.3 Near-infrared Fluorescence (NIRF) Imaging Device Market Share by Company Type (Tier 1, Tier 2, and Tier 3)
3.4 Global Near-infrared Fluorescence (NIRF) Imaging Device Average Price by Manufacturers (2019-2025)
3.5 Manufacturers Near-infrared Fluorescence (NIRF) Imaging Device Sales Sites, Area Served, Product Type
3.6 Near-infrared Fluorescence (NIRF) Imaging Device Market Competitive Situation and Trends
3.6.1 Near-infrared Fluorescence (NIRF) Imaging Device Market Concentration Rate
3.6.2 Global 5 and 10 Largest Near-infrared Fluorescence (NIRF) Imaging Device Players Market Share by Revenue
3.6.3 Mergers & Acquisitions, Expansion
4 Near-infrared Fluorescence (NIRF) Imaging Device Industry Chain Analysis
4.1 Near-infrared Fluorescence (NIRF) Imaging Device Industry Chain Analysis
4.2 Market Overview of Key Raw Materials
4.3 Midstream Market Analysis
4.4 Downstream Customer Analysis
5 The Development and Dynamics of Near-infrared Fluorescence (NIRF) Imaging Device Market
5.1 Key Development Trends
5.2 Driving Factors
5.3 Market Challenges
5.4 Market Restraints
5.5 Industry News
5.5.1 New Product Developments
5.5.2 Mergers & Acquisitions
5.5.3 Expansions
5.5.4 Collaboration/Supply Contracts
5.6 Industry Policies
6 Near-infrared Fluorescence (NIRF) Imaging Device Market Segmentation by Type
6.1 Evaluation Matrix of Segment Market Development Potential (Type)
6.2 Global Near-infrared Fluorescence (NIRF) Imaging Device Sales Market Share by Type (2019-2025)
6.3 Global Near-infrared Fluorescence (NIRF) Imaging Device Market Size Market Share by Type (2019-2025)
6.4 Global Near-infrared Fluorescence (NIRF) Imaging Device Price by Type (2019-2025)
7 Near-infrared Fluorescence (NIRF) Imaging Device Market Segmentation by Application
7.1 Evaluation Matrix of Segment Market Development Potential (Application)
7.2 Global Near-infrared Fluorescence (NIRF) Imaging Device Market Sales by Application (2019-2025)
7.3 Global Near-infrared Fluorescence (NIRF) Imaging Device Market Size (M USD) by Application (2019-2025)
7.4 Global Near-infrared Fluorescence (NIRF) Imaging Device Sales Growth Rate by Application (2019-2025)
8 Near-infrared Fluorescence (NIRF) Imaging Device Market Consumption by Region
8.1 Global Near-infrared Fluorescence (NIRF) Imaging Device Sales by Region
8.1.1 Global Near-infrared Fluorescence (NIRF) Imaging Device Sales by Region
8.1.2 Global Near-infrared Fluorescence (NIRF) Imaging Device Sales Market Share by Region
8.2 North America
8.2.1 North America Near-infrared Fluorescence (NIRF) Imaging Device Sales by Country
8.2.2 U.S.
8.2.3 Canada
8.2.4 Mexico
8.3 Europe
8.3.1 Europe Near-infrared Fluorescence (NIRF) Imaging Device Sales by Country
8.3.2 Germany
8.3.3 France
8.3.4 U.K.
8.3.5 Italy
8.3.6 Russia
8.4 Asia Pacific
8.4.1 Asia Pacific Near-infrared Fluorescence (NIRF) Imaging Device Sales by Region
8.4.2 China
8.4.3 Japan
8.4.4 South Korea
8.4.5 India
8.4.6 Southeast Asia
8.5 South America
8.5.1 South America Near-infrared Fluorescence (NIRF) Imaging Device Sales by Country
8.5.2 Brazil
8.5.3 Argentina
8.5.4 Columbia
8.6 Middle East and Africa
8.6.1 Middle East and Africa Near-infrared Fluorescence (NIRF) Imaging Device Sales by Region
8.6.2 Saudi Arabia
8.6.3 UAE
8.6.4 Egypt
8.6.5 Nigeria
8.6.6 South Africa
9 Near-infrared Fluorescence (NIRF) Imaging Device Market Production by Region
9.1 Global Production of Near-infrared Fluorescence (NIRF) Imaging Device by Region (2019-2025)
9.2 Global Near-infrared Fluorescence (NIRF) Imaging Device Revenue Market Share by Region (2019-2025)
9.3 Global Near-infrared Fluorescence (NIRF) Imaging Device Production, Revenue, Price and Gross Margin (2019-2025)
9.4 North America Near-infrared Fluorescence (NIRF) Imaging Device Production
9.4.1 North America Near-infrared Fluorescence (NIRF) Imaging Device Production Growth Rate (2019-2025)
9.4.2 North America Near-infrared Fluorescence (NIRF) Imaging Device Production, Revenue, Price and Gross Margin (2019-2025)
9.5 Europe Near-infrared Fluorescence (NIRF) Imaging Device Production
9.5.1 Europe Near-infrared Fluorescence (NIRF) Imaging Device Production Growth Rate (2019-2025)
9.5.2 Europe Near-infrared Fluorescence (NIRF) Imaging Device Production, Revenue, Price and Gross Margin (2019-2025)
9.6 Japan Near-infrared Fluorescence (NIRF) Imaging Device Production (2019-2025)
9.6.1 Japan Near-infrared Fluorescence (NIRF) Imaging Device Production Growth Rate (2019-2025)
9.6.2 Japan Near-infrared Fluorescence (NIRF) Imaging Device Production, Revenue, Price and Gross Margin (2019-2025)
9.7 China Near-infrared Fluorescence (NIRF) Imaging Device Production (2019-2025)
9.7.1 China Near-infrared Fluorescence (NIRF) Imaging Device Production Growth Rate (2019-2025)
9.7.2 China Near-infrared Fluorescence (NIRF) Imaging Device Production, Revenue, Price and Gross Margin (2019-2025)
10 Key Companies Profile
10.1 Stryker
10.1.1 Stryker Near-infrared Fluorescence (NIRF) Imaging Device Basic Information
10.1.2 Stryker Near-infrared Fluorescence (NIRF) Imaging Device Product Overview
10.1.3 Stryker Near-infrared Fluorescence (NIRF) Imaging Device Product Market Performance
10.1.4 Stryker Business Overview
10.1.5 Stryker Near-infrared Fluorescence (NIRF) Imaging Device SWOT Analysis
10.1.6 Stryker Recent Developments
10.2 Karl Storz
10.2.1 Karl Storz Near-infrared Fluorescence (NIRF) Imaging Device Basic Information
10.2.2 Karl Storz Near-infrared Fluorescence (NIRF) Imaging Device Product Overview
10.2.3 Karl Storz Near-infrared Fluorescence (NIRF) Imaging Device Product Market Performance
10.2.4 Karl Storz Business Overview
10.2.5 Karl Storz Near-infrared Fluorescence (NIRF) Imaging Device SWOT Analysis
10.2.6 Karl Storz Recent Developments
10.3 Olympus
10.3.1 Olympus Near-infrared Fluorescence (NIRF) Imaging Device Basic Information
10.3.2 Olympus Near-infrared Fluorescence (NIRF) Imaging Device Product Overview
10.3.3 Olympus Near-infrared Fluorescence (NIRF) Imaging Device Product Market Performance
10.3.4 Olympus Near-infrared Fluorescence (NIRF) Imaging Device SWOT Analysis
10.3.5 Olympus Business Overview
10.3.6 Olympus Recent Developments
10.4 Medtronic
10.4.1 Medtronic Near-infrared Fluorescence (NIRF) Imaging Device Basic Information
10.4.2 Medtronic Near-infrared Fluorescence (NIRF) Imaging Device Product Overview
10.4.3 Medtronic Near-infrared Fluorescence (NIRF) Imaging Device Product Market Performance
10.4.4 Medtronic Business Overview
10.4.5 Medtronic Recent Developments
10.5 Leica Microsystems (Danaher)
10.5.1 Leica Microsystems (Danaher) Near-infrared Fluorescence (NIRF) Imaging Device Basic Information
10.5.2 Leica Microsystems (Danaher) Near-infrared Fluorescence (NIRF) Imaging Device Product Overview
10.5.3 Leica Microsystems (Danaher) Near-infrared Fluorescence (NIRF) Imaging Device Product Market Performance
10.5.4 Leica Microsystems (Danaher) Business Overview
10.5.5 Leica Microsystems (Danaher) Recent Developments
10.6 Shimadzu
10.6.1 Shimadzu Near-infrared Fluorescence (NIRF) Imaging Device Basic Information
10.6.2 Shimadzu Near-infrared Fluorescence (NIRF) Imaging Device Product Overview
10.6.3 Shimadzu Near-infrared Fluorescence (NIRF) Imaging Device Product Market Performance
10.6.4 Shimadzu Business Overview
10.6.5 Shimadzu Recent Developments
10.7 Hamamatsu
10.7.1 Hamamatsu Near-infrared Fluorescence (NIRF) Imaging Device Basic Information
10.7.2 Hamamatsu Near-infrared Fluorescence (NIRF) Imaging Device Product Overview
10.7.3 Hamamatsu Near-infrared Fluorescence (NIRF) Imaging Device Product Market Performance
10.7.4 Hamamatsu Business Overview
10.7.5 Hamamatsu Recent Developments
10.8 Mizuho Medical
10.8.1 Mizuho Medical Near-infrared Fluorescence (NIRF) Imaging Device Basic Information
10.8.2 Mizuho Medical Near-infrared Fluorescence (NIRF) Imaging Device Product Overview
10.8.3 Mizuho Medical Near-infrared Fluorescence (NIRF) Imaging Device Product Market Performance
10.8.4 Mizuho Medical Business Overview
10.8.5 Mizuho Medical Recent Developments
10.9 Fluoptics
10.9.1 Fluoptics Near-infrared Fluorescence (NIRF) Imaging Device Basic Information
10.9.2 Fluoptics Near-infrared Fluorescence (NIRF) Imaging Device Product Overview
10.9.3 Fluoptics Near-infrared Fluorescence (NIRF) Imaging Device Product Market Performance
10.9.4 Fluoptics Business Overview
10.9.5 Fluoptics Recent Developments
10.10 Optomedic
10.10.1 Optomedic Near-infrared Fluorescence (NIRF) Imaging Device Basic Information
10.10.2 Optomedic Near-infrared Fluorescence (NIRF) Imaging Device Product Overview
10.10.3 Optomedic Near-infrared Fluorescence (NIRF) Imaging Device Product Market Performance
10.10.4 Optomedic Business Overview
10.10.5 Optomedic Recent Developments
11 Near-infrared Fluorescence (NIRF) Imaging Device Market Forecast by Region
11.1 Global Near-infrared Fluorescence (NIRF) Imaging Device Market Size Forecast
11.2 Global Near-infrared Fluorescence (NIRF) Imaging Device Market Forecast by Region
11.2.1 North America Market Size Forecast by Country
11.2.2 Europe Near-infrared Fluorescence (NIRF) Imaging Device Market Size Forecast by Country
11.2.3 Asia Pacific Near-infrared Fluorescence (NIRF) Imaging Device Market Size Forecast by Region
11.2.4 South America Near-infrared Fluorescence (NIRF) Imaging Device Market Size Forecast by Country
11.2.5 Middle East and Africa Forecasted Consumption of Near-infrared Fluorescence (NIRF) Imaging Device by Country
12 Forecast Market by Type and by Application (2025-2032)
12.1 Global Near-infrared Fluorescence (NIRF) Imaging Device Market Forecast by Type (2025-2032)
12.1.1 Global Forecasted Sales of Near-infrared Fluorescence (NIRF) Imaging Device by Type (2025-2032)
12.1.2 Global Near-infrared Fluorescence (NIRF) Imaging Device Market Size Forecast by Type (2025-2032)
12.1.3 Global Forecasted Price of Near-infrared Fluorescence (NIRF) Imaging Device by Type (2025-2032)
12.2 Global Near-infrared Fluorescence (NIRF) Imaging Device Market Forecast by Application (2025-2032)
12.2.1 Global Near-infrared Fluorescence (NIRF) Imaging Device Sales (K Units) Forecast by Application
12.2.2 Global Near-infrared Fluorescence (NIRF) Imaging Device Market Size (M USD) Forecast by Application (2025-2032)
13 Conclusion and Key Findings
LIST OF TABLES & FIGURES
List of Tables
Table 1. Introduction of the Type
Table 2. Introduction of the Application
Table 3. Market Size (M USD) Segment Executive Summary
Table 4. Near-infrared Fluorescence (NIRF) Imaging Device Market Size Comparison by Region (M USD)
Table 5. Global Near-infrared Fluorescence (NIRF) Imaging Device Sales (K Units) by Manufacturers (2019-2025)
Table 6. Global Near-infrared Fluorescence (NIRF) Imaging Device Sales Market Share by Manufacturers (2019-2025)
Table 7. Global Near-infrared Fluorescence (NIRF) Imaging Device Revenue (M USD) by Manufacturers (2019-2025)
Table 8. Global Near-infrared Fluorescence (NIRF) Imaging Device Revenue Share by Manufacturers (2019-2025)
Table 9. Company Type (Tier 1, Tier 2, and Tier 3) & (based on the Revenue in Near-infrared Fluorescence (NIRF) Imaging Device as of 2022)
Table 10. Global Market Near-infrared Fluorescence (NIRF) Imaging Device Average Price (USD/Unit) of Key Manufacturers (2019-2025)
Table 11. Manufacturers Near-infrared Fluorescence (NIRF) Imaging Device Sales Sites and Area Served
Table 12. Manufacturers Near-infrared Fluorescence (NIRF) Imaging Device Product Type
Table 13. Global Near-infrared Fluorescence (NIRF) Imaging Device Manufacturers Market Concentration Ratio (CR5 and HHI)
Table 14. Mergers & Acquisitions, Expansion Plans
Table 15. Industry Chain Map of Near-infrared Fluorescence (NIRF) Imaging Device
Table 16. Market Overview of Key Raw Materials
Table 17. Midstream Market Analysis
Table 18. Downstream Customer Analysis
Table 19. Key Development Trends
Table 20. Driving Factors
Table 21. Near-infrared Fluorescence (NIRF) Imaging Device Market Challenges
Table 22. Global Near-infrared Fluorescence (NIRF) Imaging Device Sales by Type (K Units)
Table 23. Global Near-infrared Fluorescence (NIRF) Imaging Device Market Size by Type (M USD)
Table 24. Global Near-infrared Fluorescence (NIRF) Imaging Device Sales (K Units) by Type (2019-2025)
Table 25. Global Near-infrared Fluorescence (NIRF) Imaging Device Sales Market Share by Type (2019-2025)
Table 26. Global Near-infrared Fluorescence (NIRF) Imaging Device Market Size (M USD) by Type (2019-2025)
Table 27. Global Near-infrared Fluorescence (NIRF) Imaging Device Market Size Share by Type (2019-2025)
Table 28. Global Near-infrared Fluorescence (NIRF) Imaging Device Price (USD/Unit) by Type (2019-2025)
Table 29. Global Near-infrared Fluorescence (NIRF) Imaging Device Sales (K Units) by Application
Table 30. Global Near-infrared Fluorescence (NIRF) Imaging Device Market Size by Application
Table 31. Global Near-infrared Fluorescence (NIRF) Imaging Device Sales by Application (2019-2025) & (K Units)
Table 32. Global Near-infrared Fluorescence (NIRF) Imaging Device Sales Market Share by Application (2019-2025)
Table 33. Global Near-infrared Fluorescence (NIRF) Imaging Device Sales by Application (2019-2025) & (M USD)
Table 34. Global Near-infrared Fluorescence (NIRF) Imaging Device Market Share by Application (2019-2025)
Table 35. Global Near-infrared Fluorescence (NIRF) Imaging Device Sales Growth Rate by Application (2019-2025)
Table 36. Global Near-infrared Fluorescence (NIRF) Imaging Device Sales by Region (2019-2025) & (K Units)
Table 37. Global Near-infrared Fluorescence (NIRF) Imaging Device Sales Market Share by Region (2019-2025)
Table 38. North America Near-infrared Fluorescence (NIRF) Imaging Device Sales by Country (2019-2025) & (K Units)
Table 39. Europe Near-infrared Fluorescence (NIRF) Imaging Device Sales by Country (2019-2025) & (K Units)
Table 40. Asia Pacific Near-infrared Fluorescence (NIRF) Imaging Device Sales by Region (2019-2025) & (K Units)
Table 41. South America Near-infrared Fluorescence (NIRF) Imaging Device Sales by Country (2019-2025) & (K Units)
Table 42. Middle East and Africa Near-infrared Fluorescence (NIRF) Imaging Device Sales by Region (2019-2025) & (K Units)
Table 43. Global Near-infrared Fluorescence (NIRF) Imaging Device Production (K Units) by Region (2019-2025)
Table 44. Global Near-infrared Fluorescence (NIRF) Imaging Device Revenue (US$ Million) by Region (2019-2025)
Table 45. Global Near-infrared Fluorescence (NIRF) Imaging Device Revenue Market Share by Region (2019-2025)
Table 46. Global Near-infrared Fluorescence (NIRF) Imaging Device Production (K Units), Revenue (US$ Million), Price (USD/Unit) and Gross Margin (2019-2025)
Table 47. North America Near-infrared Fluorescence (NIRF) Imaging Device Production (K Units), Revenue (US$ Million), Price (USD/Unit) and Gross Margin (2019-2025)
Table 48. Europe Near-infrared Fluorescence (NIRF) Imaging Device Production (K Units), Revenue (US$ Million), Price (USD/Unit) and Gross Margin (2019-2025)
Table 49. Japan Near-infrared Fluorescence (NIRF) Imaging Device Production (K Units), Revenue (US$ Million), Price (USD/Unit) and Gross Margin (2019-2025)
Table 50. China Near-infrared Fluorescence (NIRF) Imaging Device Production (K Units), Revenue (US$ Million), Price (USD/Unit) and Gross Margin (2019-2025)
Table 51. Stryker Near-infrared Fluorescence (NIRF) Imaging Device Basic Information
Table 52. Stryker Near-infrared Fluorescence (NIRF) Imaging Device Product Overview
Table 53. Stryker Near-infrared Fluorescence (NIRF) Imaging Device Sales (K Units), Revenue (M USD), Price (USD/Unit) and Gross Margin (2019-2025)
Table 54. Stryker Business Overview
Table 55. Stryker Near-infrared Fluorescence (NIRF) Imaging Device SWOT Analysis
Table 56. Stryker Recent Developments
Table 57. Karl Storz Near-infrared Fluorescence (NIRF) Imaging Device Basic Information
Table 58. Karl Storz Near-infrared Fluorescence (NIRF) Imaging Device Product Overview
Table 59. Karl Storz Near-infrared Fluorescence (NIRF) Imaging Device Sales (K Units), Revenue (M USD), Price (USD/Unit) and Gross Margin (2019-2025)
Table 60. Karl Storz Business Overview
Table 61. Karl Storz Near-infrared Fluorescence (NIRF) Imaging Device SWOT Analysis
Table 62. Karl Storz Recent Developments
Table 63. Olympus Near-infrared Fluorescence (NIRF) Imaging Device Basic Information
Table 64. Olympus Near-infrared Fluorescence (NIRF) Imaging Device Product Overview
Table 65. Olympus Near-infrared Fluorescence (NIRF) Imaging Device Sales (K Units), Revenue (M USD), Price (USD/Unit) and Gross Margin (2019-2025)
Table 66. Olympus Near-infrared Fluorescence (NIRF) Imaging Device SWOT Analysis
Table 67. Olympus Business Overview
Table 68. Olympus Recent Developments
Table 69. Medtronic Near-infrared Fluorescence (NIRF) Imaging Device Basic Information
Table 70. Medtronic Near-infrared Fluorescence (NIRF) Imaging Device Product Overview
Table 71. Medtronic Near-infrared Fluorescence (NIRF) Imaging Device Sales (K Units), Revenue (M USD), Price (USD/Unit) and Gross Margin (2019-2025)
Table 72. Medtronic Business Overview
Table 73. Medtronic Recent Developments
Table 74. Leica Microsystems (Danaher) Near-infrared Fluorescence (NIRF) Imaging Device Basic Information
Table 75. Leica Microsystems (Danaher) Near-infrared Fluorescence (NIRF) Imaging Device Product Overview
Table 76. Leica Microsystems (Danaher) Near-infrared Fluorescence (NIRF) Imaging Device Sales (K Units), Revenue (M USD), Price (USD/Unit) and Gross Margin (2019-2025)
Table 77. Leica Microsystems (Danaher) Business Overview
Table 78. Leica Microsystems (Danaher) Recent Developments
Table 79. Shimadzu Near-infrared Fluorescence (NIRF) Imaging Device Basic Information
Table 80. Shimadzu Near-infrared Fluorescence (NIRF) Imaging Device Product Overview
Table 81. Shimadzu Near-infrared Fluorescence (NIRF) Imaging Device Sales (K Units), Revenue (M USD), Price (USD/Unit) and Gross Margin (2019-2025)
Table 82. Shimadzu Business Overview
Table 83. Shimadzu Recent Developments
Table 84. Hamamatsu Near-infrared Fluorescence (NIRF) Imaging Device Basic Information
Table 85. Hamamatsu Near-infrared Fluorescence (NIRF) Imaging Device Product Overview
Table 86. Hamamatsu Near-infrared Fluorescence (NIRF) Imaging Device Sales (K Units), Revenue (M USD), Price (USD/Unit) and Gross Margin (2019-2025)
Table 87. Hamamatsu Business Overview
Table 88. Hamamatsu Recent Developments
Table 89. Mizuho Medical Near-infrared Fluorescence (NIRF) Imaging Device Basic Information
Table 90. Mizuho Medical Near-infrared Fluorescence (NIRF) Imaging Device Product Overview
Table 91. Mizuho Medical Near-infrared Fluorescence (NIRF) Imaging Device Sales (K Units), Revenue (M USD), Price (USD/Unit) and Gross Margin (2019-2025)
Table 92. Mizuho Medical Business Overview
Table 93. Mizuho Medical Recent Developments
Table 94. Fluoptics Near-infrared Fluorescence (NIRF) Imaging Device Basic Information
Table 95. Fluoptics Near-infrared Fluorescence (NIRF) Imaging Device Product Overview
Table 96. Fluoptics Near-infrared Fluorescence (NIRF) Imaging Device Sales (K Units), Revenue (M USD), Price (USD/Unit) and Gross Margin (2019-2025)
Table 97. Fluoptics Business Overview
Table 98. Fluoptics Recent Developments
Table 99. Optomedic Near-infrared Fluorescence (NIRF) Imaging Device Basic Information
Table 100. Optomedic Near-infrared Fluorescence (NIRF) Imaging Device Product Overview
Table 101. Optomedic Near-infrared Fluorescence (NIRF) Imaging Device Sales (K Units), Revenue (M USD), Price (USD/Unit) and Gross Margin (2019-2025)
Table 102. Optomedic Business Overview
Table 103. Optomedic Recent Developments
Table 104. Global Near-infrared Fluorescence (NIRF) Imaging Device Sales Forecast by Region (2025-2032) & (K Units)
Table 105. Global Near-infrared Fluorescence (NIRF) Imaging Device Market Size Forecast by Region (2025-2032) & (M USD)
Table 106. North America Near-infrared Fluorescence (NIRF) Imaging Device Sales Forecast by Country (2025-2032) & (K Units)
Table 107. North America Near-infrared Fluorescence (NIRF) Imaging Device Market Size Forecast by Country (2025-2032) & (M USD)
Table 108. Europe Near-infrared Fluorescence (NIRF) Imaging Device Sales Forecast by Country (2025-2032) & (K Units)
Table 109. Europe Near-infrared Fluorescence (NIRF) Imaging Device Market Size Forecast by Country (2025-2032) & (M USD)
Table 110. Asia Pacific Near-infrared Fluorescence (NIRF) Imaging Device Sales Forecast by Region (2025-2032) & (K Units)
Table 111. Asia Pacific Near-infrared Fluorescence (NIRF) Imaging Device Market Size Forecast by Region (2025-2032) & (M USD)
Table 112. South America Near-infrared Fluorescence (NIRF) Imaging Device Sales Forecast by Country (2025-2032) & (K Units)
Table 113. South America Near-infrared Fluorescence (NIRF) Imaging Device Market Size Forecast by Country (2025-2032) & (M USD)
Table 114. Middle East and Africa Near-infrared Fluorescence (NIRF) Imaging Device Consumption Forecast by Country (2025-2032) & (Units)
Table 115. Middle East and Africa Near-infrared Fluorescence (NIRF) Imaging Device Market Size Forecast by Country (2025-2032) & (M USD)
Table 116. Global Near-infrared Fluorescence (NIRF) Imaging Device Sales Forecast by Type (2025-2032) & (K Units)
Table 117. Global Near-infrared Fluorescence (NIRF) Imaging Device Market Size Forecast by Type (2025-2032) & (M USD)
Table 118. Global Near-infrared Fluorescence (NIRF) Imaging Device Price Forecast by Type (2025-2032) & (USD/Unit)
Table 119. Global Near-infrared Fluorescence (NIRF) Imaging Device Sales (K Units) Forecast by Application (2025-2032)
Table 120. Global Near-infrared Fluorescence (NIRF) Imaging Device Market Size Forecast by Application (2025-2032) & (M USD)
List of Figures
Figure 1. Product Picture of Near-infrared Fluorescence (NIRF) Imaging Device
Figure 2. Data Triangulation
Figure 3. Key Caveats
Figure 4. Global Near-infrared Fluorescence (NIRF) Imaging Device Market Size (M USD), 2019-2032
Figure 5. Global Near-infrared Fluorescence (NIRF) Imaging Device Market Size (M USD) (2019-2032)
Figure 6. Global Near-infrared Fluorescence (NIRF) Imaging Device Sales (K Units) & (2019-2032)
Figure 7. Evaluation Matrix of Segment Market Development Potential (Type)
Figure 8. Evaluation Matrix of Segment Market Development Potential (Application)
Figure 9. Evaluation Matrix of Regional Market Development Potential
Figure 10. Near-infrared Fluorescence (NIRF) Imaging Device Market Size by Country (M USD)
Figure 11. Near-infrared Fluorescence (NIRF) Imaging Device Sales Share by Manufacturers in 2023
Figure 12. Global Near-infrared Fluorescence (NIRF) Imaging Device Revenue Share by Manufacturers in 2023
Figure 13. Near-infrared Fluorescence (NIRF) Imaging Device Market Share by Company Type (Tier 1, Tier 2 and Tier 3): 2023
Figure 14. Global Market Near-infrared Fluorescence (NIRF) Imaging Device Average Price (USD/Unit) of Key Manufacturers in 2023
Figure 15. The Global 5 and 10 Largest Players: Market Share by Near-infrared Fluorescence (NIRF) Imaging Device Revenue in 2023
Figure 16. Evaluation Matrix of Segment Market Development Potential (Type)
Figure 17. Global Near-infrared Fluorescence (NIRF) Imaging Device Market Share by Type
Figure 18. Sales Market Share of Near-infrared Fluorescence (NIRF) Imaging Device by Type (2019-2025)
Figure 19. Sales Market Share of Near-infrared Fluorescence (NIRF) Imaging Device by Type in 2023
Figure 20. Market Size Share of Near-infrared Fluorescence (NIRF) Imaging Device by Type (2019-2025)
Figure 21. Market Size Market Share of Near-infrared Fluorescence (NIRF) Imaging Device by Type in 2023
Figure 22. Evaluation Matrix of Segment Market Development Potential (Application)
Figure 23. Global Near-infrared Fluorescence (NIRF) Imaging Device Market Share by Application
Figure 24. Global Near-infrared Fluorescence (NIRF) Imaging Device Sales Market Share by Application (2019-2025)
Figure 25. Global Near-infrared Fluorescence (NIRF) Imaging Device Sales Market Share by Application in 2023
Figure 26. Global Near-infrared Fluorescence (NIRF) Imaging Device Market Share by Application (2019-2025)
Figure 27. Global Near-infrared Fluorescence (NIRF) Imaging Device Market Share by Application in 2023
Figure 28. Global Near-infrared Fluorescence (NIRF) Imaging Device Sales Growth Rate by Application (2019-2025)
Figure 29. Global Near-infrared Fluorescence (NIRF) Imaging Device Sales Market Share by Region (2019-2025)
Figure 30. North America Near-infrared Fluorescence (NIRF) Imaging Device Sales and Growth Rate (2019-2025) & (K Units)
Figure 31. North America Near-infrared Fluorescence (NIRF) Imaging Device Sales Market Share by Country in 2023
Figure 32. U.S. Near-infrared Fluorescence (NIRF) Imaging Device Sales and Growth Rate (2019-2025) & (K Units)
Figure 33. Canada Near-infrared Fluorescence (NIRF) Imaging Device Sales (K Units) and Growth Rate (2019-2025)
Figure 34. Mexico Near-infrared Fluorescence (NIRF) Imaging Device Sales (Units) and Growth Rate (2019-2025)
Figure 35. Europe Near-infrared Fluorescence (NIRF) Imaging Device Sales and Growth Rate (2019-2025) & (K Units)
Figure 36. Europe Near-infrared Fluorescence (NIRF) Imaging Device Sales Market Share by Country in 2023
Figure 37. Germany Near-infrared Fluorescence (NIRF) Imaging Device Sales and Growth Rate (2019-2025) & (K Units)
Figure 38. France Near-infrared Fluorescence (NIRF) Imaging Device Sales and Growth Rate (2019-2025) & (K Units)
Figure 39. U.K. Near-infrared Fluorescence (NIRF) Imaging Device Sales and Growth Rate (2019-2025) & (K Units)
Figure 40. Italy Near-infrared Fluorescence (NIRF) Imaging Device Sales and Growth Rate (2019-2025) & (K Units)
Figure 41. Russia Near-infrared Fluorescence (NIRF) Imaging Device Sales and Growth Rate (2019-2025) & (K Units)
Figure 42. Asia Pacific Near-infrared Fluorescence (NIRF) Imaging Device Sales and Growth Rate (K Units)
Figure 43. Asia Pacific Near-infrared Fluorescence (NIRF) Imaging Device Sales Market Share by Region in 2023
Figure 44. China Near-infrared Fluorescence (NIRF) Imaging Device Sales and Growth Rate (2019-2025) & (K Units)
Figure 45. Japan Near-infrared Fluorescence (NIRF) Imaging Device Sales and Growth Rate (2019-2025) & (K Units)
Figure 46. South Korea Near-infrared Fluorescence (NIRF) Imaging Device Sales and Growth Rate (2019-2025) & (K Units)
Figure 47. India Near-infrared Fluorescence (NIRF) Imaging Device Sales and Growth Rate (2019-2025) & (K Units)
Figure 48. Southeast Asia Near-infrared Fluorescence (NIRF) Imaging Device Sales and Growth Rate (2019-2025) & (K Units)
Figure 49. South America Near-infrared Fluorescence (NIRF) Imaging Device Sales and Growth Rate (K Units)
Figure 50. South America Near-infrared Fluorescence (NIRF) Imaging Device Sales Market Share by Country in 2023
Figure 51. Brazil Near-infrared Fluorescence (NIRF) Imaging Device Sales and Growth Rate (2019-2025) & (K Units)
Figure 52. Argentina Near-infrared Fluorescence (NIRF) Imaging Device Sales and Growth Rate (2019-2025) & (K Units)
Figure 53. Columbia Near-infrared Fluorescence (NIRF) Imaging Device Sales and Growth Rate (2019-2025) & (K Units)
Figure 54. Middle East and Africa Near-infrared Fluorescence (NIRF) Imaging Device Sales and Growth Rate (K Units)
Figure 55. Middle East and Africa Near-infrared Fluorescence (NIRF) Imaging Device Sales Market Share by Region in 2023
Figure 56. Saudi Arabia Near-infrared Fluorescence (NIRF) Imaging Device Sales and Growth Rate (2019-2025) & (K Units)
Figure 57. UAE Near-infrared Fluorescence (NIRF) Imaging Device Sales and Growth Rate (2019-2025) & (K Units)
Figure 58. Egypt Near-infrared Fluorescence (NIRF) Imaging Device Sales and Growth Rate (2019-2025) & (K Units)
Figure 59. Nigeria Near-infrared Fluorescence (NIRF) Imaging Device Sales and Growth Rate (2019-2025) & (K Units)
Figure 60. South Africa Near-infrared Fluorescence (NIRF) Imaging Device Sales and Growth Rate (2019-2025) & (K Units)
Figure 61. Global Near-infrared Fluorescence (NIRF) Imaging Device Production Market Share by Region (2019-2025)
Figure 62. North America Near-infrared Fluorescence (NIRF) Imaging Device Production (K Units) Growth Rate (2019-2025)
Figure 63. Europe Near-infrared Fluorescence (NIRF) Imaging Device Production (K Units) Growth Rate (2019-2025)
Figure 64. Japan Near-infrared Fluorescence (NIRF) Imaging Device Production (K Units) Growth Rate (2019-2025)
Figure 65. China Near-infrared Fluorescence (NIRF) Imaging Device Production (K Units) Growth Rate (2019-2025)
Figure 66. Global Near-infrared Fluorescence (NIRF) Imaging Device Sales Forecast by Volume (2019-2032) & (K Units)
Figure 67. Global Near-infrared Fluorescence (NIRF) Imaging Device Market Size Forecast by Value (2019-2032) & (M USD)
Figure 68. Global Near-infrared Fluorescence (NIRF) Imaging Device Sales Market Share Forecast by Type (2025-2032)
Figure 69. Global Near-infrared Fluorescence (NIRF) Imaging Device Market Share Forecast by Type (2025-2032)
Figure 70. Global Near-infrared Fluorescence (NIRF) Imaging Device Sales Forecast by Application (2025-2032)
Figure 71. Global Near-infrared Fluorescence (NIRF) Imaging Device Market Share Forecast by Application (2025-2032)
 Imaging Device Market, Global Outlook and Forecast 2025-2032")
