Urinary incontinence is the involuntary leakage of urine, a condition that affects millions of people worldwide. This disorder can vary from mild, occasional leaks to a complete lack of bladder control. Non-surgical urinary incontinence treatment options provide effective ways to manage this condition without the need for invasive procedures. These treatments range from behavioral therapies to the use of medical devices and medications. Non-surgical treatments can be utilized alone or combined with other approaches, depending on the type and severity of incontinence.
The global Non-Surgical Urinary Incontinence Treatment market refers to the array of products and services designed to manage or alleviate urinary incontinence symptoms without requiring surgery. These treatments are particularly beneficial for those who are not candidates for surgical options or prefer non-invasive solutions. Popular treatment options include biofeedback, electrical stimulation therapies, and medications, along with other advanced devices that aid in bladder control and muscle strengthening.
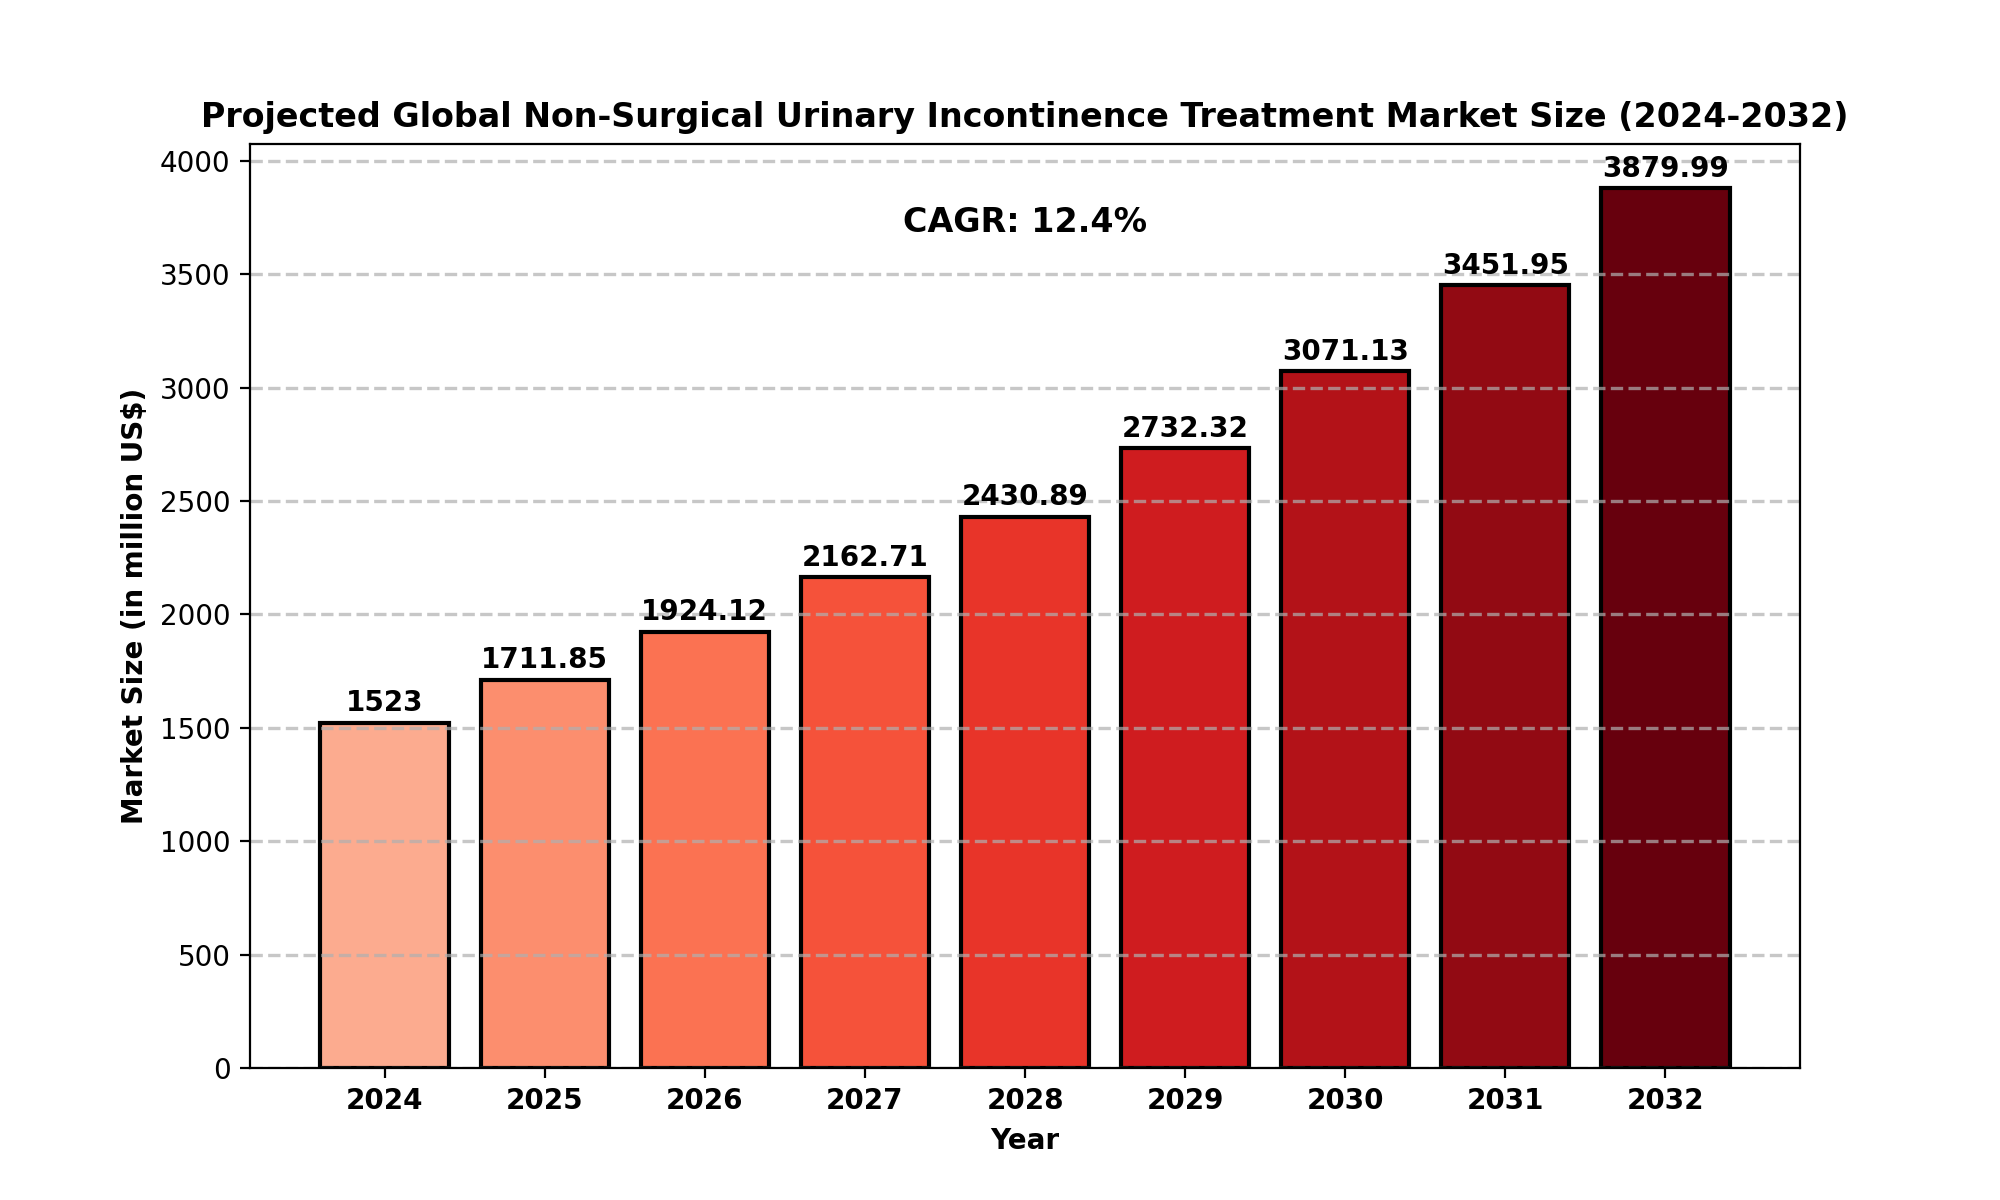
Market Size
The global Non-Surgical Urinary Incontinence Treatment market is on a growth trajectory. The market size was estimated at USD 1,523 million in 2024 and is expected to grow at a robust compound annual growth rate (CAGR) of 12.40%, reaching USD 3,879.99 million by 2032.
North America is one of the largest markets for these treatments, with an estimated size of USD 485.69 million in 2024. The North American market is expected to grow at a CAGR of 10.63% from 2025 through 2032, driven by increasing awareness of urinary incontinence, the aging population, and the high adoption of advanced medical devices in the region.
As urinary incontinence continues to affect individuals globally, the demand for non-surgical treatment options is increasing. The growing focus on improving patient quality of life and reducing reliance on surgical procedures are key factors propelling market expansion. The market is also benefiting from innovations in medical technologies and a rise in healthcare spending.
Market Dynamics (Drivers, Restraints, Opportunities, and Challenges)
Drivers
Several factors are driving the growth of the non-surgical urinary incontinence treatment market:
- Aging Population: The aging global population is a significant driver for the market, as older adults are more prone to urinary incontinence.
- Increased Awareness: There is growing awareness about urinary incontinence and the available non-surgical treatment options. This has led to higher demand for non-invasive treatments that provide effective management of the condition.
- Advancements in Technology: Innovations in devices such as electrical stimulation units, biofeedback systems, and other non-surgical devices are making treatments more accessible and effective.
- Improved Patient Outcomes: Non-surgical treatments are becoming increasingly effective, offering patients improved outcomes without the need for surgical intervention.
Restraints
Despite the market's growth, there are several challenges that may hinder the widespread adoption of non-surgical urinary incontinence treatments:
- High Costs: Non-surgical treatments can sometimes be expensive, especially advanced medical devices. This could limit access for certain populations, particularly in emerging markets.
- Limited Insurance Coverage: In some regions, insurance may not cover non-surgical treatments adequately, leading to out-of-pocket expenses for patients.
- Resistance to Non-Surgical Options: Some patients may prefer surgical treatments due to the perception of faster or more permanent results, limiting the appeal of non-surgical alternatives.
Opportunities
The market offers numerous opportunities for expansion:
- Rising Demand for Home-Based Treatments: The convenience of home-based treatments, including at-home electrical stimulation devices, presents a growing opportunity in the market.
- Emerging Markets: There is a significant untapped market potential in regions like Asia-Pacific and South America, where awareness of urinary incontinence and available treatments is growing.
- Personalized Treatments: As healthcare becomes more personalized, tailored non-surgical treatment plans could become more prevalent, creating opportunities for specialized products.
Challenges
- Stigma Around Urinary Incontinence: There remains a societal stigma surrounding urinary incontinence, which may prevent some individuals from seeking treatment.
- Regulatory Hurdles: Medical devices and treatments for urinary incontinence are subject to rigorous regulations, which may delay market entry for new products.
Regional Analysis
North America
North America, especially the United States, remains the dominant market for non-surgical urinary incontinence treatments, owing to its aging population, advanced healthcare infrastructure, and increasing awareness. The market is expected to grow at a steady pace, driven by innovations in treatment options and the large healthcare expenditure in the region.
Europe
Europe is another key region for the market, with countries such as Germany, the UK, and France seeing a growing demand for non-surgical treatments. The European market benefits from high healthcare standards and a growing focus on patient-centered care.
Asia-Pacific
The Asia-Pacific region is poised for substantial growth in the coming years. Increasing awareness, improvements in healthcare access, and rising disposable income are propelling market growth in countries like China, India, and Japan. Moreover, the region is witnessing an increase in the number of people affected by urinary incontinence due to an aging population.
South America and Middle East & Africa
In South America and the Middle East & Africa, the market is still emerging, but increasing healthcare investments and a rise in the prevalence of urinary incontinence are expected to drive growth. Awareness campaigns and government health initiatives could further accelerate adoption in these regions.
Competitor Analysis
Medtronic
- Medtronic is a leader in the non-surgical urinary incontinence treatment market, with a range of innovative devices designed to manage bladder control. The company has a strong market presence and continues to invest in R&D to expand its product portfolio.
Boston Scientific Corporation
- Boston Scientific offers a variety of non-invasive treatments for urinary incontinence, including electrical stimulation therapies and other related devices. The company’s expertise in medical devices allows it to maintain a competitive edge.
Johnson & Johnson
- Johnson & Johnson’s extensive healthcare portfolio includes non-surgical urinary incontinence treatments, mainly focusing on medications and devices. Its global reach and brand recognition make it a key player in the market.
Cogentix Medical
- Cogentix Medical focuses on providing innovative solutions for urinary incontinence. The company is known for its advanced technologies and devices that target bladder dysfunction.
Coloplast Corp
- Coloplast is a significant player in the market, specializing in products such as catheters and other medical devices for urinary incontinence management. Their products are widely used in hospitals and clinics.
Ethicon
- Ethicon, a subsidiary of Johnson & Johnson, has a broad range of incontinence treatment solutions, including biofeedback and electrical stimulation therapies. The company’s focus on surgical and non-surgical treatments has made it a key market participant.
Global Non-Surgical Urinary Incontinence Treatment Market: Market Segmentation Analysis
This report provides a deep insight into the global Non-Surgical Urinary Incontinence Treatment market, covering all its essential aspects. This ranges from a macro overview of the market to micro details of the market size, competitive landscape, development trend, niche market, key market drivers and challenges, SWOT analysis, value chain analysis, etc.
The analysis helps the reader to shape the competition within the industries and strategies for the competitive environment to enhance the potential profit. Furthermore, it provides a simple framework for evaluating and assessing the position of the business organization. The report structure also focuses on the competitive landscape of the Global Non-Surgical Urinary Incontinence Treatment market. This report introduces in detail the market share, market performance, product situation, operation situation, etc., of the main players, which helps the readers in the industry to identify the main competitors and deeply understand the competition pattern of the market.
In a word, this report is a must-read for industry players, investors, researchers, consultants, business strategists, and all those who have any kind of stake or are planning to foray into the Non-Surgical Urinary Incontinence Treatment market in any manner.
Market Segmentation (by Application)
Market Segmentation (by Type)
- Biofeedback
- Electrical Stimulation
- Medications
- Others
Key Company
- Medtronic
- Boston Scientific Corporation
- Johnson & Johnson
- Cogentix Medical
- Coloplast Corp
- Ethicon
- InControl Medical
- Hollister Incorporated
- Atlantic Therapeutics
- ZSI Medical
- B. Braun Melsungen
- Teleflex Medical
- STORZ MEDICAL
- Lumenis
- NeoTract
Geographic Segmentation
- North America (USA, Canada, Mexico)
- Europe (Germany, UK, France, Russia, Italy, Rest of Europe)
- Asia-Pacific (China, Japan, South Korea, India, Southeast Asia, Rest of Asia-Pacific)
- South America (Brazil, Argentina, Columbia, Rest of South America)
- The Middle East and Africa (Saudi Arabia, UAE, Egypt, Nigeria, South Africa, Rest of MEA)
FAQ Section
What is the current market size of Non-Surgical Urinary Incontinence Treatment?
- The global market size is estimated at USD 1,523 million in 2024 and is projected to reach USD 4,361.11 million by 2032.
Which are the key companies operating in the Non-Surgical Urinary Incontinence Treatment market?
- Key companies include Medtronic, Boston Scientific Corporation, Johnson & Johnson, Cogentix Medical, Coloplast Corp, and several others.
What are the key growth drivers in the Non-Surgical Urinary Incontinence Treatment market?
- The key drivers include an aging population, increased awareness, advancements in medical technology, and improved patient outcomes.
Which regions dominate the Non-Surgical Urinary Incontinence Treatment market?
- North America currently dominates the market, followed by Europe and the Asia-Pacific region, which is expected to grow rapidly.
What are the emerging trends in the Non-Surgical Urinary Incontinence Treatment market?
- Emerging trends include a shift toward home-based treatments, increased use of personalized treatment options, and rising awareness in emerging markets.
Key Benefits of This Market Research:
- Industry drivers, restraints, and opportunities covered in the study
- Neutral perspective on the market performance
- Recent industry trends and developments
- Competitive landscape & strategies of key players
- Potential & niche segments and regions exhibiting promising growth covered
- Historical, current, and projected market size, in terms of value
- In-depth analysis of the Non-Surgical Urinary Incontinence Treatment Market
- Overview of the regional outlook of the Non-Surgical Urinary Incontinence Treatment Market:
Key Reasons to Buy this Report:
- Access to date statistics compiled by our researchers. These provide you with historical and forecast data, which is analyzed to tell you why your market is set to change
- This enables you to anticipate market changes to remain ahead of your competitors
- You will be able to copy data from the Excel spreadsheet straight into your marketing plans, business presentations, or other strategic documents
- The concise analysis, clear graph, and table format will enable you to pinpoint the information you require quickly
- Provision of market value data for each segment and sub-segment
- Indicates the region and segment that is expected to witness the fastest growth as well as to dominate the market
- Analysis by geography highlighting the consumption of the product/service in the region as well as indicating the factors that are affecting the market within each region
- Competitive landscape which incorporates the market ranking of the major players, along with new service/product launches, partnerships, business expansions, and acquisitions in the past five years of companies profiled
- Extensive company profiles comprising of company overview, company insights, product benchmarking, and SWOT analysis for the major market players
- The current as well as the future market outlook of the industry concerning recent developments which involve growth opportunities and drivers as well as challenges and restraints of both emerging as well as developed regions
- Includes in-depth analysis of the market from various perspectives through Porter
TABLE OF CONTENTS
Table of Contents
1 Research Methodology and Statistical Scope
1.1 Market Definition and Statistical Scope of Non-Surgical Urinary Incontinence Treatment
1.2 Key Market Segments
1.2.1 Non-Surgical Urinary Incontinence Treatment Segment by Type
1.2.2 Non-Surgical Urinary Incontinence Treatment Segment by Application
1.3 Methodology & Sources of Information
1.3.1 Research Methodology
1.3.2 Research Process
1.3.3 Market Breakdown and Data Triangulation
1.3.4 Base Year
1.3.5 Report Assumptions & Caveats
2 Non-Surgical Urinary Incontinence Treatment Market Overview
2.1 Global Market Overview
2.1.1 Global Non-Surgical Urinary Incontinence Treatment Market Size (M USD) Estimates and Forecasts (2019-2032)
2.1.2 Global Non-Surgical Urinary Incontinence Treatment Sales Estimates and Forecasts (2019-2032)
2.2 Market Segment Executive Summary
2.3 Global Market Size by Region
3 Non-Surgical Urinary Incontinence Treatment Market Competitive Landscape
3.1 Global Non-Surgical Urinary Incontinence Treatment Sales by Manufacturers (2019-2025)
3.2 Global Non-Surgical Urinary Incontinence Treatment Revenue Market Share by Manufacturers (2019-2025)
3.3 Non-Surgical Urinary Incontinence Treatment Market Share by Company Type (Tier 1, Tier 2, and Tier 3)
3.4 Global Non-Surgical Urinary Incontinence Treatment Average Price by Manufacturers (2019-2025)
3.5 Manufacturers Non-Surgical Urinary Incontinence Treatment Sales Sites, Area Served, Product Type
3.6 Non-Surgical Urinary Incontinence Treatment Market Competitive Situation and Trends
3.6.1 Non-Surgical Urinary Incontinence Treatment Market Concentration Rate
3.6.2 Global 5 and 10 Largest Non-Surgical Urinary Incontinence Treatment Players Market Share by Revenue
3.6.3 Mergers & Acquisitions, Expansion
4 Non-Surgical Urinary Incontinence Treatment Industry Chain Analysis
4.1 Non-Surgical Urinary Incontinence Treatment Industry Chain Analysis
4.2 Market Overview of Key Raw Materials
4.3 Midstream Market Analysis
4.4 Downstream Customer Analysis
5 The Development and Dynamics of Non-Surgical Urinary Incontinence Treatment Market
5.1 Key Development Trends
5.2 Driving Factors
5.3 Market Challenges
5.4 Market Restraints
5.5 Industry News
5.5.1 New Product Developments
5.5.2 Mergers & Acquisitions
5.5.3 Expansions
5.5.4 Collaboration/Supply Contracts
5.6 Industry Policies
6 Non-Surgical Urinary Incontinence Treatment Market Segmentation by Type
6.1 Evaluation Matrix of Segment Market Development Potential (Type)
6.2 Global Non-Surgical Urinary Incontinence Treatment Sales Market Share by Type (2019-2025)
6.3 Global Non-Surgical Urinary Incontinence Treatment Market Size Market Share by Type (2019-2025)
6.4 Global Non-Surgical Urinary Incontinence Treatment Price by Type (2019-2025)
7 Non-Surgical Urinary Incontinence Treatment Market Segmentation by Application
7.1 Evaluation Matrix of Segment Market Development Potential (Application)
7.2 Global Non-Surgical Urinary Incontinence Treatment Market Sales by Application (2019-2025)
7.3 Global Non-Surgical Urinary Incontinence Treatment Market Size (M USD) by Application (2019-2025)
7.4 Global Non-Surgical Urinary Incontinence Treatment Sales Growth Rate by Application (2019-2025)
8 Non-Surgical Urinary Incontinence Treatment Market Consumption by Region
8.1 Global Non-Surgical Urinary Incontinence Treatment Sales by Region
8.1.1 Global Non-Surgical Urinary Incontinence Treatment Sales by Region
8.1.2 Global Non-Surgical Urinary Incontinence Treatment Sales Market Share by Region
8.2 North America
8.2.1 North America Non-Surgical Urinary Incontinence Treatment Sales by Country
8.2.2 U.S.
8.2.3 Canada
8.2.4 Mexico
8.3 Europe
8.3.1 Europe Non-Surgical Urinary Incontinence Treatment Sales by Country
8.3.2 Germany
8.3.3 France
8.3.4 U.K.
8.3.5 Italy
8.3.6 Russia
8.4 Asia Pacific
8.4.1 Asia Pacific Non-Surgical Urinary Incontinence Treatment Sales by Region
8.4.2 China
8.4.3 Japan
8.4.4 South Korea
8.4.5 India
8.4.6 Southeast Asia
8.5 South America
8.5.1 South America Non-Surgical Urinary Incontinence Treatment Sales by Country
8.5.2 Brazil
8.5.3 Argentina
8.5.4 Columbia
8.6 Middle East and Africa
8.6.1 Middle East and Africa Non-Surgical Urinary Incontinence Treatment Sales by Region
8.6.2 Saudi Arabia
8.6.3 UAE
8.6.4 Egypt
8.6.5 Nigeria
8.6.6 South Africa
9 Non-Surgical Urinary Incontinence Treatment Market Production by Region
9.1 Global Production of Non-Surgical Urinary Incontinence Treatment by Region (2019-2025)
9.2 Global Non-Surgical Urinary Incontinence Treatment Revenue Market Share by Region (2019-2025)
9.3 Global Non-Surgical Urinary Incontinence Treatment Production, Revenue, Price and Gross Margin (2019-2025)
9.4 North America Non-Surgical Urinary Incontinence Treatment Production
9.4.1 North America Non-Surgical Urinary Incontinence Treatment Production Growth Rate (2019-2025)
9.4.2 North America Non-Surgical Urinary Incontinence Treatment Production, Revenue, Price and Gross Margin (2019-2025)
9.5 Europe Non-Surgical Urinary Incontinence Treatment Production
9.5.1 Europe Non-Surgical Urinary Incontinence Treatment Production Growth Rate (2019-2025)
9.5.2 Europe Non-Surgical Urinary Incontinence Treatment Production, Revenue, Price and Gross Margin (2019-2025)
9.6 Japan Non-Surgical Urinary Incontinence Treatment Production (2019-2025)
9.6.1 Japan Non-Surgical Urinary Incontinence Treatment Production Growth Rate (2019-2025)
9.6.2 Japan Non-Surgical Urinary Incontinence Treatment Production, Revenue, Price and Gross Margin (2019-2025)
9.7 China Non-Surgical Urinary Incontinence Treatment Production (2019-2025)
9.7.1 China Non-Surgical Urinary Incontinence Treatment Production Growth Rate (2019-2025)
9.7.2 China Non-Surgical Urinary Incontinence Treatment Production, Revenue, Price and Gross Margin (2019-2025)
10 Key Companies Profile
10.1 Medtronic
10.1.1 Medtronic Non-Surgical Urinary Incontinence Treatment Basic Information
10.1.2 Medtronic Non-Surgical Urinary Incontinence Treatment Product Overview
10.1.3 Medtronic Non-Surgical Urinary Incontinence Treatment Product Market Performance
10.1.4 Medtronic Business Overview
10.1.5 Medtronic Non-Surgical Urinary Incontinence Treatment SWOT Analysis
10.1.6 Medtronic Recent Developments
10.2 Boston Scientific Corporation
10.2.1 Boston Scientific Corporation Non-Surgical Urinary Incontinence Treatment Basic Information
10.2.2 Boston Scientific Corporation Non-Surgical Urinary Incontinence Treatment Product Overview
10.2.3 Boston Scientific Corporation Non-Surgical Urinary Incontinence Treatment Product Market Performance
10.2.4 Boston Scientific Corporation Business Overview
10.2.5 Boston Scientific Corporation Non-Surgical Urinary Incontinence Treatment SWOT Analysis
10.2.6 Boston Scientific Corporation Recent Developments
10.3 Johnson and Johnson
10.3.1 Johnson and Johnson Non-Surgical Urinary Incontinence Treatment Basic Information
10.3.2 Johnson and Johnson Non-Surgical Urinary Incontinence Treatment Product Overview
10.3.3 Johnson and Johnson Non-Surgical Urinary Incontinence Treatment Product Market Performance
10.3.4 Johnson and Johnson Non-Surgical Urinary Incontinence Treatment SWOT Analysis
10.3.5 Johnson and Johnson Business Overview
10.3.6 Johnson and Johnson Recent Developments
10.4 Cogentix Medical
10.4.1 Cogentix Medical Non-Surgical Urinary Incontinence Treatment Basic Information
10.4.2 Cogentix Medical Non-Surgical Urinary Incontinence Treatment Product Overview
10.4.3 Cogentix Medical Non-Surgical Urinary Incontinence Treatment Product Market Performance
10.4.4 Cogentix Medical Business Overview
10.4.5 Cogentix Medical Recent Developments
10.5 Coloplast Corp
10.5.1 Coloplast Corp Non-Surgical Urinary Incontinence Treatment Basic Information
10.5.2 Coloplast Corp Non-Surgical Urinary Incontinence Treatment Product Overview
10.5.3 Coloplast Corp Non-Surgical Urinary Incontinence Treatment Product Market Performance
10.5.4 Coloplast Corp Business Overview
10.5.5 Coloplast Corp Recent Developments
10.6 Ethicon
10.6.1 Ethicon Non-Surgical Urinary Incontinence Treatment Basic Information
10.6.2 Ethicon Non-Surgical Urinary Incontinence Treatment Product Overview
10.6.3 Ethicon Non-Surgical Urinary Incontinence Treatment Product Market Performance
10.6.4 Ethicon Business Overview
10.6.5 Ethicon Recent Developments
10.7 InControl Medical
10.7.1 InControl Medical Non-Surgical Urinary Incontinence Treatment Basic Information
10.7.2 InControl Medical Non-Surgical Urinary Incontinence Treatment Product Overview
10.7.3 InControl Medical Non-Surgical Urinary Incontinence Treatment Product Market Performance
10.7.4 InControl Medical Business Overview
10.7.5 InControl Medical Recent Developments
10.8 Hollister Incorporated
10.8.1 Hollister Incorporated Non-Surgical Urinary Incontinence Treatment Basic Information
10.8.2 Hollister Incorporated Non-Surgical Urinary Incontinence Treatment Product Overview
10.8.3 Hollister Incorporated Non-Surgical Urinary Incontinence Treatment Product Market Performance
10.8.4 Hollister Incorporated Business Overview
10.8.5 Hollister Incorporated Recent Developments
10.9 Atlantic Therapeutics
10.9.1 Atlantic Therapeutics Non-Surgical Urinary Incontinence Treatment Basic Information
10.9.2 Atlantic Therapeutics Non-Surgical Urinary Incontinence Treatment Product Overview
10.9.3 Atlantic Therapeutics Non-Surgical Urinary Incontinence Treatment Product Market Performance
10.9.4 Atlantic Therapeutics Business Overview
10.9.5 Atlantic Therapeutics Recent Developments
10.10 ZSI Medical
10.10.1 ZSI Medical Non-Surgical Urinary Incontinence Treatment Basic Information
10.10.2 ZSI Medical Non-Surgical Urinary Incontinence Treatment Product Overview
10.10.3 ZSI Medical Non-Surgical Urinary Incontinence Treatment Product Market Performance
10.10.4 ZSI Medical Business Overview
10.10.5 ZSI Medical Recent Developments
10.11 B. Braun Melsungen
10.11.1 B. Braun Melsungen Non-Surgical Urinary Incontinence Treatment Basic Information
10.11.2 B. Braun Melsungen Non-Surgical Urinary Incontinence Treatment Product Overview
10.11.3 B. Braun Melsungen Non-Surgical Urinary Incontinence Treatment Product Market Performance
10.11.4 B. Braun Melsungen Business Overview
10.11.5 B. Braun Melsungen Recent Developments
10.12 Teleflex Medical
10.12.1 Teleflex Medical Non-Surgical Urinary Incontinence Treatment Basic Information
10.12.2 Teleflex Medical Non-Surgical Urinary Incontinence Treatment Product Overview
10.12.3 Teleflex Medical Non-Surgical Urinary Incontinence Treatment Product Market Performance
10.12.4 Teleflex Medical Business Overview
10.12.5 Teleflex Medical Recent Developments
10.13 STORZ MEDICAL
10.13.1 STORZ MEDICAL Non-Surgical Urinary Incontinence Treatment Basic Information
10.13.2 STORZ MEDICAL Non-Surgical Urinary Incontinence Treatment Product Overview
10.13.3 STORZ MEDICAL Non-Surgical Urinary Incontinence Treatment Product Market Performance
10.13.4 STORZ MEDICAL Business Overview
10.13.5 STORZ MEDICAL Recent Developments
10.14 Lumenis
10.14.1 Lumenis Non-Surgical Urinary Incontinence Treatment Basic Information
10.14.2 Lumenis Non-Surgical Urinary Incontinence Treatment Product Overview
10.14.3 Lumenis Non-Surgical Urinary Incontinence Treatment Product Market Performance
10.14.4 Lumenis Business Overview
10.14.5 Lumenis Recent Developments
10.15 NeoTract
10.15.1 NeoTract Non-Surgical Urinary Incontinence Treatment Basic Information
10.15.2 NeoTract Non-Surgical Urinary Incontinence Treatment Product Overview
10.15.3 NeoTract Non-Surgical Urinary Incontinence Treatment Product Market Performance
10.15.4 NeoTract Business Overview
10.15.5 NeoTract Recent Developments
11 Non-Surgical Urinary Incontinence Treatment Market Forecast by Region
11.1 Global Non-Surgical Urinary Incontinence Treatment Market Size Forecast
11.2 Global Non-Surgical Urinary Incontinence Treatment Market Forecast by Region
11.2.1 North America Market Size Forecast by Country
11.2.2 Europe Non-Surgical Urinary Incontinence Treatment Market Size Forecast by Country
11.2.3 Asia Pacific Non-Surgical Urinary Incontinence Treatment Market Size Forecast by Region
11.2.4 South America Non-Surgical Urinary Incontinence Treatment Market Size Forecast by Country
11.2.5 Middle East and Africa Forecasted Consumption of Non-Surgical Urinary Incontinence Treatment by Country
12 Forecast Market by Type and by Application (2025-2032)
12.1 Global Non-Surgical Urinary Incontinence Treatment Market Forecast by Type (2025-2032)
12.1.1 Global Forecasted Sales of Non-Surgical Urinary Incontinence Treatment by Type (2025-2032)
12.1.2 Global Non-Surgical Urinary Incontinence Treatment Market Size Forecast by Type (2025-2032)
12.1.3 Global Forecasted Price of Non-Surgical Urinary Incontinence Treatment by Type (2025-2032)
12.2 Global Non-Surgical Urinary Incontinence Treatment Market Forecast by Application (2025-2032)
12.2.1 Global Non-Surgical Urinary Incontinence Treatment Sales (K Units) Forecast by Application
12.2.2 Global Non-Surgical Urinary Incontinence Treatment Market Size (M USD) Forecast by Application (2025-2032)
13 Conclusion and Key Findings
LIST OF TABLES & FIGURES
List of Tables
Table 1. Introduction of the Type
Table 2. Introduction of the Application
Table 3. Market Size (M USD) Segment Executive Summary
Table 4. Non-Surgical Urinary Incontinence Treatment Market Size Comparison by Region (M USD)
Table 5. Global Non-Surgical Urinary Incontinence Treatment Sales (K Units) by Manufacturers (2019-2025)
Table 6. Global Non-Surgical Urinary Incontinence Treatment Sales Market Share by Manufacturers (2019-2025)
Table 7. Global Non-Surgical Urinary Incontinence Treatment Revenue (M USD) by Manufacturers (2019-2025)
Table 8. Global Non-Surgical Urinary Incontinence Treatment Revenue Share by Manufacturers (2019-2025)
Table 9. Company Type (Tier 1, Tier 2, and Tier 3) & (based on the Revenue in Non-Surgical Urinary Incontinence Treatment as of 2022)
Table 10. Global Market Non-Surgical Urinary Incontinence Treatment Average Price (USD/Unit) of Key Manufacturers (2019-2025)
Table 11. Manufacturers Non-Surgical Urinary Incontinence Treatment Sales Sites and Area Served
Table 12. Manufacturers Non-Surgical Urinary Incontinence Treatment Product Type
Table 13. Global Non-Surgical Urinary Incontinence Treatment Manufacturers Market Concentration Ratio (CR5 and HHI)
Table 14. Mergers & Acquisitions, Expansion Plans
Table 15. Industry Chain Map of Non-Surgical Urinary Incontinence Treatment
Table 16. Market Overview of Key Raw Materials
Table 17. Midstream Market Analysis
Table 18. Downstream Customer Analysis
Table 19. Key Development Trends
Table 20. Driving Factors
Table 21. Non-Surgical Urinary Incontinence Treatment Market Challenges
Table 22. Global Non-Surgical Urinary Incontinence Treatment Sales by Type (K Units)
Table 23. Global Non-Surgical Urinary Incontinence Treatment Market Size by Type (M USD)
Table 24. Global Non-Surgical Urinary Incontinence Treatment Sales (K Units) by Type (2019-2025)
Table 25. Global Non-Surgical Urinary Incontinence Treatment Sales Market Share by Type (2019-2025)
Table 26. Global Non-Surgical Urinary Incontinence Treatment Market Size (M USD) by Type (2019-2025)
Table 27. Global Non-Surgical Urinary Incontinence Treatment Market Size Share by Type (2019-2025)
Table 28. Global Non-Surgical Urinary Incontinence Treatment Price (USD/Unit) by Type (2019-2025)
Table 29. Global Non-Surgical Urinary Incontinence Treatment Sales (K Units) by Application
Table 30. Global Non-Surgical Urinary Incontinence Treatment Market Size by Application
Table 31. Global Non-Surgical Urinary Incontinence Treatment Sales by Application (2019-2025) & (K Units)
Table 32. Global Non-Surgical Urinary Incontinence Treatment Sales Market Share by Application (2019-2025)
Table 33. Global Non-Surgical Urinary Incontinence Treatment Sales by Application (2019-2025) & (M USD)
Table 34. Global Non-Surgical Urinary Incontinence Treatment Market Share by Application (2019-2025)
Table 35. Global Non-Surgical Urinary Incontinence Treatment Sales Growth Rate by Application (2019-2025)
Table 36. Global Non-Surgical Urinary Incontinence Treatment Sales by Region (2019-2025) & (K Units)
Table 37. Global Non-Surgical Urinary Incontinence Treatment Sales Market Share by Region (2019-2025)
Table 38. North America Non-Surgical Urinary Incontinence Treatment Sales by Country (2019-2025) & (K Units)
Table 39. Europe Non-Surgical Urinary Incontinence Treatment Sales by Country (2019-2025) & (K Units)
Table 40. Asia Pacific Non-Surgical Urinary Incontinence Treatment Sales by Region (2019-2025) & (K Units)
Table 41. South America Non-Surgical Urinary Incontinence Treatment Sales by Country (2019-2025) & (K Units)
Table 42. Middle East and Africa Non-Surgical Urinary Incontinence Treatment Sales by Region (2019-2025) & (K Units)
Table 43. Global Non-Surgical Urinary Incontinence Treatment Production (K Units) by Region (2019-2025)
Table 44. Global Non-Surgical Urinary Incontinence Treatment Revenue (US$ Million) by Region (2019-2025)
Table 45. Global Non-Surgical Urinary Incontinence Treatment Revenue Market Share by Region (2019-2025)
Table 46. Global Non-Surgical Urinary Incontinence Treatment Production (K Units), Revenue (US$ Million), Price (USD/Unit) and Gross Margin (2019-2025)
Table 47. North America Non-Surgical Urinary Incontinence Treatment Production (K Units), Revenue (US$ Million), Price (USD/Unit) and Gross Margin (2019-2025)
Table 48. Europe Non-Surgical Urinary Incontinence Treatment Production (K Units), Revenue (US$ Million), Price (USD/Unit) and Gross Margin (2019-2025)
Table 49. Japan Non-Surgical Urinary Incontinence Treatment Production (K Units), Revenue (US$ Million), Price (USD/Unit) and Gross Margin (2019-2025)
Table 50. China Non-Surgical Urinary Incontinence Treatment Production (K Units), Revenue (US$ Million), Price (USD/Unit) and Gross Margin (2019-2025)
Table 51. Medtronic Non-Surgical Urinary Incontinence Treatment Basic Information
Table 52. Medtronic Non-Surgical Urinary Incontinence Treatment Product Overview
Table 53. Medtronic Non-Surgical Urinary Incontinence Treatment Sales (K Units), Revenue (M USD), Price (USD/Unit) and Gross Margin (2019-2025)
Table 54. Medtronic Business Overview
Table 55. Medtronic Non-Surgical Urinary Incontinence Treatment SWOT Analysis
Table 56. Medtronic Recent Developments
Table 57. Boston Scientific Corporation Non-Surgical Urinary Incontinence Treatment Basic Information
Table 58. Boston Scientific Corporation Non-Surgical Urinary Incontinence Treatment Product Overview
Table 59. Boston Scientific Corporation Non-Surgical Urinary Incontinence Treatment Sales (K Units), Revenue (M USD), Price (USD/Unit) and Gross Margin (2019-2025)
Table 60. Boston Scientific Corporation Business Overview
Table 61. Boston Scientific Corporation Non-Surgical Urinary Incontinence Treatment SWOT Analysis
Table 62. Boston Scientific Corporation Recent Developments
Table 63. Johnson and Johnson Non-Surgical Urinary Incontinence Treatment Basic Information
Table 64. Johnson and Johnson Non-Surgical Urinary Incontinence Treatment Product Overview
Table 65. Johnson and Johnson Non-Surgical Urinary Incontinence Treatment Sales (K Units), Revenue (M USD), Price (USD/Unit) and Gross Margin (2019-2025)
Table 66. Johnson and Johnson Non-Surgical Urinary Incontinence Treatment SWOT Analysis
Table 67. Johnson and Johnson Business Overview
Table 68. Johnson and Johnson Recent Developments
Table 69. Cogentix Medical Non-Surgical Urinary Incontinence Treatment Basic Information
Table 70. Cogentix Medical Non-Surgical Urinary Incontinence Treatment Product Overview
Table 71. Cogentix Medical Non-Surgical Urinary Incontinence Treatment Sales (K Units), Revenue (M USD), Price (USD/Unit) and Gross Margin (2019-2025)
Table 72. Cogentix Medical Business Overview
Table 73. Cogentix Medical Recent Developments
Table 74. Coloplast Corp Non-Surgical Urinary Incontinence Treatment Basic Information
Table 75. Coloplast Corp Non-Surgical Urinary Incontinence Treatment Product Overview
Table 76. Coloplast Corp Non-Surgical Urinary Incontinence Treatment Sales (K Units), Revenue (M USD), Price (USD/Unit) and Gross Margin (2019-2025)
Table 77. Coloplast Corp Business Overview
Table 78. Coloplast Corp Recent Developments
Table 79. Ethicon Non-Surgical Urinary Incontinence Treatment Basic Information
Table 80. Ethicon Non-Surgical Urinary Incontinence Treatment Product Overview
Table 81. Ethicon Non-Surgical Urinary Incontinence Treatment Sales (K Units), Revenue (M USD), Price (USD/Unit) and Gross Margin (2019-2025)
Table 82. Ethicon Business Overview
Table 83. Ethicon Recent Developments
Table 84. InControl Medical Non-Surgical Urinary Incontinence Treatment Basic Information
Table 85. InControl Medical Non-Surgical Urinary Incontinence Treatment Product Overview
Table 86. InControl Medical Non-Surgical Urinary Incontinence Treatment Sales (K Units), Revenue (M USD), Price (USD/Unit) and Gross Margin (2019-2025)
Table 87. InControl Medical Business Overview
Table 88. InControl Medical Recent Developments
Table 89. Hollister Incorporated Non-Surgical Urinary Incontinence Treatment Basic Information
Table 90. Hollister Incorporated Non-Surgical Urinary Incontinence Treatment Product Overview
Table 91. Hollister Incorporated Non-Surgical Urinary Incontinence Treatment Sales (K Units), Revenue (M USD), Price (USD/Unit) and Gross Margin (2019-2025)
Table 92. Hollister Incorporated Business Overview
Table 93. Hollister Incorporated Recent Developments
Table 94. Atlantic Therapeutics Non-Surgical Urinary Incontinence Treatment Basic Information
Table 95. Atlantic Therapeutics Non-Surgical Urinary Incontinence Treatment Product Overview
Table 96. Atlantic Therapeutics Non-Surgical Urinary Incontinence Treatment Sales (K Units), Revenue (M USD), Price (USD/Unit) and Gross Margin (2019-2025)
Table 97. Atlantic Therapeutics Business Overview
Table 98. Atlantic Therapeutics Recent Developments
Table 99. ZSI Medical Non-Surgical Urinary Incontinence Treatment Basic Information
Table 100. ZSI Medical Non-Surgical Urinary Incontinence Treatment Product Overview
Table 101. ZSI Medical Non-Surgical Urinary Incontinence Treatment Sales (K Units), Revenue (M USD), Price (USD/Unit) and Gross Margin (2019-2025)
Table 102. ZSI Medical Business Overview
Table 103. ZSI Medical Recent Developments
Table 104. B. Braun Melsungen Non-Surgical Urinary Incontinence Treatment Basic Information
Table 105. B. Braun Melsungen Non-Surgical Urinary Incontinence Treatment Product Overview
Table 106. B. Braun Melsungen Non-Surgical Urinary Incontinence Treatment Sales (K Units), Revenue (M USD), Price (USD/Unit) and Gross Margin (2019-2025)
Table 107. B. Braun Melsungen Business Overview
Table 108. B. Braun Melsungen Recent Developments
Table 109. Teleflex Medical Non-Surgical Urinary Incontinence Treatment Basic Information
Table 110. Teleflex Medical Non-Surgical Urinary Incontinence Treatment Product Overview
Table 111. Teleflex Medical Non-Surgical Urinary Incontinence Treatment Sales (K Units), Revenue (M USD), Price (USD/Unit) and Gross Margin (2019-2025)
Table 112. Teleflex Medical Business Overview
Table 113. Teleflex Medical Recent Developments
Table 114. STORZ MEDICAL Non-Surgical Urinary Incontinence Treatment Basic Information
Table 115. STORZ MEDICAL Non-Surgical Urinary Incontinence Treatment Product Overview
Table 116. STORZ MEDICAL Non-Surgical Urinary Incontinence Treatment Sales (K Units), Revenue (M USD), Price (USD/Unit) and Gross Margin (2019-2025)
Table 117. STORZ MEDICAL Business Overview
Table 118. STORZ MEDICAL Recent Developments
Table 119. Lumenis Non-Surgical Urinary Incontinence Treatment Basic Information
Table 120. Lumenis Non-Surgical Urinary Incontinence Treatment Product Overview
Table 121. Lumenis Non-Surgical Urinary Incontinence Treatment Sales (K Units), Revenue (M USD), Price (USD/Unit) and Gross Margin (2019-2025)
Table 122. Lumenis Business Overview
Table 123. Lumenis Recent Developments
Table 124. NeoTract Non-Surgical Urinary Incontinence Treatment Basic Information
Table 125. NeoTract Non-Surgical Urinary Incontinence Treatment Product Overview
Table 126. NeoTract Non-Surgical Urinary Incontinence Treatment Sales (K Units), Revenue (M USD), Price (USD/Unit) and Gross Margin (2019-2025)
Table 127. NeoTract Business Overview
Table 128. NeoTract Recent Developments
Table 129. Global Non-Surgical Urinary Incontinence Treatment Sales Forecast by Region (2025-2032) & (K Units)
Table 130. Global Non-Surgical Urinary Incontinence Treatment Market Size Forecast by Region (2025-2032) & (M USD)
Table 131. North America Non-Surgical Urinary Incontinence Treatment Sales Forecast by Country (2025-2032) & (K Units)
Table 132. North America Non-Surgical Urinary Incontinence Treatment Market Size Forecast by Country (2025-2032) & (M USD)
Table 133. Europe Non-Surgical Urinary Incontinence Treatment Sales Forecast by Country (2025-2032) & (K Units)
Table 134. Europe Non-Surgical Urinary Incontinence Treatment Market Size Forecast by Country (2025-2032) & (M USD)
Table 135. Asia Pacific Non-Surgical Urinary Incontinence Treatment Sales Forecast by Region (2025-2032) & (K Units)
Table 136. Asia Pacific Non-Surgical Urinary Incontinence Treatment Market Size Forecast by Region (2025-2032) & (M USD)
Table 137. South America Non-Surgical Urinary Incontinence Treatment Sales Forecast by Country (2025-2032) & (K Units)
Table 138. South America Non-Surgical Urinary Incontinence Treatment Market Size Forecast by Country (2025-2032) & (M USD)
Table 139. Middle East and Africa Non-Surgical Urinary Incontinence Treatment Consumption Forecast by Country (2025-2032) & (Units)
Table 140. Middle East and Africa Non-Surgical Urinary Incontinence Treatment Market Size Forecast by Country (2025-2032) & (M USD)
Table 141. Global Non-Surgical Urinary Incontinence Treatment Sales Forecast by Type (2025-2032) & (K Units)
Table 142. Global Non-Surgical Urinary Incontinence Treatment Market Size Forecast by Type (2025-2032) & (M USD)
Table 143. Global Non-Surgical Urinary Incontinence Treatment Price Forecast by Type (2025-2032) & (USD/Unit)
Table 144. Global Non-Surgical Urinary Incontinence Treatment Sales (K Units) Forecast by Application (2025-2032)
Table 145. Global Non-Surgical Urinary Incontinence Treatment Market Size Forecast by Application (2025-2032) & (M USD)
List of Figures
Figure 1. Product Picture of Non-Surgical Urinary Incontinence Treatment
Figure 2. Data Triangulation
Figure 3. Key Caveats
Figure 4. Global Non-Surgical Urinary Incontinence Treatment Market Size (M USD), 2019-2032
Figure 5. Global Non-Surgical Urinary Incontinence Treatment Market Size (M USD) (2019-2032)
Figure 6. Global Non-Surgical Urinary Incontinence Treatment Sales (K Units) & (2019-2032)
Figure 7. Evaluation Matrix of Segment Market Development Potential (Type)
Figure 8. Evaluation Matrix of Segment Market Development Potential (Application)
Figure 9. Evaluation Matrix of Regional Market Development Potential
Figure 10. Non-Surgical Urinary Incontinence Treatment Market Size by Country (M USD)
Figure 11. Non-Surgical Urinary Incontinence Treatment Sales Share by Manufacturers in 2023
Figure 12. Global Non-Surgical Urinary Incontinence Treatment Revenue Share by Manufacturers in 2023
Figure 13. Non-Surgical Urinary Incontinence Treatment Market Share by Company Type (Tier 1, Tier 2 and Tier 3): 2023
Figure 14. Global Market Non-Surgical Urinary Incontinence Treatment Average Price (USD/Unit) of Key Manufacturers in 2023
Figure 15. The Global 5 and 10 Largest Players: Market Share by Non-Surgical Urinary Incontinence Treatment Revenue in 2023
Figure 16. Evaluation Matrix of Segment Market Development Potential (Type)
Figure 17. Global Non-Surgical Urinary Incontinence Treatment Market Share by Type
Figure 18. Sales Market Share of Non-Surgical Urinary Incontinence Treatment by Type (2019-2025)
Figure 19. Sales Market Share of Non-Surgical Urinary Incontinence Treatment by Type in 2023
Figure 20. Market Size Share of Non-Surgical Urinary Incontinence Treatment by Type (2019-2025)
Figure 21. Market Size Market Share of Non-Surgical Urinary Incontinence Treatment by Type in 2023
Figure 22. Evaluation Matrix of Segment Market Development Potential (Application)
Figure 23. Global Non-Surgical Urinary Incontinence Treatment Market Share by Application
Figure 24. Global Non-Surgical Urinary Incontinence Treatment Sales Market Share by Application (2019-2025)
Figure 25. Global Non-Surgical Urinary Incontinence Treatment Sales Market Share by Application in 2023
Figure 26. Global Non-Surgical Urinary Incontinence Treatment Market Share by Application (2019-2025)
Figure 27. Global Non-Surgical Urinary Incontinence Treatment Market Share by Application in 2023
Figure 28. Global Non-Surgical Urinary Incontinence Treatment Sales Growth Rate by Application (2019-2025)
Figure 29. Global Non-Surgical Urinary Incontinence Treatment Sales Market Share by Region (2019-2025)
Figure 30. North America Non-Surgical Urinary Incontinence Treatment Sales and Growth Rate (2019-2025) & (K Units)
Figure 31. North America Non-Surgical Urinary Incontinence Treatment Sales Market Share by Country in 2023
Figure 32. U.S. Non-Surgical Urinary Incontinence Treatment Sales and Growth Rate (2019-2025) & (K Units)
Figure 33. Canada Non-Surgical Urinary Incontinence Treatment Sales (K Units) and Growth Rate (2019-2025)
Figure 34. Mexico Non-Surgical Urinary Incontinence Treatment Sales (Units) and Growth Rate (2019-2025)
Figure 35. Europe Non-Surgical Urinary Incontinence Treatment Sales and Growth Rate (2019-2025) & (K Units)
Figure 36. Europe Non-Surgical Urinary Incontinence Treatment Sales Market Share by Country in 2023
Figure 37. Germany Non-Surgical Urinary Incontinence Treatment Sales and Growth Rate (2019-2025) & (K Units)
Figure 38. France Non-Surgical Urinary Incontinence Treatment Sales and Growth Rate (2019-2025) & (K Units)
Figure 39. U.K. Non-Surgical Urinary Incontinence Treatment Sales and Growth Rate (2019-2025) & (K Units)
Figure 40. Italy Non-Surgical Urinary Incontinence Treatment Sales and Growth Rate (2019-2025) & (K Units)
Figure 41. Russia Non-Surgical Urinary Incontinence Treatment Sales and Growth Rate (2019-2025) & (K Units)
Figure 42. Asia Pacific Non-Surgical Urinary Incontinence Treatment Sales and Growth Rate (K Units)
Figure 43. Asia Pacific Non-Surgical Urinary Incontinence Treatment Sales Market Share by Region in 2023
Figure 44. China Non-Surgical Urinary Incontinence Treatment Sales and Growth Rate (2019-2025) & (K Units)
Figure 45. Japan Non-Surgical Urinary Incontinence Treatment Sales and Growth Rate (2019-2025) & (K Units)
Figure 46. South Korea Non-Surgical Urinary Incontinence Treatment Sales and Growth Rate (2019-2025) & (K Units)
Figure 47. India Non-Surgical Urinary Incontinence Treatment Sales and Growth Rate (2019-2025) & (K Units)
Figure 48. Southeast Asia Non-Surgical Urinary Incontinence Treatment Sales and Growth Rate (2019-2025) & (K Units)
Figure 49. South America Non-Surgical Urinary Incontinence Treatment Sales and Growth Rate (K Units)
Figure 50. South America Non-Surgical Urinary Incontinence Treatment Sales Market Share by Country in 2023
Figure 51. Brazil Non-Surgical Urinary Incontinence Treatment Sales and Growth Rate (2019-2025) & (K Units)
Figure 52. Argentina Non-Surgical Urinary Incontinence Treatment Sales and Growth Rate (2019-2025) & (K Units)
Figure 53. Columbia Non-Surgical Urinary Incontinence Treatment Sales and Growth Rate (2019-2025) & (K Units)
Figure 54. Middle East and Africa Non-Surgical Urinary Incontinence Treatment Sales and Growth Rate (K Units)
Figure 55. Middle East and Africa Non-Surgical Urinary Incontinence Treatment Sales Market Share by Region in 2023
Figure 56. Saudi Arabia Non-Surgical Urinary Incontinence Treatment Sales and Growth Rate (2019-2025) & (K Units)
Figure 57. UAE Non-Surgical Urinary Incontinence Treatment Sales and Growth Rate (2019-2025) & (K Units)
Figure 58. Egypt Non-Surgical Urinary Incontinence Treatment Sales and Growth Rate (2019-2025) & (K Units)
Figure 59. Nigeria Non-Surgical Urinary Incontinence Treatment Sales and Growth Rate (2019-2025) & (K Units)
Figure 60. South Africa Non-Surgical Urinary Incontinence Treatment Sales and Growth Rate (2019-2025) & (K Units)
Figure 61. Global Non-Surgical Urinary Incontinence Treatment Production Market Share by Region (2019-2025)
Figure 62. North America Non-Surgical Urinary Incontinence Treatment Production (K Units) Growth Rate (2019-2025)
Figure 63. Europe Non-Surgical Urinary Incontinence Treatment Production (K Units) Growth Rate (2019-2025)
Figure 64. Japan Non-Surgical Urinary Incontinence Treatment Production (K Units) Growth Rate (2019-2025)
Figure 65. China Non-Surgical Urinary Incontinence Treatment Production (K Units) Growth Rate (2019-2025)
Figure 66. Global Non-Surgical Urinary Incontinence Treatment Sales Forecast by Volume (2019-2032) & (K Units)
Figure 67. Global Non-Surgical Urinary Incontinence Treatment Market Size Forecast by Value (2019-2032) & (M USD)
Figure 68. Global Non-Surgical Urinary Incontinence Treatment Sales Market Share Forecast by Type (2025-2032)
Figure 69. Global Non-Surgical Urinary Incontinence Treatment Market Share Forecast by Type (2025-2032)
Figure 70. Global Non-Surgical Urinary Incontinence Treatment Sales Forecast by Application (2025-2032)
Figure 71. Global Non-Surgical Urinary Incontinence Treatment Market Share Forecast by Application (2025-2032)

