The On-Board Charging Converter Devices Market refers to the segment of the automotive industry that deals with AC/DC converters installed within electric vehicles (EVs) and hybrid electric vehicles (HEVs). These devices enable the conversion of AC power from external charging sources into DC power to charge vehicle batteries efficiently. On-board charging converters are crucial for ensuring safe and rapid energy transfer, facilitating improved vehicle range, and supporting the growing infrastructure of electric mobility. These devices are widely used in passenger cars, commercial vehicles, and construction machinery, driving innovation in power electronics and vehicle electrification.
Market Size
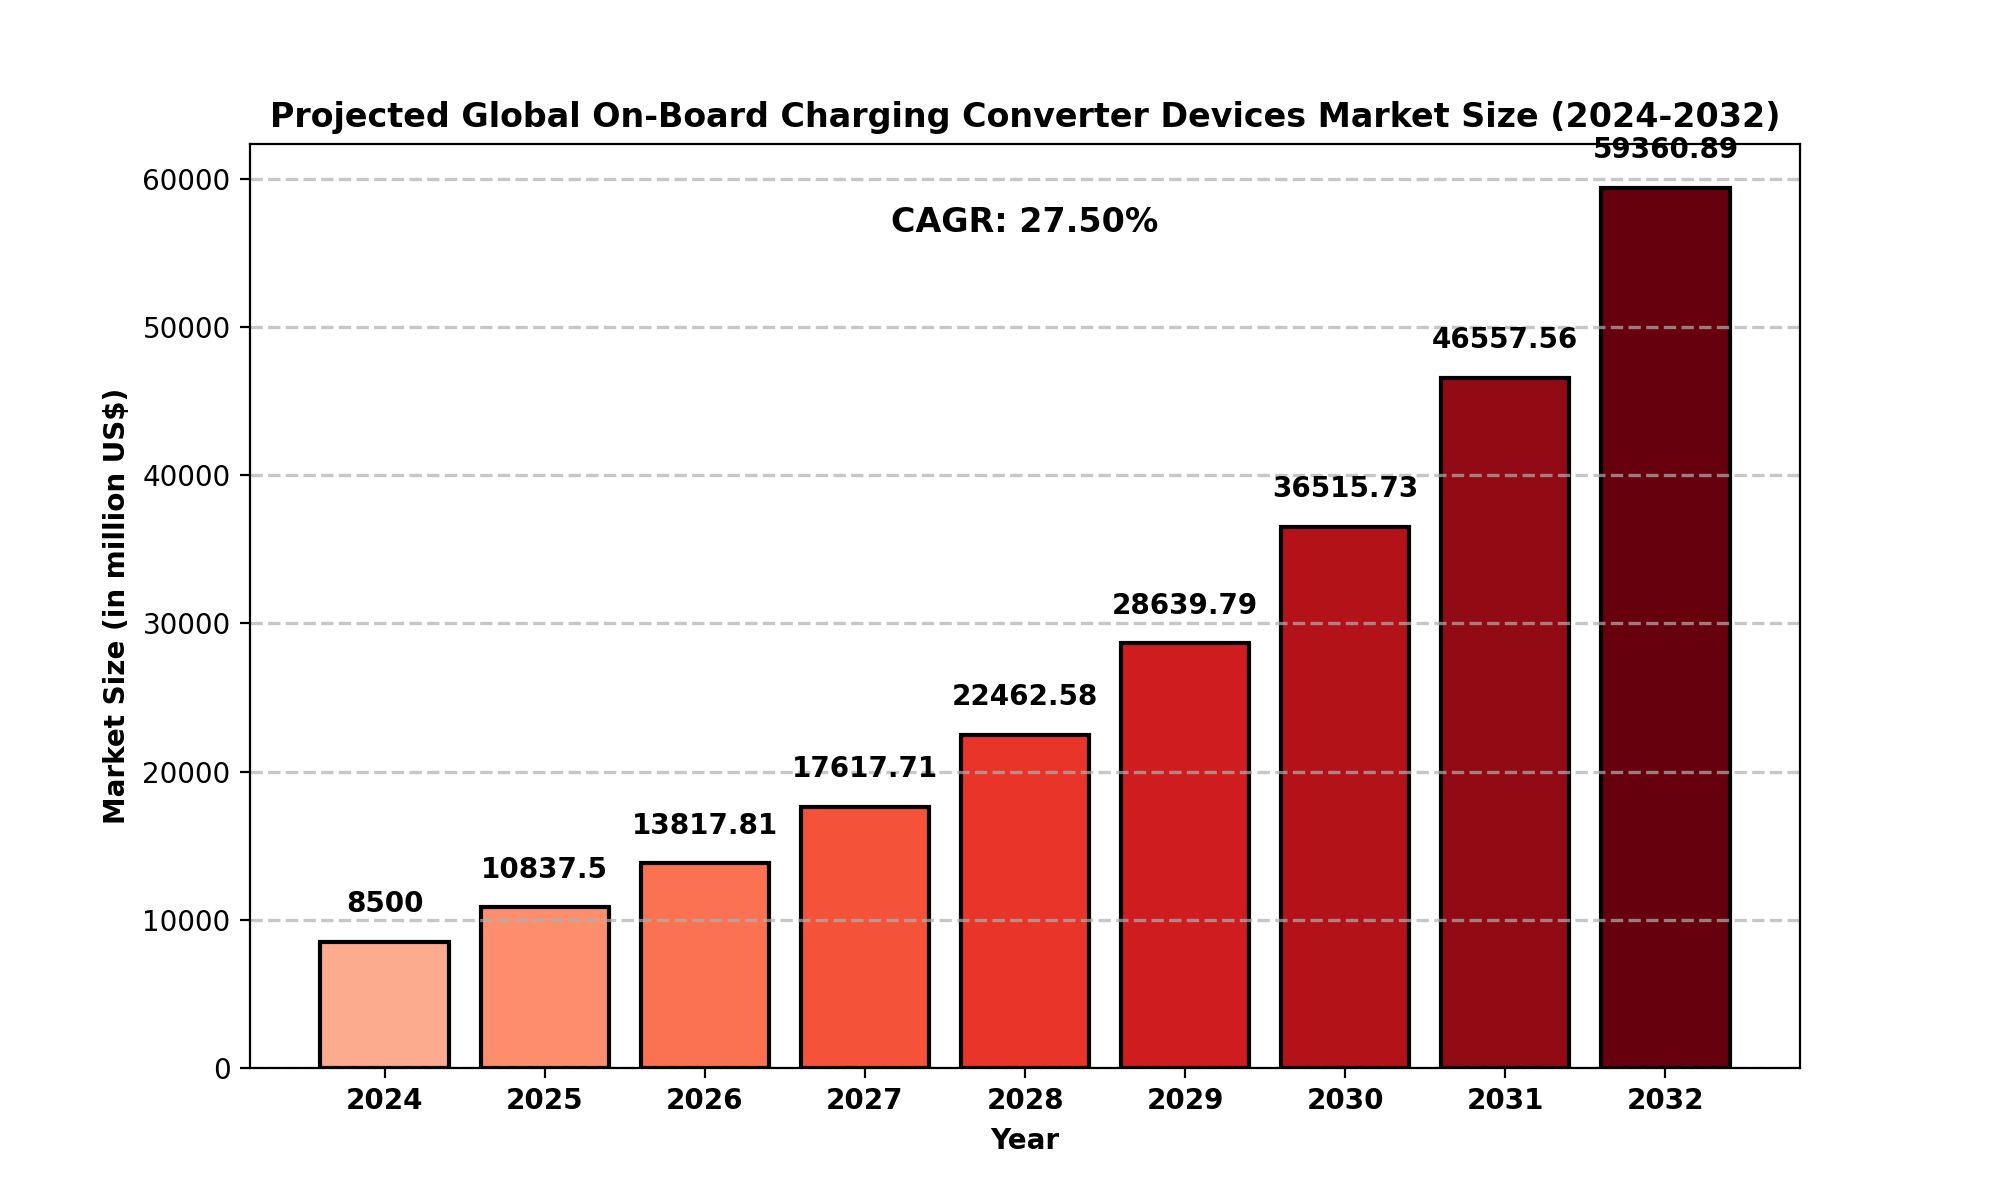
The global On-Board Charging Converter Devices Market was valued at USD 8,500 million in 2024 and is expected to grow at a CAGR of 27.50%, reaching USD 59,360.89 million by 2032.
-
North America accounted for USD 3,382.06 million in 2024, with a projected CAGR of 23.57% from 2025 to 2032.
-
The market's exponential growth is attributed to the increasing adoption of electric vehicles, rising environmental concerns, and government initiatives promoting EV infrastructure.
-
Historical data suggests a rapid shift from internal combustion engine (ICE) vehicles to electrified alternatives, boosting demand for on-board charging converters.
Market Dynamics
Drivers
-
Rising Adoption of Electric Vehicles (EVs): Global push towards sustainable transportation is propelling demand for efficient on-board charging solutions.
-
Government Incentives & Regulations: Subsidies, tax benefits, and stringent emissions regulations are fostering EV adoption.
-
Technological Advancements in Power Electronics: High-efficiency converters and smart charging solutions are being developed.
-
Infrastructure Expansion: Growth in EV charging stations is positively impacting market demand.
Restraints
-
High Initial Costs: EV charging technology is expensive, making adoption challenging in emerging economies.
-
Compatibility Issues: Different standards for AC/DC charging across regions may limit interoperability.
-
Limited Availability of Raw Materials: Dependence on semiconductors and rare-earth metals could impact production.
Opportunities
-
Integration of Wireless Charging: Innovations in inductive charging present new growth avenues.
-
Growing Fleet Electrification: Commercial and logistics fleets shifting to EVs will expand market potential.
-
Expansion in Emerging Markets: Developing nations are increasingly investing in EV technology and infrastructure.
Challenges
-
Grid Load Management: Increased EV adoption requires substantial power grid enhancements.
-
Cybersecurity Concerns: With growing connectivity in EVs, security vulnerabilities in on-board chargers need addressing.
Regional Analysis
North America
Europe
-
Germany, France, and the UK dominate the region’s market, backed by stringent emissions regulations and aggressive EV expansion plans.
-
High EV penetration and charging infrastructure investments fuel market growth.
Asia-Pacific
-
China leads global EV sales, making it the largest market for on-board charging converters.
-
Japan, South Korea, and India are investing heavily in EV technology and charging networks.
South America & Middle East-Africa
Competitor Analysis
Key Companies
-
Infineon – Leading semiconductor manufacturer, offering advanced power electronics.
-
Delta Electronics – Specializes in high-efficiency power conversion solutions.
-
TDK Corporation – Develops electronic components crucial for charging technologies.
-
Delphi – Innovates in automotive electrification and power management.
-
Continental – Supplies integrated EV powertrain solutions.
-
XP Power – Focuses on high-performance power supplies for electric mobility.
-
Toyota Industries, Denso, Hitachi Automotive Systems, Mobis, Keboda – Major players advancing on-board charging solutions.
Market Segmentation (by Type)
Market Segmentation (by Application)
-
Car – Passenger EVs, the largest segment in the market.
-
Truck – Electrification of heavy-duty vehicles is gaining traction.
-
Commercial Vehicles – Logistics and public transport adopting EV fleets.
-
Others – Specialty vehicles, construction, and industrial electric machinery.
Geographic Segmentation
-
North America: USA, Canada, Mexico
-
Europe: Germany, UK, France, Russia, Italy, Rest of Europe
-
Asia-Pacific: China, Japan, South Korea, India, Southeast Asia, Rest of Asia-Pacific
-
South America: Brazil, Argentina, Colombia, Rest of South America
-
Middle East & Africa: Saudi Arabia, UAE, Egypt, Nigeria, South Africa, Rest of MEA
FAQ Section
What is the current market size of the On-Board Charging Converter Devices market?
-
The market was valued at USD 8,500 million in 2024 and is projected to grow to USD 75,685.13 million by 2032, with a CAGR of 27.50%.
Which are the key companies operating in the On-Board Charging Converter Devices market?
-
Major players include Infineon, Delta Electronics, TDK Corporation, Delphi, Continental, XP Power, Toyota Industries, Denso, Hitachi Automotive Systems, Mobis, and Keboda.
What are the key growth drivers in the On-Board Charging Converter Devices market?
-
Key drivers include rising EV adoption, government incentives, technological advancements in power electronics, and expanding EV charging infrastructure.
Which regions dominate the On-Board Charging Converter Devices market?
-
Asia-Pacific (China, Japan, South Korea), North America (USA, Canada), and Europe (Germany, UK, France) lead the market.
What are the emerging trends in the On-Board Charging Converter Devices market?
-
Emerging trends include wireless charging, vehicle-to-grid (V2G) integration, fast-charging technologies, and AI-driven power management.
-
This report serves as an essential guide for industry players, investors, researchers, consultants, and business strategists looking to navigate the evolving On-Board Charging Converter Devices Market.
Key Benefits of This Market Research:
-
Industry drivers, restraints, and opportunities covered in the study
-
Neutral perspective on the market performance
-
Recent industry trends and developments
-
Competitive landscape & strategies of key players
-
Potential & niche segments and regions exhibiting promising growth covered
-
Historical, current, and projected market size, in terms of value
-
In-depth analysis of the On-Board Charging Converter Devices Market
-
Overview of the regional outlook of the On-Board Charging Converter Devices Market:
Key Reasons to Buy this Report:
-
Access to date statistics compiled by our researchers. These provide you with historical and forecast data, which is analyzed to tell you why your market is set to change
-
This enables you to anticipate market changes to remain ahead of your competitors
-
You will be able to copy data from the Excel spreadsheet straight into your marketing plans, business presentations, or other strategic documents
-
The concise analysis, clear graph, and table format will enable you to pinpoint the information you require quickly
-
Provision of market value data for each segment and sub-segment
-
Indicates the region and segment that is expected to witness the fastest growth as well as to dominate the market
-
Analysis by geography highlighting the consumption of the product/service in the region as well as indicating the factors that are affecting the market within each region
-
Competitive landscape which incorporates the market ranking of the major players, along with new service/product launches, partnerships, business expansions, and acquisitions in the past five years of companies profiled
-
Extensive company profiles comprising of company overview, company insights, product benchmarking, and SWOT analysis for the major market players
-
The current as well as the future market outlook of the industry concerning recent developments which involve growth opportunities and drivers as well as challenges and restraints of both emerging as well as developed regions
-
Includes in-depth analysis of the market from various perspectives through Porter
TABLE OF CONTENTS
Table of Contents
1 Research Methodology and Statistical Scope
1.1 Market Definition and Statistical Scope of On-Board Charging Converter Devices
1.2 Key Market Segments
1.2.1 On-Board Charging Converter Devices Segment by Type
1.2.2 On-Board Charging Converter Devices Segment by Application
1.3 Methodology & Sources of Information
1.3.1 Research Methodology
1.3.2 Research Process
1.3.3 Market Breakdown and Data Triangulation
1.3.4 Base Year
1.3.5 Report Assumptions & Caveats
1.4 Key Data of Global Auto Market
1.4.1 Global Automobile Production by Country
1.4.2 Global Automobile Production by Type
2 On-Board Charging Converter Devices Market Overview
2.1 Global Market Overview
2.1.1 Global On-Board Charging Converter Devices Market Size (M USD) Estimates and Forecasts (2019-2032)
2.1.2 Global On-Board Charging Converter Devices Sales Estimates and Forecasts (2019-2032)
2.2 Market Segment Executive Summary
2.3 Global Market Size by Region
3 On-Board Charging Converter Devices Market Competitive Landscape
3.1 Global On-Board Charging Converter Devices Sales by Manufacturers (2019-2025)
3.2 Global On-Board Charging Converter Devices Revenue Market Share by Manufacturers (2019-2025)
3.3 On-Board Charging Converter Devices Market Share by Company Type (Tier 1, Tier 2, and Tier 3)
3.4 Global On-Board Charging Converter Devices Average Price by Manufacturers (2019-2025)
3.5 Manufacturers On-Board Charging Converter Devices Sales Sites, Area Served, Product Type
3.6 On-Board Charging Converter Devices Market Competitive Situation and Trends
3.6.1 On-Board Charging Converter Devices Market Concentration Rate
3.6.2 Global 5 and 10 Largest On-Board Charging Converter Devices Players Market Share by Revenue
3.6.3 Mergers & Acquisitions, Expansion
4 On-Board Charging Converter Devices Industry Chain Analysis
4.1 On-Board Charging Converter Devices Industry Chain Analysis
4.2 Market Overview of Key Raw Materials
4.3 Midstream Market Analysis
4.4 Downstream Customer Analysis
5 The Development and Dynamics of On-Board Charging Converter Devices Market
5.1 Key Development Trends
5.2 Driving Factors
5.3 Market Challenges
5.4 Market Restraints
5.5 Industry News
5.5.1 New Product Developments
5.5.2 Mergers & Acquisitions
5.5.3 Expansions
5.5.4 Collaboration/Supply Contracts
5.6 Industry Policies
6 On-Board Charging Converter Devices Market Segmentation by Type
6.1 Evaluation Matrix of Segment Market Development Potential (Type)
6.2 Global On-Board Charging Converter Devices Sales Market Share by Type (2019-2025)
6.3 Global On-Board Charging Converter Devices Market Size Market Share by Type (2019-2025)
6.4 Global On-Board Charging Converter Devices Price by Type (2019-2025)
7 On-Board Charging Converter Devices Market Segmentation by Application
7.1 Evaluation Matrix of Segment Market Development Potential (Application)
7.2 Global On-Board Charging Converter Devices Market Sales by Application (2019-2025)
7.3 Global On-Board Charging Converter Devices Market Size (M USD) by Application (2019-2025)
7.4 Global On-Board Charging Converter Devices Sales Growth Rate by Application (2019-2025)
8 On-Board Charging Converter Devices Market Consumption by Region
8.1 Global On-Board Charging Converter Devices Sales by Region
8.1.1 Global On-Board Charging Converter Devices Sales by Region
8.1.2 Global On-Board Charging Converter Devices Sales Market Share by Region
8.2 North America
8.2.1 North America On-Board Charging Converter Devices Sales by Country
8.2.2 U.S.
8.2.3 Canada
8.2.4 Mexico
8.3 Europe
8.3.1 Europe On-Board Charging Converter Devices Sales by Country
8.3.2 Germany
8.3.3 France
8.3.4 U.K.
8.3.5 Italy
8.3.6 Russia
8.4 Asia Pacific
8.4.1 Asia Pacific On-Board Charging Converter Devices Sales by Region
8.4.2 China
8.4.3 Japan
8.4.4 South Korea
8.4.5 India
8.4.6 Southeast Asia
8.5 South America
8.5.1 South America On-Board Charging Converter Devices Sales by Country
8.5.2 Brazil
8.5.3 Argentina
8.5.4 Columbia
8.6 Middle East and Africa
8.6.1 Middle East and Africa On-Board Charging Converter Devices Sales by Region
8.6.2 Saudi Arabia
8.6.3 UAE
8.6.4 Egypt
8.6.5 Nigeria
8.6.6 South Africa
9 On-Board Charging Converter Devices Market Production by Region
9.1 Global Production of On-Board Charging Converter Devices by Region (2019-2025)
9.2 Global On-Board Charging Converter Devices Revenue Market Share by Region (2019-2025)
9.3 Global On-Board Charging Converter Devices Production, Revenue, Price and Gross Margin (2019-2025)
9.4 North America On-Board Charging Converter Devices Production
9.4.1 North America On-Board Charging Converter Devices Production Growth Rate (2019-2025)
9.4.2 North America On-Board Charging Converter Devices Production, Revenue, Price and Gross Margin (2019-2025)
9.5 Europe On-Board Charging Converter Devices Production
9.5.1 Europe On-Board Charging Converter Devices Production Growth Rate (2019-2025)
9.5.2 Europe On-Board Charging Converter Devices Production, Revenue, Price and Gross Margin (2019-2025)
9.6 Japan On-Board Charging Converter Devices Production (2019-2025)
9.6.1 Japan On-Board Charging Converter Devices Production Growth Rate (2019-2025)
9.6.2 Japan On-Board Charging Converter Devices Production, Revenue, Price and Gross Margin (2019-2025)
9.7 China On-Board Charging Converter Devices Production (2019-2025)
9.7.1 China On-Board Charging Converter Devices Production Growth Rate (2019-2025)
9.7.2 China On-Board Charging Converter Devices Production, Revenue, Price and Gross Margin (2019-2025)
10 Key Companies Profile
10.1 Infineon
10.1.1 Infineon On-Board Charging Converter Devices Basic Information
10.1.2 Infineon On-Board Charging Converter Devices Product Overview
10.1.3 Infineon On-Board Charging Converter Devices Product Market Performance
10.1.4 Infineon Business Overview
10.1.5 Infineon On-Board Charging Converter Devices SWOT Analysis
10.1.6 Infineon Recent Developments
10.2 Delta Electronics
10.2.1 Delta Electronics On-Board Charging Converter Devices Basic Information
10.2.2 Delta Electronics On-Board Charging Converter Devices Product Overview
10.2.3 Delta Electronics On-Board Charging Converter Devices Product Market Performance
10.2.4 Delta Electronics Business Overview
10.2.5 Delta Electronics On-Board Charging Converter Devices SWOT Analysis
10.2.6 Delta Electronics Recent Developments
10.3 TDK Corporation
10.3.1 TDK Corporation On-Board Charging Converter Devices Basic Information
10.3.2 TDK Corporation On-Board Charging Converter Devices Product Overview
10.3.3 TDK Corporation On-Board Charging Converter Devices Product Market Performance
10.3.4 TDK Corporation On-Board Charging Converter Devices SWOT Analysis
10.3.5 TDK Corporation Business Overview
10.3.6 TDK Corporation Recent Developments
10.4 Delphi
10.4.1 Delphi On-Board Charging Converter Devices Basic Information
10.4.2 Delphi On-Board Charging Converter Devices Product Overview
10.4.3 Delphi On-Board Charging Converter Devices Product Market Performance
10.4.4 Delphi Business Overview
10.4.5 Delphi Recent Developments
10.5 Continental
10.5.1 Continental On-Board Charging Converter Devices Basic Information
10.5.2 Continental On-Board Charging Converter Devices Product Overview
10.5.3 Continental On-Board Charging Converter Devices Product Market Performance
10.5.4 Continental Business Overview
10.5.5 Continental Recent Developments
10.6 XP Power
10.6.1 XP Power On-Board Charging Converter Devices Basic Information
10.6.2 XP Power On-Board Charging Converter Devices Product Overview
10.6.3 XP Power On-Board Charging Converter Devices Product Market Performance
10.6.4 XP Power Business Overview
10.6.5 XP Power Recent Developments
10.7 Toyota Industries
10.7.1 Toyota Industries On-Board Charging Converter Devices Basic Information
10.7.2 Toyota Industries On-Board Charging Converter Devices Product Overview
10.7.3 Toyota Industries On-Board Charging Converter Devices Product Market Performance
10.7.4 Toyota Industries Business Overview
10.7.5 Toyota Industries Recent Developments
10.8 Denso
10.8.1 Denso On-Board Charging Converter Devices Basic Information
10.8.2 Denso On-Board Charging Converter Devices Product Overview
10.8.3 Denso On-Board Charging Converter Devices Product Market Performance
10.8.4 Denso Business Overview
10.8.5 Denso Recent Developments
10.9 Hitachi Automotive Systems
10.9.1 Hitachi Automotive Systems On-Board Charging Converter Devices Basic Information
10.9.2 Hitachi Automotive Systems On-Board Charging Converter Devices Product Overview
10.9.3 Hitachi Automotive Systems On-Board Charging Converter Devices Product Market Performance
10.9.4 Hitachi Automotive Systems Business Overview
10.9.5 Hitachi Automotive Systems Recent Developments
10.10 Mobis
10.10.1 Mobis On-Board Charging Converter Devices Basic Information
10.10.2 Mobis On-Board Charging Converter Devices Product Overview
10.10.3 Mobis On-Board Charging Converter Devices Product Market Performance
10.10.4 Mobis Business Overview
10.10.5 Mobis Recent Developments
10.11 Keboda
10.11.1 Keboda On-Board Charging Converter Devices Basic Information
10.11.2 Keboda On-Board Charging Converter Devices Product Overview
10.11.3 Keboda On-Board Charging Converter Devices Product Market Performance
10.11.4 Keboda Business Overview
10.11.5 Keboda Recent Developments
11 On-Board Charging Converter Devices Market Forecast by Region
11.1 Global On-Board Charging Converter Devices Market Size Forecast
11.2 Global On-Board Charging Converter Devices Market Forecast by Region
11.2.1 North America Market Size Forecast by Country
11.2.2 Europe On-Board Charging Converter Devices Market Size Forecast by Country
11.2.3 Asia Pacific On-Board Charging Converter Devices Market Size Forecast by Region
11.2.4 South America On-Board Charging Converter Devices Market Size Forecast by Country
11.2.5 Middle East and Africa Forecasted Consumption of On-Board Charging Converter Devices by Country
12 Forecast Market by Type and by Application (2025-2032)
12.1 Global On-Board Charging Converter Devices Market Forecast by Type (2025-2032)
12.1.1 Global Forecasted Sales of On-Board Charging Converter Devices by Type (2025-2032)
12.1.2 Global On-Board Charging Converter Devices Market Size Forecast by Type (2025-2032)
12.1.3 Global Forecasted Price of On-Board Charging Converter Devices by Type (2025-2032)
12.2 Global On-Board Charging Converter Devices Market Forecast by Application (2025-2032)
12.2.1 Global On-Board Charging Converter Devices Sales (K Units) Forecast by Application
12.2.2 Global On-Board Charging Converter Devices Market Size (M USD) Forecast by Application (2025-2032)
13 Conclusion and Key Findings
LIST OF TABLES & FIGURES
List of Tables
Table 1. Introduction of the Type
Table 2. Introduction of the Application
Table 3. Motor Vehicle Production Market Share by Type (2023)
Table 4. Global Automobile Production by Region (Units)
Table 5. Market Share and Development Potential of Automobiles by Region
Table 6. Global Automobile Production by Country (Vehicle)
Table 7. Market Share and Development Potential of Automobiles by Countries
Table 8. Global Automobile Production by Type
Table 9. Market Share and Development Potential of Automobiles by Type
Table 10. Market Size (M USD) Segment Executive Summary
Table 11. On-Board Charging Converter Devices Market Size Comparison by Region (M USD)
Table 12. Global On-Board Charging Converter Devices Sales (K Units) by Manufacturers (2019-2025)
Table 13. Global On-Board Charging Converter Devices Sales Market Share by Manufacturers (2019-2025)
Table 14. Global On-Board Charging Converter Devices Revenue (M USD) by Manufacturers (2019-2025)
Table 15. Global On-Board Charging Converter Devices Revenue Share by Manufacturers (2019-2025)
Table 16. Company Type (Tier 1, Tier 2, and Tier 3) & (based on the Revenue in On-Board Charging Converter Devices as of 2022)
Table 17. Global Market On-Board Charging Converter Devices Average Price (USD/Unit) of Key Manufacturers (2019-2025)
Table 18. Manufacturers On-Board Charging Converter Devices Sales Sites and Area Served
Table 19. Manufacturers On-Board Charging Converter Devices Product Type
Table 20. Global On-Board Charging Converter Devices Manufacturers Market Concentration Ratio (CR5 and HHI)
Table 21. Mergers & Acquisitions, Expansion Plans
Table 22. Industry Chain Map of On-Board Charging Converter Devices
Table 23. Market Overview of Key Raw Materials
Table 24. Midstream Market Analysis
Table 25. Downstream Customer Analysis
Table 26. Key Development Trends
Table 27. Driving Factors
Table 28. On-Board Charging Converter Devices Market Challenges
Table 29. Global On-Board Charging Converter Devices Sales by Type (K Units)
Table 30. Global On-Board Charging Converter Devices Market Size by Type (M USD)
Table 31. Global On-Board Charging Converter Devices Sales (K Units) by Type (2019-2025)
Table 32. Global On-Board Charging Converter Devices Sales Market Share by Type (2019-2025)
Table 33. Global On-Board Charging Converter Devices Market Size (M USD) by Type (2019-2025)
Table 34. Global On-Board Charging Converter Devices Market Size Share by Type (2019-2025)
Table 35. Global On-Board Charging Converter Devices Price (USD/Unit) by Type (2019-2025)
Table 36. Global On-Board Charging Converter Devices Sales (K Units) by Application
Table 37. Global On-Board Charging Converter Devices Market Size by Application
Table 38. Global On-Board Charging Converter Devices Sales by Application (2019-2025) & (K Units)
Table 39. Global On-Board Charging Converter Devices Sales Market Share by Application (2019-2025)
Table 40. Global On-Board Charging Converter Devices Sales by Application (2019-2025) & (M USD)
Table 41. Global On-Board Charging Converter Devices Market Share by Application (2019-2025)
Table 42. Global On-Board Charging Converter Devices Sales Growth Rate by Application (2019-2025)
Table 43. Global On-Board Charging Converter Devices Sales by Region (2019-2025) & (K Units)
Table 44. Global On-Board Charging Converter Devices Sales Market Share by Region (2019-2025)
Table 45. North America On-Board Charging Converter Devices Sales by Country (2019-2025) & (K Units)
Table 46. Europe On-Board Charging Converter Devices Sales by Country (2019-2025) & (K Units)
Table 47. Asia Pacific On-Board Charging Converter Devices Sales by Region (2019-2025) & (K Units)
Table 48. South America On-Board Charging Converter Devices Sales by Country (2019-2025) & (K Units)
Table 49. Middle East and Africa On-Board Charging Converter Devices Sales by Region (2019-2025) & (K Units)
Table 50. Global On-Board Charging Converter Devices Production (K Units) by Region (2019-2025)
Table 51. Global On-Board Charging Converter Devices Revenue (US$ Million) by Region (2019-2025)
Table 52. Global On-Board Charging Converter Devices Revenue Market Share by Region (2019-2025)
Table 53. Global On-Board Charging Converter Devices Production (K Units), Revenue (US$ Million), Price (USD/Unit) and Gross Margin (2019-2025)
Table 54. North America On-Board Charging Converter Devices Production (K Units), Revenue (US$ Million), Price (USD/Unit) and Gross Margin (2019-2025)
Table 55. Europe On-Board Charging Converter Devices Production (K Units), Revenue (US$ Million), Price (USD/Unit) and Gross Margin (2019-2025)
Table 56. Japan On-Board Charging Converter Devices Production (K Units), Revenue (US$ Million), Price (USD/Unit) and Gross Margin (2019-2025)
Table 57. China On-Board Charging Converter Devices Production (K Units), Revenue (US$ Million), Price (USD/Unit) and Gross Margin (2019-2025)
Table 58. Infineon On-Board Charging Converter Devices Basic Information
Table 59. Infineon On-Board Charging Converter Devices Product Overview
Table 60. Infineon On-Board Charging Converter Devices Sales (K Units), Revenue (M USD), Price (USD/Unit) and Gross Margin (2019-2025)
Table 61. Infineon Business Overview
Table 62. Infineon On-Board Charging Converter Devices SWOT Analysis
Table 63. Infineon Recent Developments
Table 64. Delta Electronics On-Board Charging Converter Devices Basic Information
Table 65. Delta Electronics On-Board Charging Converter Devices Product Overview
Table 66. Delta Electronics On-Board Charging Converter Devices Sales (K Units), Revenue (M USD), Price (USD/Unit) and Gross Margin (2019-2025)
Table 67. Delta Electronics Business Overview
Table 68. Delta Electronics On-Board Charging Converter Devices SWOT Analysis
Table 69. Delta Electronics Recent Developments
Table 70. TDK Corporation On-Board Charging Converter Devices Basic Information
Table 71. TDK Corporation On-Board Charging Converter Devices Product Overview
Table 72. TDK Corporation On-Board Charging Converter Devices Sales (K Units), Revenue (M USD), Price (USD/Unit) and Gross Margin (2019-2025)
Table 73. TDK Corporation On-Board Charging Converter Devices SWOT Analysis
Table 74. TDK Corporation Business Overview
Table 75. TDK Corporation Recent Developments
Table 76. Delphi On-Board Charging Converter Devices Basic Information
Table 77. Delphi On-Board Charging Converter Devices Product Overview
Table 78. Delphi On-Board Charging Converter Devices Sales (K Units), Revenue (M USD), Price (USD/Unit) and Gross Margin (2019-2025)
Table 79. Delphi Business Overview
Table 80. Delphi Recent Developments
Table 81. Continental On-Board Charging Converter Devices Basic Information
Table 82. Continental On-Board Charging Converter Devices Product Overview
Table 83. Continental On-Board Charging Converter Devices Sales (K Units), Revenue (M USD), Price (USD/Unit) and Gross Margin (2019-2025)
Table 84. Continental Business Overview
Table 85. Continental Recent Developments
Table 86. XP Power On-Board Charging Converter Devices Basic Information
Table 87. XP Power On-Board Charging Converter Devices Product Overview
Table 88. XP Power On-Board Charging Converter Devices Sales (K Units), Revenue (M USD), Price (USD/Unit) and Gross Margin (2019-2025)
Table 89. XP Power Business Overview
Table 90. XP Power Recent Developments
Table 91. Toyota Industries On-Board Charging Converter Devices Basic Information
Table 92. Toyota Industries On-Board Charging Converter Devices Product Overview
Table 93. Toyota Industries On-Board Charging Converter Devices Sales (K Units), Revenue (M USD), Price (USD/Unit) and Gross Margin (2019-2025)
Table 94. Toyota Industries Business Overview
Table 95. Toyota Industries Recent Developments
Table 96. Denso On-Board Charging Converter Devices Basic Information
Table 97. Denso On-Board Charging Converter Devices Product Overview
Table 98. Denso On-Board Charging Converter Devices Sales (K Units), Revenue (M USD), Price (USD/Unit) and Gross Margin (2019-2025)
Table 99. Denso Business Overview
Table 100. Denso Recent Developments
Table 101. Hitachi Automotive Systems On-Board Charging Converter Devices Basic Information
Table 102. Hitachi Automotive Systems On-Board Charging Converter Devices Product Overview
Table 103. Hitachi Automotive Systems On-Board Charging Converter Devices Sales (K Units), Revenue (M USD), Price (USD/Unit) and Gross Margin (2019-2025)
Table 104. Hitachi Automotive Systems Business Overview
Table 105. Hitachi Automotive Systems Recent Developments
Table 106. Mobis On-Board Charging Converter Devices Basic Information
Table 107. Mobis On-Board Charging Converter Devices Product Overview
Table 108. Mobis On-Board Charging Converter Devices Sales (K Units), Revenue (M USD), Price (USD/Unit) and Gross Margin (2019-2025)
Table 109. Mobis Business Overview
Table 110. Mobis Recent Developments
Table 111. Keboda On-Board Charging Converter Devices Basic Information
Table 112. Keboda On-Board Charging Converter Devices Product Overview
Table 113. Keboda On-Board Charging Converter Devices Sales (K Units), Revenue (M USD), Price (USD/Unit) and Gross Margin (2019-2025)
Table 114. Keboda Business Overview
Table 115. Keboda Recent Developments
Table 116. Global On-Board Charging Converter Devices Sales Forecast by Region (2025-2032) & (K Units)
Table 117. Global On-Board Charging Converter Devices Market Size Forecast by Region (2025-2032) & (M USD)
Table 118. North America On-Board Charging Converter Devices Sales Forecast by Country (2025-2032) & (K Units)
Table 119. North America On-Board Charging Converter Devices Market Size Forecast by Country (2025-2032) & (M USD)
Table 120. Europe On-Board Charging Converter Devices Sales Forecast by Country (2025-2032) & (K Units)
Table 121. Europe On-Board Charging Converter Devices Market Size Forecast by Country (2025-2032) & (M USD)
Table 122. Asia Pacific On-Board Charging Converter Devices Sales Forecast by Region (2025-2032) & (K Units)
Table 123. Asia Pacific On-Board Charging Converter Devices Market Size Forecast by Region (2025-2032) & (M USD)
Table 124. South America On-Board Charging Converter Devices Sales Forecast by Country (2025-2032) & (K Units)
Table 125. South America On-Board Charging Converter Devices Market Size Forecast by Country (2025-2032) & (M USD)
Table 126. Middle East and Africa On-Board Charging Converter Devices Consumption Forecast by Country (2025-2032) & (Units)
Table 127. Middle East and Africa On-Board Charging Converter Devices Market Size Forecast by Country (2025-2032) & (M USD)
Table 128. Global On-Board Charging Converter Devices Sales Forecast by Type (2025-2032) & (K Units)
Table 129. Global On-Board Charging Converter Devices Market Size Forecast by Type (2025-2032) & (M USD)
Table 130. Global On-Board Charging Converter Devices Price Forecast by Type (2025-2032) & (USD/Unit)
Table 131. Global On-Board Charging Converter Devices Sales (K Units) Forecast by Application (2025-2032)
Table 132. Global On-Board Charging Converter Devices Market Size Forecast by Application (2025-2032) & (M USD)
List of Figures
Figure 1. Product Picture of On-Board Charging Converter Devices
Figure 2. Data Triangulation
Figure 3. Key Caveats
Figure 4. Global Motor Vehicle Production (M Units)
Figure 5. Global On-Board Charging Converter Devices Market Size (M USD), 2019-2032
Figure 6. Global On-Board Charging Converter Devices Market Size (M USD) (2019-2032)
Figure 7. Global On-Board Charging Converter Devices Sales (K Units) & (2019-2032)
Figure 8. Evaluation Matrix of Segment Market Development Potential (Type)
Figure 9. Evaluation Matrix of Segment Market Development Potential (Application)
Figure 10. Evaluation Matrix of Regional Market Development Potential
Figure 11. On-Board Charging Converter Devices Market Size by Country (M USD)
Figure 12. On-Board Charging Converter Devices Sales Share by Manufacturers in 2023
Figure 13. Global On-Board Charging Converter Devices Revenue Share by Manufacturers in 2023
Figure 14. On-Board Charging Converter Devices Market Share by Company Type (Tier 1, Tier 2 and Tier 3): 2023
Figure 15. Global Market On-Board Charging Converter Devices Average Price (USD/Unit) of Key Manufacturers in 2023
Figure 16. The Global 5 and 10 Largest Players: Market Share by On-Board Charging Converter Devices Revenue in 2023
Figure 17. Evaluation Matrix of Segment Market Development Potential (Type)
Figure 18. Global On-Board Charging Converter Devices Market Share by Type
Figure 19. Sales Market Share of On-Board Charging Converter Devices by Type (2019-2025)
Figure 20. Sales Market Share of On-Board Charging Converter Devices by Type in 2023
Figure 21. Market Size Share of On-Board Charging Converter Devices by Type (2019-2025)
Figure 22. Market Size Market Share of On-Board Charging Converter Devices by Type in 2023
Figure 23. Evaluation Matrix of Segment Market Development Potential (Application)
Figure 24. Global On-Board Charging Converter Devices Market Share by Application
Figure 25. Global On-Board Charging Converter Devices Sales Market Share by Application (2019-2025)
Figure 26. Global On-Board Charging Converter Devices Sales Market Share by Application in 2023
Figure 27. Global On-Board Charging Converter Devices Market Share by Application (2019-2025)
Figure 28. Global On-Board Charging Converter Devices Market Share by Application in 2023
Figure 29. Global On-Board Charging Converter Devices Sales Growth Rate by Application (2019-2025)
Figure 30. Global On-Board Charging Converter Devices Sales Market Share by Region (2019-2025)
Figure 31. North America On-Board Charging Converter Devices Sales and Growth Rate (2019-2025) & (K Units)
Figure 32. North America On-Board Charging Converter Devices Sales Market Share by Country in 2023
Figure 33. U.S. On-Board Charging Converter Devices Sales and Growth Rate (2019-2025) & (K Units)
Figure 34. Canada On-Board Charging Converter Devices Sales (K Units) and Growth Rate (2019-2025)
Figure 35. Mexico On-Board Charging Converter Devices Sales (Units) and Growth Rate (2019-2025)
Figure 36. Europe On-Board Charging Converter Devices Sales and Growth Rate (2019-2025) & (K Units)
Figure 37. Europe On-Board Charging Converter Devices Sales Market Share by Country in 2023
Figure 38. Germany On-Board Charging Converter Devices Sales and Growth Rate (2019-2025) & (K Units)
Figure 39. France On-Board Charging Converter Devices Sales and Growth Rate (2019-2025) & (K Units)
Figure 40. U.K. On-Board Charging Converter Devices Sales and Growth Rate (2019-2025) & (K Units)
Figure 41. Italy On-Board Charging Converter Devices Sales and Growth Rate (2019-2025) & (K Units)
Figure 42. Russia On-Board Charging Converter Devices Sales and Growth Rate (2019-2025) & (K Units)
Figure 43. Asia Pacific On-Board Charging Converter Devices Sales and Growth Rate (K Units)
Figure 44. Asia Pacific On-Board Charging Converter Devices Sales Market Share by Region in 2023
Figure 45. China On-Board Charging Converter Devices Sales and Growth Rate (2019-2025) & (K Units)
Figure 46. Japan On-Board Charging Converter Devices Sales and Growth Rate (2019-2025) & (K Units)
Figure 47. South Korea On-Board Charging Converter Devices Sales and Growth Rate (2019-2025) & (K Units)
Figure 48. India On-Board Charging Converter Devices Sales and Growth Rate (2019-2025) & (K Units)
Figure 49. Southeast Asia On-Board Charging Converter Devices Sales and Growth Rate (2019-2025) & (K Units)
Figure 50. South America On-Board Charging Converter Devices Sales and Growth Rate (K Units)
Figure 51. South America On-Board Charging Converter Devices Sales Market Share by Country in 2023
Figure 52. Brazil On-Board Charging Converter Devices Sales and Growth Rate (2019-2025) & (K Units)
Figure 53. Argentina On-Board Charging Converter Devices Sales and Growth Rate (2019-2025) & (K Units)
Figure 54. Columbia On-Board Charging Converter Devices Sales and Growth Rate (2019-2025) & (K Units)
Figure 55. Middle East and Africa On-Board Charging Converter Devices Sales and Growth Rate (K Units)
Figure 56. Middle East and Africa On-Board Charging Converter Devices Sales Market Share by Region in 2023
Figure 57. Saudi Arabia On-Board Charging Converter Devices Sales and Growth Rate (2019-2025) & (K Units)
Figure 58. UAE On-Board Charging Converter Devices Sales and Growth Rate (2019-2025) & (K Units)
Figure 59. Egypt On-Board Charging Converter Devices Sales and Growth Rate (2019-2025) & (K Units)
Figure 60. Nigeria On-Board Charging Converter Devices Sales and Growth Rate (2019-2025) & (K Units)
Figure 61. South Africa On-Board Charging Converter Devices Sales and Growth Rate (2019-2025) & (K Units)
Figure 62. Global On-Board Charging Converter Devices Production Market Share by Region (2019-2025)
Figure 63. North America On-Board Charging Converter Devices Production (K Units) Growth Rate (2019-2025)
Figure 64. Europe On-Board Charging Converter Devices Production (K Units) Growth Rate (2019-2025)
Figure 65. Japan On-Board Charging Converter Devices Production (K Units) Growth Rate (2019-2025)
Figure 66. China On-Board Charging Converter Devices Production (K Units) Growth Rate (2019-2025)
Figure 67. Global On-Board Charging Converter Devices Sales Forecast by Volume (2019-2032) & (K Units)
Figure 68. Global On-Board Charging Converter Devices Market Size Forecast by Value (2019-2032) & (M USD)
Figure 69. Global On-Board Charging Converter Devices Sales Market Share Forecast by Type (2025-2032)
Figure 70. Global On-Board Charging Converter Devices Market Share Forecast by Type (2025-2032)
Figure 71. Global On-Board Charging Converter Devices Sales Forecast by Application (2025-2032)
Figure 72. Global On-Board Charging Converter Devices Market Share Forecast by Application (2025-2032)

