Oncorhynchus fish farming refers to the aquaculture of specific salmonid species belonging to the Oncorhynchus genus, including coho salmon (Oncorhynchus kisutch), rainbow trout (Oncorhynchus mykiss), and chinook salmon (Oncorhynchus tshawytscha). It is a subset of fish farming that focuses on raising these species in controlled environments, such as tanks, net pens, or open-water systems, to meet the increasing global demand for salmon. While Atlantic salmon (Salmo salar) dominates the overall salmon farming industry, Oncorhynchus species represent a critical segment, especially in regions where local preferences and environmental conditions favor their cultivation.
This method involves advanced aquaculture technologies and practices to ensure optimal fish growth, health, and sustainability while addressing environmental concerns. Key products of Oncorhynchus fish farming are used in the food industry, especially in processed forms like fillets, smoked salmon, and sushi-grade fish.
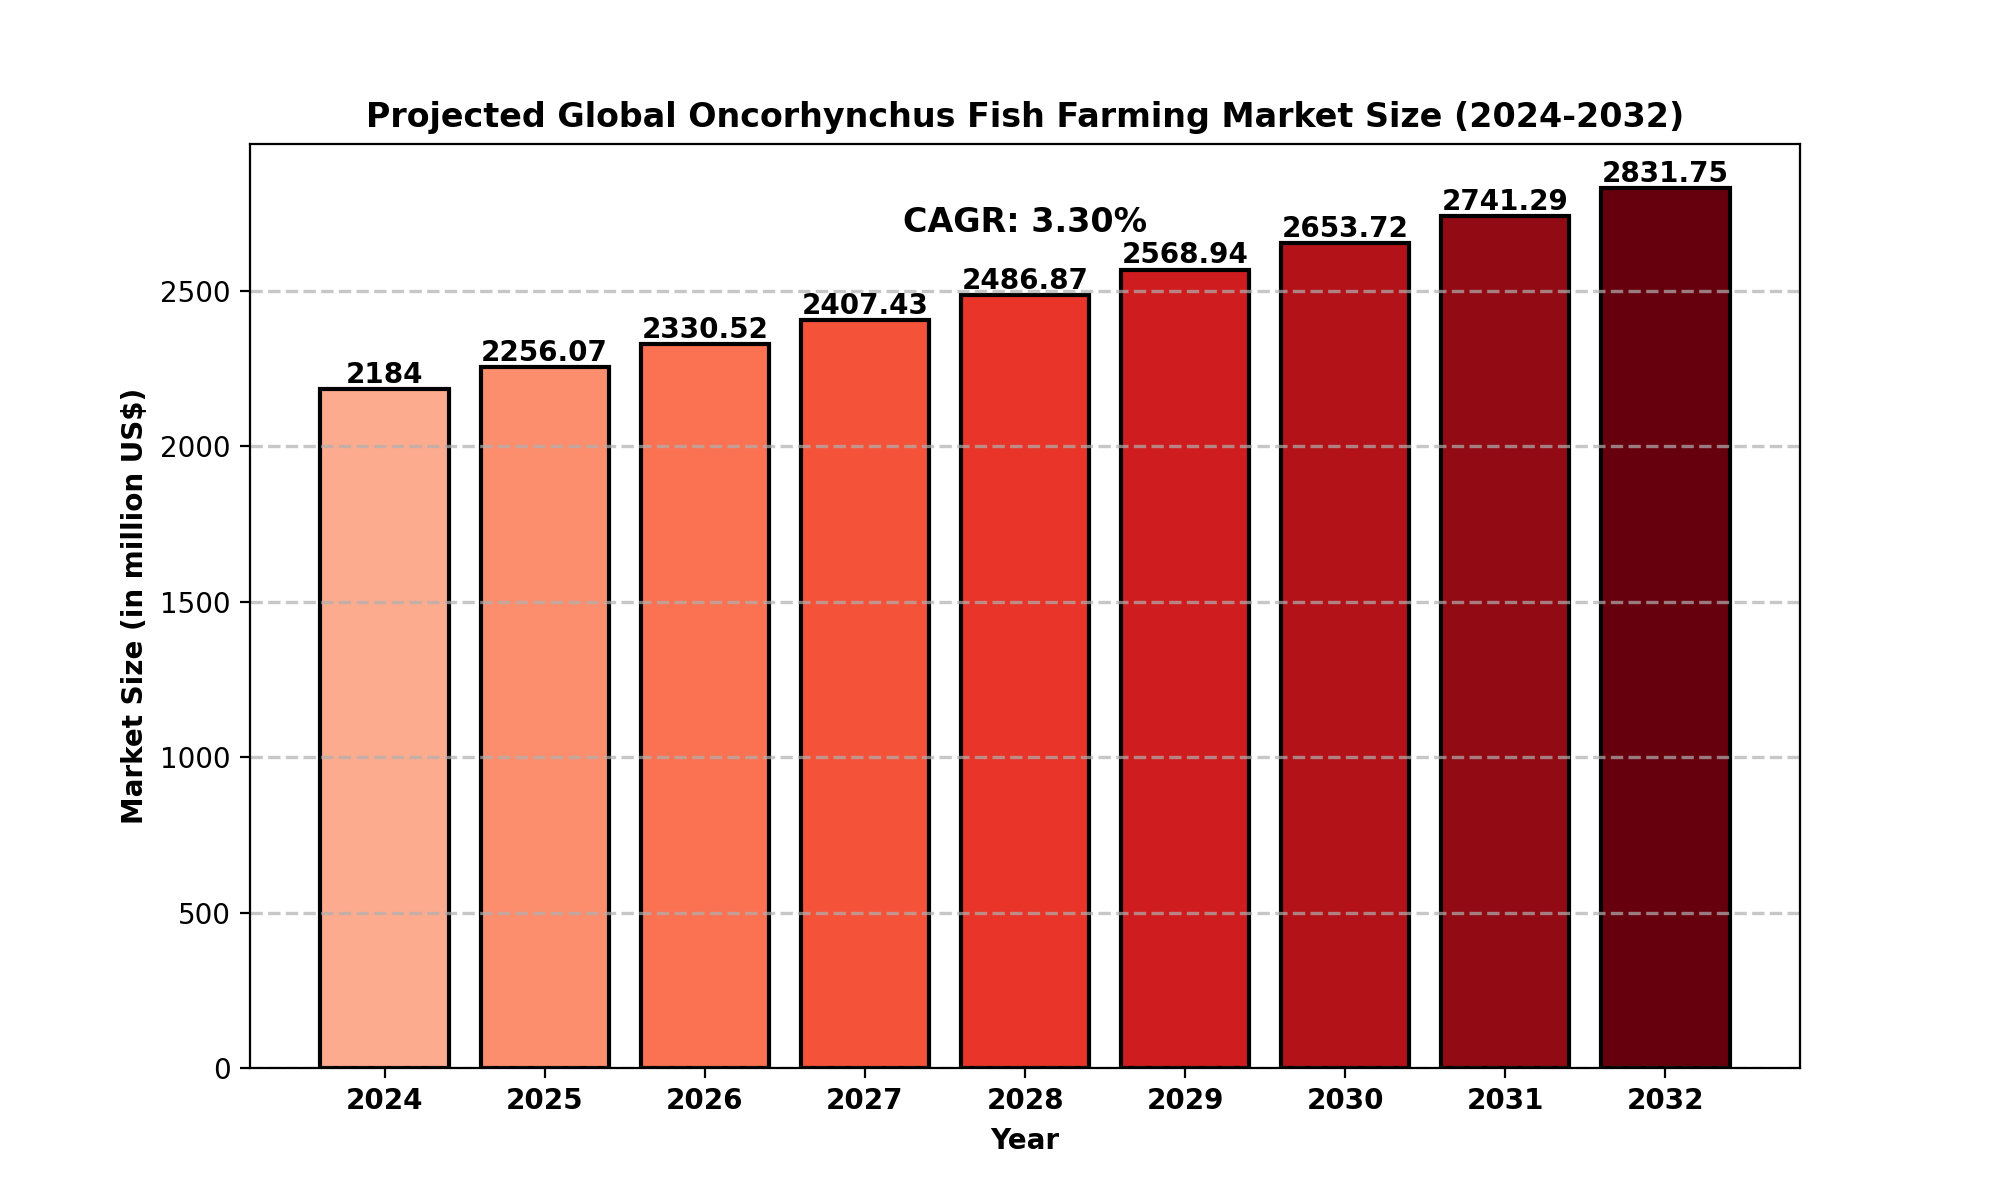
Market Size
The global Oncorhynchus Fish Farming market was valued at approximately USD 2,184 million in 2024 and is forecasted to reach USD 2,831.75 million by 2032, growing at a compound annual growth rate (CAGR) of 3.30% during the forecast period.
North America held a significant share, with its market size estimated at USD 601.74 million in 2024. The region is expected to experience steady growth at a CAGR of 2.83% through 2032, driven by advancements in aquaculture technologies, increasing demand for sustainable seafood, and government policies supporting fish farming practices.
Globally, the demand for Oncorhynchus fish farming is being fueled by rising seafood consumption, driven by its nutritional benefits, including high protein content, omega-3 fatty acids, and essential vitamins. The growing awareness of sustainable and eco-friendly fish farming practices further boosts the industry's expansion.
Market Dynamics (Drivers, Restraints, Opportunities, and Challenges)
Drivers
-
Increasing Seafood Consumption: With a global shift toward healthier diets, seafood consumption has risen significantly. Oncorhynchus fish, particularly coho salmon and rainbow trout, are sought after for their high nutritional value.
-
Sustainable Aquaculture Practices: As consumers become more environmentally conscious, demand for sustainably farmed seafood, including Oncorhynchus species, has increased.
-
Advancements in Aquaculture Technology: Innovations such as recirculating aquaculture systems (RAS) and offshore farming techniques have improved production efficiency and fish health.
-
Government Support and Policies: Regulatory frameworks in key regions promote sustainable aquaculture practices, boosting investments in Oncorhynchus fish farming.
Restraints
-
High Initial Investment Costs: Setting up modern fish farming facilities with advanced technologies requires significant capital investment.
-
Environmental Concerns: Issues such as water pollution, habitat degradation, and disease outbreaks in aquaculture systems remain challenges.
-
Market Competition: The dominance of Atlantic salmon farming often overshadows Oncorhynchus fish farming, limiting market penetration in some regions.
Opportunities
-
Rising Demand for Organic and Sustainable Products: Organic-certified fish farming practices present a lucrative opportunity for market growth.
-
Expansion in Emerging Markets: Developing countries in Asia-Pacific and South America show growing demand for Oncorhynchus fish products.
-
Value-Added Products: Opportunities exist to develop and market processed fish products such as smoked fillets, ready-to-cook meals, and gourmet seafood items.
Challenges
-
Climate Change Impact: Rising water temperatures and changing ocean conditions pose risks to aquaculture systems.
-
Disease Management: Outbreaks of diseases like sea lice and bacterial infections can significantly affect fish health and yield.
-
Regulatory Compliance: Meeting stringent aquaculture regulations across different regions can be a complex and costly process.
Regional Analysis
North America
North America is a key player in the Oncorhynchus fish farming market, driven by high consumer demand for seafood and government incentives for sustainable aquaculture. The United States and Canada are leading contributors, leveraging advanced technologies to enhance productivity and maintain environmental standards.
Europe
Europe has shown steady growth due to increased consumption of salmon and trout. Countries like Norway, Scotland, and Germany play pivotal roles in the region's aquaculture sector. Efforts to reduce environmental impact and adopt organic fish farming practices are gaining momentum.
Asia-Pacific
Asia-Pacific represents a rapidly growing market, with China, Japan, and South Korea leading the way. The region's growing population, rising disposable incomes, and expanding seafood industry drive demand for Oncorhynchus fish farming.
South America
Chile dominates South America's aquaculture industry, particularly in salmon farming. The region benefits from favorable climatic conditions and robust export markets, particularly to North America and Europe.
Middle East and Africa
While still developing, the Middle East and Africa region shows potential for growth in aquaculture due to increasing investments in food security and sustainable farming practices.
Competitor Analysis (in brief)
The Oncorhynchus Fish Farming market is characterized by several key players:
-
Mowi ASA: A global leader in aquaculture, focusing on sustainable salmon farming.
-
SalMar: Known for innovative fish farming techniques, particularly in Norway.
-
Cermaq (Mitsubishi): A major producer with a strong emphasis on sustainability.
-
Leroy Seafood Group: Specializes in high-quality salmon and trout products.
-
Empresas Aquachile: A leading salmon exporter from Chile.
-
Grieg Seafood: Focuses on sustainable farming practices across multiple regions.
-
Cooke Aquaculture: A vertically integrated seafood company with a diverse product portfolio.
-
Bakkafrost: A Faroese company known for high-quality salmon production.
Market Segmentation (by Application)
-
Food Processing Plants: The largest consumer of farmed Oncorhynchus fish, used in the production of ready-to-eat and processed seafood products.
-
Hotels: Demand is driven by the hospitality sector for high-quality fish for gourmet dishes.
-
Supermarkets: Retail chains stock a variety of farmed salmon and trout products to meet consumer demand.
-
Other: Includes direct sales to restaurants, fish markets, and small-scale distributors.
Market Segmentation (by Type)
-
Atlantic Salmon Farming: Accounts for the majority of the market, driven by high demand and established farming practices.
-
Pacific Salmon Farming: Includes coho, chinook, and other Oncorhynchus species, catering to niche markets and regional preferences.
Key Company
-
Mowi ASA
-
SalMar
-
Cermaq (Mitsubishi)
-
Leroy Seafood Group
-
Empresas Aquachile
-
Grieg Seafood
-
Salmones Multiexport
-
Cooke Aquaculture
-
Bakkafrost
Geographic Segmentation
-
North America: USA, Canada, Mexico
-
Europe: Germany, UK, France, Russia, Italy, Rest of Europe
-
Asia-Pacific: China, Japan, South Korea, India, Southeast Asia, Rest of Asia-Pacific
-
South America: Brazil, Argentina, Columbia, Rest of South America
-
Middle East and Africa: Saudi Arabia, UAE, Egypt, Nigeria, South Africa, Rest of MEA
FAQ Section
What is the current market size of the Oncorhynchus Fish Farming market?
Which are the key companies operating in the Oncorhynchus Fish Farming market?
-
Key players include Mowi ASA, SalMar, Cermaq (Mitsubishi), Leroy Seafood Group, and Empresas Aquachile, among others.
What are the key growth drivers in the Oncorhynchus Fish Farming market?
Which regions dominate the Oncorhynchus Fish Farming market?
What are the emerging trends in the Oncorhynchus Fish Farming market?
Key Benefits of This Market Research:
-
Industry drivers, restraints, and opportunities covered in the study
-
Neutral perspective on the market performance
-
Recent industry trends and developments
-
Competitive landscape & strategies of key players
-
Potential & niche segments and regions exhibiting promising growth covered
-
Historical, current, and projected market size, in terms of value
-
In-depth analysis of the Oncorhynchus Fish Farming Market
-
Overview of the regional outlook of the Oncorhynchus Fish Farming Market:
Key Reasons to Buy this Report:
-
Access to date statistics compiled by our researchers. These provide you with historical and forecast data, which is analyzed to tell you why your market is set to change
-
This enables you to anticipate market changes to remain ahead of your competitors
-
You will be able to copy data from the Excel spreadsheet straight into your marketing plans, business presentations, or other strategic documents
-
The concise analysis, clear graph, and table format will enable you to pinpoint the information you require quickly
-
Provision of market value data for each segment and sub-segment
-
Indicates the region and segment that is expected to witness the fastest growth as well as to dominate the market
-
Analysis by geography highlighting the consumption of the product/service in the region as well as indicating the factors that are affecting the market within each region
-
Competitive landscape which incorporates the market ranking of the major players, along with new service/product launches, partnerships, business expansions, and acquisitions in the past five years of companies profiled
-
Extensive company profiles comprising of company overview, company insights, product benchmarking, and SWOT analysis for the major market players
-
The current as well as the future market outlook of the industry concerning recent developments which involve growth opportunities and drivers as well as challenges and restraints of both emerging as well as developed regions
-
Includes in-depth analysis of the market from various perspectives through Porter
TABLE OF CONTENTS
Table of Contents
1 Research Methodology and Statistical Scope
1.1 Market Definition and Statistical Scope of Oncorhynchus Fish Farming
1.2 Key Market Segments
1.2.1 Oncorhynchus Fish Farming Segment by Type
1.2.2 Oncorhynchus Fish Farming Segment by Application
1.3 Methodology & Sources of Information
1.3.1 Research Methodology
1.3.2 Research Process
1.3.3 Market Breakdown and Data Triangulation
1.3.4 Base Year
1.3.5 Report Assumptions & Caveats
2 Oncorhynchus Fish Farming Market Overview
2.1 Global Market Overview
2.1.1 Global Oncorhynchus Fish Farming Market Size (M USD) Estimates and Forecasts (2019-2032)
2.1.2 Global Oncorhynchus Fish Farming Sales Estimates and Forecasts (2019-2032)
2.2 Market Segment Executive Summary
2.3 Global Market Size by Region
3 Oncorhynchus Fish Farming Market Competitive Landscape
3.1 Global Oncorhynchus Fish Farming Sales by Manufacturers (2019-2025)
3.2 Global Oncorhynchus Fish Farming Revenue Market Share by Manufacturers (2019-2025)
3.3 Oncorhynchus Fish Farming Market Share by Company Type (Tier 1, Tier 2, and Tier 3)
3.4 Global Oncorhynchus Fish Farming Average Price by Manufacturers (2019-2025)
3.5 Manufacturers Oncorhynchus Fish Farming Sales Sites, Area Served, Product Type
3.6 Oncorhynchus Fish Farming Market Competitive Situation and Trends
3.6.1 Oncorhynchus Fish Farming Market Concentration Rate
3.6.2 Global 5 and 10 Largest Oncorhynchus Fish Farming Players Market Share by Revenue
3.6.3 Mergers & Acquisitions, Expansion
4 Oncorhynchus Fish Farming Industry Chain Analysis
4.1 Oncorhynchus Fish Farming Industry Chain Analysis
4.2 Market Overview of Key Raw Materials
4.3 Midstream Market Analysis
4.4 Downstream Customer Analysis
5 The Development and Dynamics of Oncorhynchus Fish Farming Market
5.1 Key Development Trends
5.2 Driving Factors
5.3 Market Challenges
5.4 Market Restraints
5.5 Industry News
5.5.1 New Product Developments
5.5.2 Mergers & Acquisitions
5.5.3 Expansions
5.5.4 Collaboration/Supply Contracts
5.6 Industry Policies
6 Oncorhynchus Fish Farming Market Segmentation by Type
6.1 Evaluation Matrix of Segment Market Development Potential (Type)
6.2 Global Oncorhynchus Fish Farming Sales Market Share by Type (2019-2025)
6.3 Global Oncorhynchus Fish Farming Market Size Market Share by Type (2019-2025)
6.4 Global Oncorhynchus Fish Farming Price by Type (2019-2025)
7 Oncorhynchus Fish Farming Market Segmentation by Application
7.1 Evaluation Matrix of Segment Market Development Potential (Application)
7.2 Global Oncorhynchus Fish Farming Market Sales by Application (2019-2025)
7.3 Global Oncorhynchus Fish Farming Market Size (M USD) by Application (2019-2025)
7.4 Global Oncorhynchus Fish Farming Sales Growth Rate by Application (2019-2025)
8 Oncorhynchus Fish Farming Market Consumption by Region
8.1 Global Oncorhynchus Fish Farming Sales by Region
8.1.1 Global Oncorhynchus Fish Farming Sales by Region
8.1.2 Global Oncorhynchus Fish Farming Sales Market Share by Region
8.2 North America
8.2.1 North America Oncorhynchus Fish Farming Sales by Country
8.2.2 U.S.
8.2.3 Canada
8.2.4 Mexico
8.3 Europe
8.3.1 Europe Oncorhynchus Fish Farming Sales by Country
8.3.2 Germany
8.3.3 France
8.3.4 U.K.
8.3.5 Italy
8.3.6 Russia
8.4 Asia Pacific
8.4.1 Asia Pacific Oncorhynchus Fish Farming Sales by Region
8.4.2 China
8.4.3 Japan
8.4.4 South Korea
8.4.5 India
8.4.6 Southeast Asia
8.5 South America
8.5.1 South America Oncorhynchus Fish Farming Sales by Country
8.5.2 Brazil
8.5.3 Argentina
8.5.4 Columbia
8.6 Middle East and Africa
8.6.1 Middle East and Africa Oncorhynchus Fish Farming Sales by Region
8.6.2 Saudi Arabia
8.6.3 UAE
8.6.4 Egypt
8.6.5 Nigeria
8.6.6 South Africa
9 Oncorhynchus Fish Farming Market Production by Region
9.1 Global Production of Oncorhynchus Fish Farming by Region (2019-2025)
9.2 Global Oncorhynchus Fish Farming Revenue Market Share by Region (2019-2025)
9.3 Global Oncorhynchus Fish Farming Production, Revenue, Price and Gross Margin (2019-2025)
9.4 North America Oncorhynchus Fish Farming Production
9.4.1 North America Oncorhynchus Fish Farming Production Growth Rate (2019-2025)
9.4.2 North America Oncorhynchus Fish Farming Production, Revenue, Price and Gross Margin (2019-2025)
9.5 Europe Oncorhynchus Fish Farming Production
9.5.1 Europe Oncorhynchus Fish Farming Production Growth Rate (2019-2025)
9.5.2 Europe Oncorhynchus Fish Farming Production, Revenue, Price and Gross Margin (2019-2025)
9.6 Japan Oncorhynchus Fish Farming Production (2019-2025)
9.6.1 Japan Oncorhynchus Fish Farming Production Growth Rate (2019-2025)
9.6.2 Japan Oncorhynchus Fish Farming Production, Revenue, Price and Gross Margin (2019-2025)
9.7 China Oncorhynchus Fish Farming Production (2019-2025)
9.7.1 China Oncorhynchus Fish Farming Production Growth Rate (2019-2025)
9.7.2 China Oncorhynchus Fish Farming Production, Revenue, Price and Gross Margin (2019-2025)
10 Key Companies Profile
10.1 Mowi ASA
10.1.1 Mowi ASA Oncorhynchus Fish Farming Basic Information
10.1.2 Mowi ASA Oncorhynchus Fish Farming Product Overview
10.1.3 Mowi ASA Oncorhynchus Fish Farming Product Market Performance
10.1.4 Mowi ASA Business Overview
10.1.5 Mowi ASA Oncorhynchus Fish Farming SWOT Analysis
10.1.6 Mowi ASA Recent Developments
10.2 SalMar
10.2.1 SalMar Oncorhynchus Fish Farming Basic Information
10.2.2 SalMar Oncorhynchus Fish Farming Product Overview
10.2.3 SalMar Oncorhynchus Fish Farming Product Market Performance
10.2.4 SalMar Business Overview
10.2.5 SalMar Oncorhynchus Fish Farming SWOT Analysis
10.2.6 SalMar Recent Developments
10.3 Cermaq (Mitsubishi)
10.3.1 Cermaq (Mitsubishi) Oncorhynchus Fish Farming Basic Information
10.3.2 Cermaq (Mitsubishi) Oncorhynchus Fish Farming Product Overview
10.3.3 Cermaq (Mitsubishi) Oncorhynchus Fish Farming Product Market Performance
10.3.4 Cermaq (Mitsubishi) Oncorhynchus Fish Farming SWOT Analysis
10.3.5 Cermaq (Mitsubishi) Business Overview
10.3.6 Cermaq (Mitsubishi) Recent Developments
10.4 Leroy Seafood Group
10.4.1 Leroy Seafood Group Oncorhynchus Fish Farming Basic Information
10.4.2 Leroy Seafood Group Oncorhynchus Fish Farming Product Overview
10.4.3 Leroy Seafood Group Oncorhynchus Fish Farming Product Market Performance
10.4.4 Leroy Seafood Group Business Overview
10.4.5 Leroy Seafood Group Recent Developments
10.5 Empresas Aquachile
10.5.1 Empresas Aquachile Oncorhynchus Fish Farming Basic Information
10.5.2 Empresas Aquachile Oncorhynchus Fish Farming Product Overview
10.5.3 Empresas Aquachile Oncorhynchus Fish Farming Product Market Performance
10.5.4 Empresas Aquachile Business Overview
10.5.5 Empresas Aquachile Recent Developments
10.6 Grieg Seafood
10.6.1 Grieg Seafood Oncorhynchus Fish Farming Basic Information
10.6.2 Grieg Seafood Oncorhynchus Fish Farming Product Overview
10.6.3 Grieg Seafood Oncorhynchus Fish Farming Product Market Performance
10.6.4 Grieg Seafood Business Overview
10.6.5 Grieg Seafood Recent Developments
10.7 Salmones Multiexport
10.7.1 Salmones Multiexport Oncorhynchus Fish Farming Basic Information
10.7.2 Salmones Multiexport Oncorhynchus Fish Farming Product Overview
10.7.3 Salmones Multiexport Oncorhynchus Fish Farming Product Market Performance
10.7.4 Salmones Multiexport Business Overview
10.7.5 Salmones Multiexport Recent Developments
10.8 Cooke Aquaculture
10.8.1 Cooke Aquaculture Oncorhynchus Fish Farming Basic Information
10.8.2 Cooke Aquaculture Oncorhynchus Fish Farming Product Overview
10.8.3 Cooke Aquaculture Oncorhynchus Fish Farming Product Market Performance
10.8.4 Cooke Aquaculture Business Overview
10.8.5 Cooke Aquaculture Recent Developments
10.9 Bakkafrost
10.9.1 Bakkafrost Oncorhynchus Fish Farming Basic Information
10.9.2 Bakkafrost Oncorhynchus Fish Farming Product Overview
10.9.3 Bakkafrost Oncorhynchus Fish Farming Product Market Performance
10.9.4 Bakkafrost Business Overview
10.9.5 Bakkafrost Recent Developments
11 Oncorhynchus Fish Farming Market Forecast by Region
11.1 Global Oncorhynchus Fish Farming Market Size Forecast
11.2 Global Oncorhynchus Fish Farming Market Forecast by Region
11.2.1 North America Market Size Forecast by Country
11.2.2 Europe Oncorhynchus Fish Farming Market Size Forecast by Country
11.2.3 Asia Pacific Oncorhynchus Fish Farming Market Size Forecast by Region
11.2.4 South America Oncorhynchus Fish Farming Market Size Forecast by Country
11.2.5 Middle East and Africa Forecasted Consumption of Oncorhynchus Fish Farming by Country
12 Forecast Market by Type and by Application (2025-2032)
12.1 Global Oncorhynchus Fish Farming Market Forecast by Type (2025-2032)
12.1.1 Global Forecasted Sales of Oncorhynchus Fish Farming by Type (2025-2032)
12.1.2 Global Oncorhynchus Fish Farming Market Size Forecast by Type (2025-2032)
12.1.3 Global Forecasted Price of Oncorhynchus Fish Farming by Type (2025-2032)
12.2 Global Oncorhynchus Fish Farming Market Forecast by Application (2025-2032)
12.2.1 Global Oncorhynchus Fish Farming Sales (K MT) Forecast by Application
12.2.2 Global Oncorhynchus Fish Farming Market Size (M USD) Forecast by Application (2025-2032)
13 Conclusion and Key Findings
LIST OF TABLES & FIGURES
List of Tables
Table 1. Introduction of the Type
Table 2. Introduction of the Application
Table 3. Market Size (M USD) Segment Executive Summary
Table 4. Oncorhynchus Fish Farming Market Size Comparison by Region (M USD)
Table 5. Global Oncorhynchus Fish Farming Sales (K MT) by Manufacturers (2019-2025)
Table 6. Global Oncorhynchus Fish Farming Sales Market Share by Manufacturers (2019-2025)
Table 7. Global Oncorhynchus Fish Farming Revenue (M USD) by Manufacturers (2019-2025)
Table 8. Global Oncorhynchus Fish Farming Revenue Share by Manufacturers (2019-2025)
Table 9. Company Type (Tier 1, Tier 2, and Tier 3) & (based on the Revenue in Oncorhynchus Fish Farming as of 2022)
Table 10. Global Market Oncorhynchus Fish Farming Average Price (USD/MT) of Key Manufacturers (2019-2025)
Table 11. Manufacturers Oncorhynchus Fish Farming Sales Sites and Area Served
Table 12. Manufacturers Oncorhynchus Fish Farming Product Type
Table 13. Global Oncorhynchus Fish Farming Manufacturers Market Concentration Ratio (CR5 and HHI)
Table 14. Mergers & Acquisitions, Expansion Plans
Table 15. Industry Chain Map of Oncorhynchus Fish Farming
Table 16. Market Overview of Key Raw Materials
Table 17. Midstream Market Analysis
Table 18. Downstream Customer Analysis
Table 19. Key Development Trends
Table 20. Driving Factors
Table 21. Oncorhynchus Fish Farming Market Challenges
Table 22. Global Oncorhynchus Fish Farming Sales by Type (K MT)
Table 23. Global Oncorhynchus Fish Farming Market Size by Type (M USD)
Table 24. Global Oncorhynchus Fish Farming Sales (K MT) by Type (2019-2025)
Table 25. Global Oncorhynchus Fish Farming Sales Market Share by Type (2019-2025)
Table 26. Global Oncorhynchus Fish Farming Market Size (M USD) by Type (2019-2025)
Table 27. Global Oncorhynchus Fish Farming Market Size Share by Type (2019-2025)
Table 28. Global Oncorhynchus Fish Farming Price (USD/MT) by Type (2019-2025)
Table 29. Global Oncorhynchus Fish Farming Sales (K MT) by Application
Table 30. Global Oncorhynchus Fish Farming Market Size by Application
Table 31. Global Oncorhynchus Fish Farming Sales by Application (2019-2025) & (K MT)
Table 32. Global Oncorhynchus Fish Farming Sales Market Share by Application (2019-2025)
Table 33. Global Oncorhynchus Fish Farming Sales by Application (2019-2025) & (M USD)
Table 34. Global Oncorhynchus Fish Farming Market Share by Application (2019-2025)
Table 35. Global Oncorhynchus Fish Farming Sales Growth Rate by Application (2019-2025)
Table 36. Global Oncorhynchus Fish Farming Sales by Region (2019-2025) & (K MT)
Table 37. Global Oncorhynchus Fish Farming Sales Market Share by Region (2019-2025)
Table 38. North America Oncorhynchus Fish Farming Sales by Country (2019-2025) & (K MT)
Table 39. Europe Oncorhynchus Fish Farming Sales by Country (2019-2025) & (K MT)
Table 40. Asia Pacific Oncorhynchus Fish Farming Sales by Region (2019-2025) & (K MT)
Table 41. South America Oncorhynchus Fish Farming Sales by Country (2019-2025) & (K MT)
Table 42. Middle East and Africa Oncorhynchus Fish Farming Sales by Region (2019-2025) & (K MT)
Table 43. Global Oncorhynchus Fish Farming Production (K MT) by Region (2019-2025)
Table 44. Global Oncorhynchus Fish Farming Revenue (US$ Million) by Region (2019-2025)
Table 45. Global Oncorhynchus Fish Farming Revenue Market Share by Region (2019-2025)
Table 46. Global Oncorhynchus Fish Farming Production (K MT), Revenue (US$ Million), Price (USD/MT) and Gross Margin (2019-2025)
Table 47. North America Oncorhynchus Fish Farming Production (K MT), Revenue (US$ Million), Price (USD/MT) and Gross Margin (2019-2025)
Table 48. Europe Oncorhynchus Fish Farming Production (K MT), Revenue (US$ Million), Price (USD/MT) and Gross Margin (2019-2025)
Table 49. Japan Oncorhynchus Fish Farming Production (K MT), Revenue (US$ Million), Price (USD/MT) and Gross Margin (2019-2025)
Table 50. China Oncorhynchus Fish Farming Production (K MT), Revenue (US$ Million), Price (USD/MT) and Gross Margin (2019-2025)
Table 51. Mowi ASA Oncorhynchus Fish Farming Basic Information
Table 52. Mowi ASA Oncorhynchus Fish Farming Product Overview
Table 53. Mowi ASA Oncorhynchus Fish Farming Sales (K MT), Revenue (M USD), Price (USD/MT) and Gross Margin (2019-2025)
Table 54. Mowi ASA Business Overview
Table 55. Mowi ASA Oncorhynchus Fish Farming SWOT Analysis
Table 56. Mowi ASA Recent Developments
Table 57. SalMar Oncorhynchus Fish Farming Basic Information
Table 58. SalMar Oncorhynchus Fish Farming Product Overview
Table 59. SalMar Oncorhynchus Fish Farming Sales (K MT), Revenue (M USD), Price (USD/MT) and Gross Margin (2019-2025)
Table 60. SalMar Business Overview
Table 61. SalMar Oncorhynchus Fish Farming SWOT Analysis
Table 62. SalMar Recent Developments
Table 63. Cermaq (Mitsubishi) Oncorhynchus Fish Farming Basic Information
Table 64. Cermaq (Mitsubishi) Oncorhynchus Fish Farming Product Overview
Table 65. Cermaq (Mitsubishi) Oncorhynchus Fish Farming Sales (K MT), Revenue (M USD), Price (USD/MT) and Gross Margin (2019-2025)
Table 66. Cermaq (Mitsubishi) Oncorhynchus Fish Farming SWOT Analysis
Table 67. Cermaq (Mitsubishi) Business Overview
Table 68. Cermaq (Mitsubishi) Recent Developments
Table 69. Leroy Seafood Group Oncorhynchus Fish Farming Basic Information
Table 70. Leroy Seafood Group Oncorhynchus Fish Farming Product Overview
Table 71. Leroy Seafood Group Oncorhynchus Fish Farming Sales (K MT), Revenue (M USD), Price (USD/MT) and Gross Margin (2019-2025)
Table 72. Leroy Seafood Group Business Overview
Table 73. Leroy Seafood Group Recent Developments
Table 74. Empresas Aquachile Oncorhynchus Fish Farming Basic Information
Table 75. Empresas Aquachile Oncorhynchus Fish Farming Product Overview
Table 76. Empresas Aquachile Oncorhynchus Fish Farming Sales (K MT), Revenue (M USD), Price (USD/MT) and Gross Margin (2019-2025)
Table 77. Empresas Aquachile Business Overview
Table 78. Empresas Aquachile Recent Developments
Table 79. Grieg Seafood Oncorhynchus Fish Farming Basic Information
Table 80. Grieg Seafood Oncorhynchus Fish Farming Product Overview
Table 81. Grieg Seafood Oncorhynchus Fish Farming Sales (K MT), Revenue (M USD), Price (USD/MT) and Gross Margin (2019-2025)
Table 82. Grieg Seafood Business Overview
Table 83. Grieg Seafood Recent Developments
Table 84. Salmones Multiexport Oncorhynchus Fish Farming Basic Information
Table 85. Salmones Multiexport Oncorhynchus Fish Farming Product Overview
Table 86. Salmones Multiexport Oncorhynchus Fish Farming Sales (K MT), Revenue (M USD), Price (USD/MT) and Gross Margin (2019-2025)
Table 87. Salmones Multiexport Business Overview
Table 88. Salmones Multiexport Recent Developments
Table 89. Cooke Aquaculture Oncorhynchus Fish Farming Basic Information
Table 90. Cooke Aquaculture Oncorhynchus Fish Farming Product Overview
Table 91. Cooke Aquaculture Oncorhynchus Fish Farming Sales (K MT), Revenue (M USD), Price (USD/MT) and Gross Margin (2019-2025)
Table 92. Cooke Aquaculture Business Overview
Table 93. Cooke Aquaculture Recent Developments
Table 94. Bakkafrost Oncorhynchus Fish Farming Basic Information
Table 95. Bakkafrost Oncorhynchus Fish Farming Product Overview
Table 96. Bakkafrost Oncorhynchus Fish Farming Sales (K MT), Revenue (M USD), Price (USD/MT) and Gross Margin (2019-2025)
Table 97. Bakkafrost Business Overview
Table 98. Bakkafrost Recent Developments
Table 99. Global Oncorhynchus Fish Farming Sales Forecast by Region (2025-2032) & (K MT)
Table 100. Global Oncorhynchus Fish Farming Market Size Forecast by Region (2025-2032) & (M USD)
Table 101. North America Oncorhynchus Fish Farming Sales Forecast by Country (2025-2032) & (K MT)
Table 102. North America Oncorhynchus Fish Farming Market Size Forecast by Country (2025-2032) & (M USD)
Table 103. Europe Oncorhynchus Fish Farming Sales Forecast by Country (2025-2032) & (K MT)
Table 104. Europe Oncorhynchus Fish Farming Market Size Forecast by Country (2025-2032) & (M USD)
Table 105. Asia Pacific Oncorhynchus Fish Farming Sales Forecast by Region (2025-2032) & (K MT)
Table 106. Asia Pacific Oncorhynchus Fish Farming Market Size Forecast by Region (2025-2032) & (M USD)
Table 107. South America Oncorhynchus Fish Farming Sales Forecast by Country (2025-2032) & (K MT)
Table 108. South America Oncorhynchus Fish Farming Market Size Forecast by Country (2025-2032) & (M USD)
Table 109. Middle East and Africa Oncorhynchus Fish Farming Consumption Forecast by Country (2025-2032) & (Units)
Table 110. Middle East and Africa Oncorhynchus Fish Farming Market Size Forecast by Country (2025-2032) & (M USD)
Table 111. Global Oncorhynchus Fish Farming Sales Forecast by Type (2025-2032) & (K MT)
Table 112. Global Oncorhynchus Fish Farming Market Size Forecast by Type (2025-2032) & (M USD)
Table 113. Global Oncorhynchus Fish Farming Price Forecast by Type (2025-2032) & (USD/MT)
Table 114. Global Oncorhynchus Fish Farming Sales (K MT) Forecast by Application (2025-2032)
Table 115. Global Oncorhynchus Fish Farming Market Size Forecast by Application (2025-2032) & (M USD)
List of Figures
Figure 1. Product Picture of Oncorhynchus Fish Farming
Figure 2. Data Triangulation
Figure 3. Key Caveats
Figure 4. Global Oncorhynchus Fish Farming Market Size (M USD), 2019-2032
Figure 5. Global Oncorhynchus Fish Farming Market Size (M USD) (2019-2032)
Figure 6. Global Oncorhynchus Fish Farming Sales (K MT) & (2019-2032)
Figure 7. Evaluation Matrix of Segment Market Development Potential (Type)
Figure 8. Evaluation Matrix of Segment Market Development Potential (Application)
Figure 9. Evaluation Matrix of Regional Market Development Potential
Figure 10. Oncorhynchus Fish Farming Market Size by Country (M USD)
Figure 11. Oncorhynchus Fish Farming Sales Share by Manufacturers in 2023
Figure 12. Global Oncorhynchus Fish Farming Revenue Share by Manufacturers in 2023
Figure 13. Oncorhynchus Fish Farming Market Share by Company Type (Tier 1, Tier 2 and Tier 3): 2023
Figure 14. Global Market Oncorhynchus Fish Farming Average Price (USD/MT) of Key Manufacturers in 2023
Figure 15. The Global 5 and 10 Largest Players: Market Share by Oncorhynchus Fish Farming Revenue in 2023
Figure 16. Evaluation Matrix of Segment Market Development Potential (Type)
Figure 17. Global Oncorhynchus Fish Farming Market Share by Type
Figure 18. Sales Market Share of Oncorhynchus Fish Farming by Type (2019-2025)
Figure 19. Sales Market Share of Oncorhynchus Fish Farming by Type in 2023
Figure 20. Market Size Share of Oncorhynchus Fish Farming by Type (2019-2025)
Figure 21. Market Size Market Share of Oncorhynchus Fish Farming by Type in 2023
Figure 22. Evaluation Matrix of Segment Market Development Potential (Application)
Figure 23. Global Oncorhynchus Fish Farming Market Share by Application
Figure 24. Global Oncorhynchus Fish Farming Sales Market Share by Application (2019-2025)
Figure 25. Global Oncorhynchus Fish Farming Sales Market Share by Application in 2023
Figure 26. Global Oncorhynchus Fish Farming Market Share by Application (2019-2025)
Figure 27. Global Oncorhynchus Fish Farming Market Share by Application in 2023
Figure 28. Global Oncorhynchus Fish Farming Sales Growth Rate by Application (2019-2025)
Figure 29. Global Oncorhynchus Fish Farming Sales Market Share by Region (2019-2025)
Figure 30. North America Oncorhynchus Fish Farming Sales and Growth Rate (2019-2025) & (K MT)
Figure 31. North America Oncorhynchus Fish Farming Sales Market Share by Country in 2023
Figure 32. U.S. Oncorhynchus Fish Farming Sales and Growth Rate (2019-2025) & (K MT)
Figure 33. Canada Oncorhynchus Fish Farming Sales (K MT) and Growth Rate (2019-2025)
Figure 34. Mexico Oncorhynchus Fish Farming Sales (Units) and Growth Rate (2019-2025)
Figure 35. Europe Oncorhynchus Fish Farming Sales and Growth Rate (2019-2025) & (K MT)
Figure 36. Europe Oncorhynchus Fish Farming Sales Market Share by Country in 2023
Figure 37. Germany Oncorhynchus Fish Farming Sales and Growth Rate (2019-2025) & (K MT)
Figure 38. France Oncorhynchus Fish Farming Sales and Growth Rate (2019-2025) & (K MT)
Figure 39. U.K. Oncorhynchus Fish Farming Sales and Growth Rate (2019-2025) & (K MT)
Figure 40. Italy Oncorhynchus Fish Farming Sales and Growth Rate (2019-2025) & (K MT)
Figure 41. Russia Oncorhynchus Fish Farming Sales and Growth Rate (2019-2025) & (K MT)
Figure 42. Asia Pacific Oncorhynchus Fish Farming Sales and Growth Rate (K MT)
Figure 43. Asia Pacific Oncorhynchus Fish Farming Sales Market Share by Region in 2023
Figure 44. China Oncorhynchus Fish Farming Sales and Growth Rate (2019-2025) & (K MT)
Figure 45. Japan Oncorhynchus Fish Farming Sales and Growth Rate (2019-2025) & (K MT)
Figure 46. South Korea Oncorhynchus Fish Farming Sales and Growth Rate (2019-2025) & (K MT)
Figure 47. India Oncorhynchus Fish Farming Sales and Growth Rate (2019-2025) & (K MT)
Figure 48. Southeast Asia Oncorhynchus Fish Farming Sales and Growth Rate (2019-2025) & (K MT)
Figure 49. South America Oncorhynchus Fish Farming Sales and Growth Rate (K MT)
Figure 50. South America Oncorhynchus Fish Farming Sales Market Share by Country in 2023
Figure 51. Brazil Oncorhynchus Fish Farming Sales and Growth Rate (2019-2025) & (K MT)
Figure 52. Argentina Oncorhynchus Fish Farming Sales and Growth Rate (2019-2025) & (K MT)
Figure 53. Columbia Oncorhynchus Fish Farming Sales and Growth Rate (2019-2025) & (K MT)
Figure 54. Middle East and Africa Oncorhynchus Fish Farming Sales and Growth Rate (K MT)
Figure 55. Middle East and Africa Oncorhynchus Fish Farming Sales Market Share by Region in 2023
Figure 56. Saudi Arabia Oncorhynchus Fish Farming Sales and Growth Rate (2019-2025) & (K MT)
Figure 57. UAE Oncorhynchus Fish Farming Sales and Growth Rate (2019-2025) & (K MT)
Figure 58. Egypt Oncorhynchus Fish Farming Sales and Growth Rate (2019-2025) & (K MT)
Figure 59. Nigeria Oncorhynchus Fish Farming Sales and Growth Rate (2019-2025) & (K MT)
Figure 60. South Africa Oncorhynchus Fish Farming Sales and Growth Rate (2019-2025) & (K MT)
Figure 61. Global Oncorhynchus Fish Farming Production Market Share by Region (2019-2025)
Figure 62. North America Oncorhynchus Fish Farming Production (K MT) Growth Rate (2019-2025)
Figure 63. Europe Oncorhynchus Fish Farming Production (K MT) Growth Rate (2019-2025)
Figure 64. Japan Oncorhynchus Fish Farming Production (K MT) Growth Rate (2019-2025)
Figure 65. China Oncorhynchus Fish Farming Production (K MT) Growth Rate (2019-2025)
Figure 66. Global Oncorhynchus Fish Farming Sales Forecast by Volume (2019-2032) & (K MT)
Figure 67. Global Oncorhynchus Fish Farming Market Size Forecast by Value (2019-2032) & (M USD)
Figure 68. Global Oncorhynchus Fish Farming Sales Market Share Forecast by Type (2025-2032)
Figure 69. Global Oncorhynchus Fish Farming Market Share Forecast by Type (2025-2032)
Figure 70. Global Oncorhynchus Fish Farming Sales Forecast by Application (2025-2032)
Figure 71. Global Oncorhynchus Fish Farming Market Share Forecast by Application (2025-2032)

