Nonsteroidal anti-inflammatory drugs (NSAIDs) are medicines that are widely used for pain relief, stress reduction, and temperature control. These medications help alleviate symptoms such as period pain, sprains, strains, headaches, colds, flu, arthritis, and other long-term pain conditions. NSAIDs function by inhibiting COX-1 and COX-2 enzymes responsible for inflammation. Common examples of NSAIDs include aspirin, naproxen, ibuprofen, and paracetamol, which exhibit sedative and anti-inflammatory effects.
Market Size
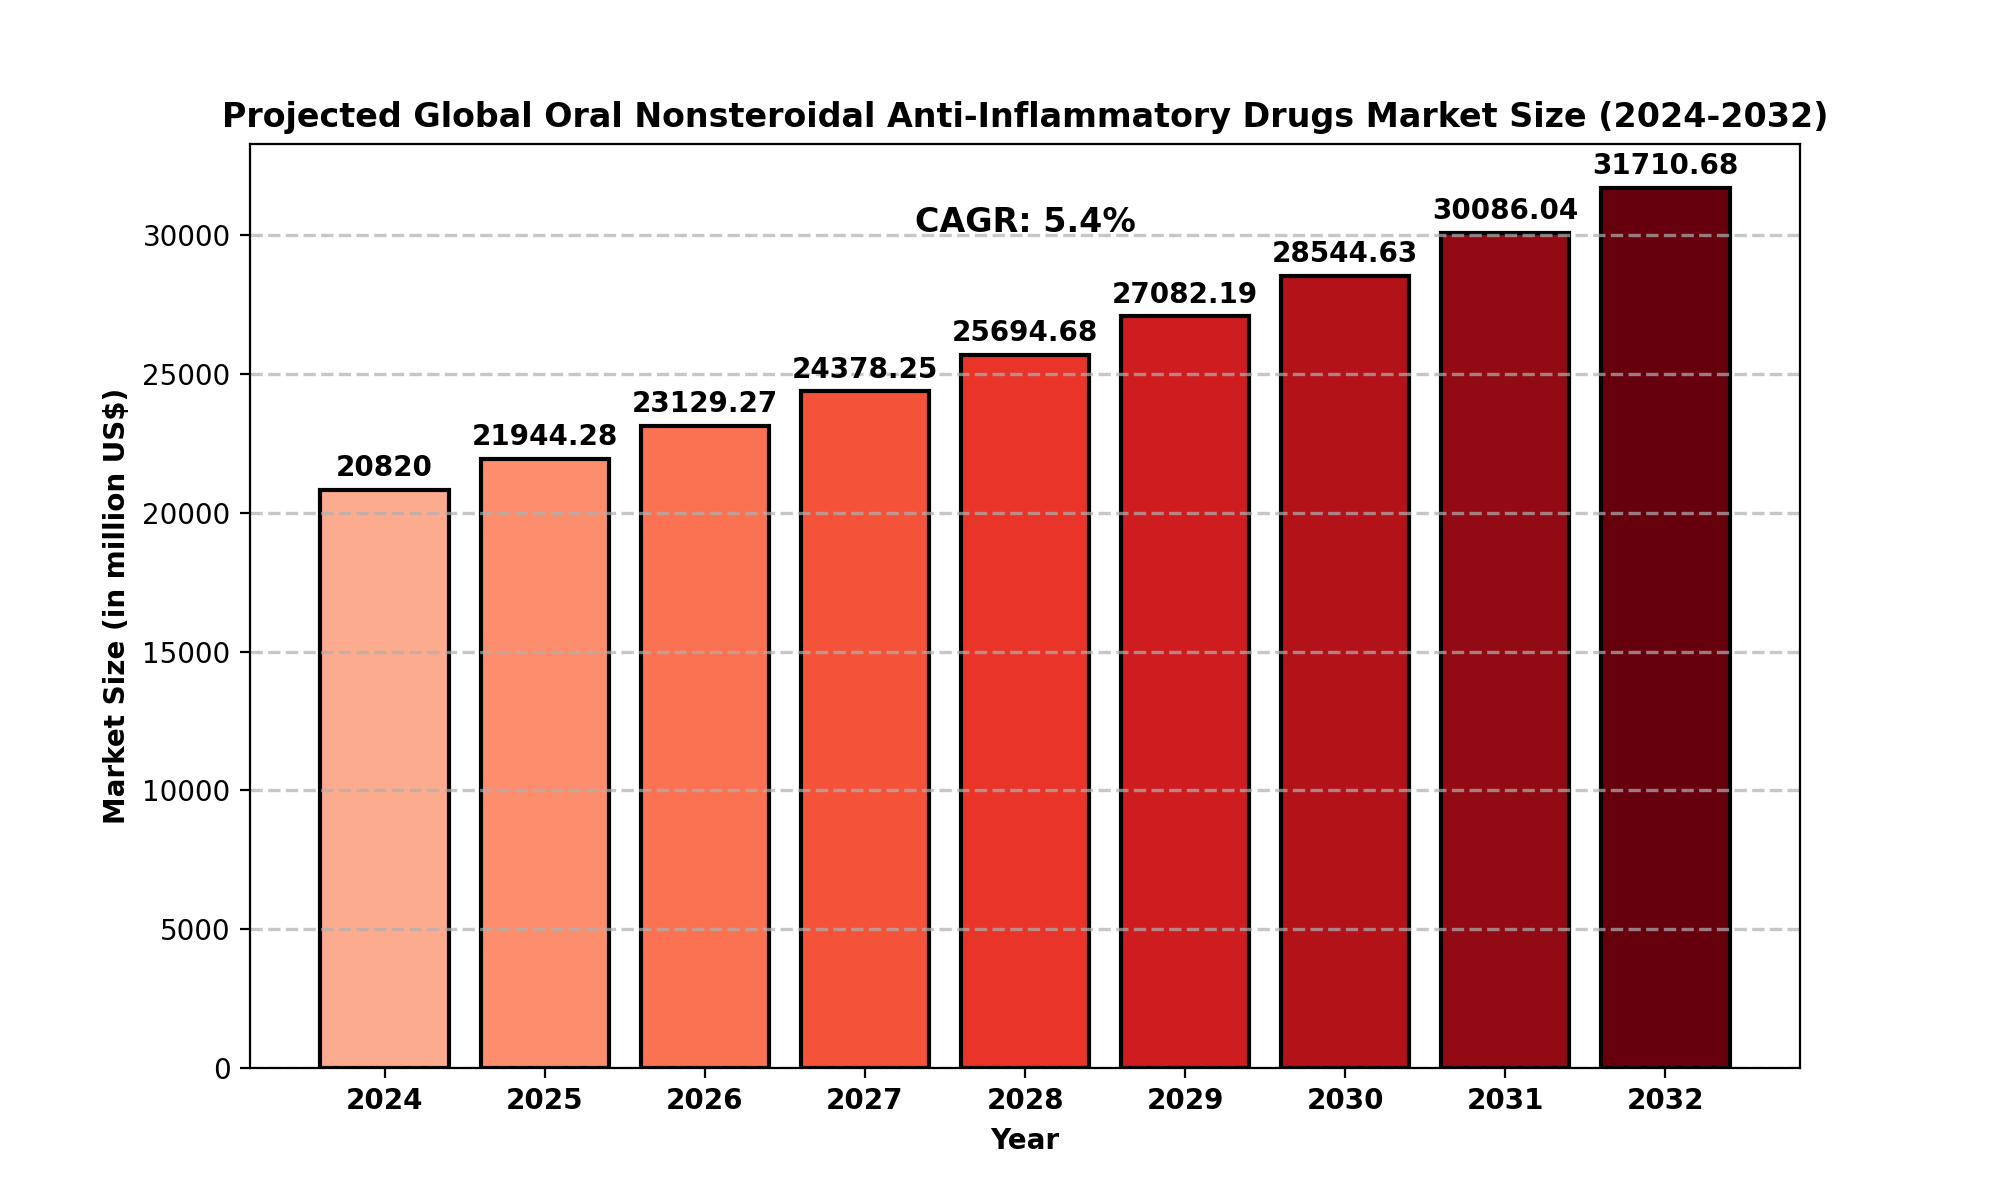
The global Oral Nonsteroidal Anti-Inflammatory Drugs market size was valued at USD 20,820 million in 2024. It is projected to grow significantly, reaching USD 31,710.68 million by 2032, with a Compound Annual Growth Rate (CAGR) of 5.40% during the forecast period.
In North America, the market was estimated at USD 5,938.93 million in 2024, with an anticipated CAGR of 4.63% from 2025 to 2032. This growth is fueled by increasing demand for effective pain management solutions and the rising prevalence of chronic conditions.
Market Dynamics (Drivers, Restraints, Opportunities, and Challenges)
Drivers
-
Growing Prevalence of Chronic Diseases: Rising cases of arthritis, migraines, and other chronic pain conditions are driving the demand for NSAIDs globally.
-
Increasing Awareness: Enhanced awareness regarding pain management and the benefits of NSAIDs fuels market growth.
-
Aging Population: The growing elderly population, prone to musculoskeletal disorders, significantly contributes to the market demand.
-
Expanding Healthcare Access: Improved access to healthcare services in developing regions boosts NSAID consumption.
Restraints
-
Adverse Side Effects: Prolonged NSAID usage can lead to gastrointestinal issues, cardiovascular risks, and renal complications, limiting their adoption.
-
Availability of Alternatives: The presence of alternative pain management therapies, including biologics and acupuncture, poses challenges.
Opportunities
-
R&D Investments: Continuous investments in developing safer and more effective NSAID formulations present growth opportunities.
-
Emerging Markets: Untapped potential in developing regions, coupled with rising healthcare expenditure, offers significant opportunities for market players.
Challenges
-
Regulatory Constraints: Stringent approval processes and safety regulations can hinder market expansion.
-
Market Competition: The presence of numerous generic drug manufacturers intensifies competition, impacting profit margins.
Regional Analysis
North America
North America remains a key market due to high healthcare spending, advanced healthcare infrastructure, and widespread adoption of NSAIDs. The U.S. leads the region with robust sales and significant R&D activities.
Europe
Europe accounts for a substantial share of the market, driven by increasing awareness of pain management and a strong focus on elderly care. Countries like Germany, the UK, and France are major contributors.
Asia-Pacific
Asia-Pacific is anticipated to witness the fastest growth, propelled by a rising population, increasing disposable income, and improving healthcare infrastructure in countries such as China, India, and Japan.
South America
South America is experiencing moderate growth due to improving healthcare systems and growing awareness about NSAIDs. Brazil and Argentina are the major markets in this region.
Middle East and Africa
The Middle East and Africa represent a growing market with improving healthcare facilities and increasing focus on chronic disease management.
Competitor Analysis
Key players in the global Oral Nonsteroidal Anti-Inflammatory Drugs market include:
-
Bayer AG
-
Pfizer Inc
-
Reckitt Benckiser Group PLC
-
Novartis AG
-
DAIICHI SANKYO COMPANY, LIMITED
-
Zydus Group
-
Lupin
-
GSK Plc
-
Glenmark Pharmaceuticals Inc
-
Amneal Pharmaceuticals
-
AstraZeneca
-
Johnson & Johnson
These companies focus on product innovation, strategic partnerships, and geographic expansion to strengthen their market position.
Market Segmentation (by Application)
-
Sterilization
-
Bacteriostasis
Market Segmentation (by Type)
-
Penicillins
-
Cephalosporins
-
Tetracyclins
-
Sulfonamides
-
Other
Geographic Segmentation
-
North America: USA, Canada, Mexico
-
Europe: Germany, UK, France, Russia, Italy, Rest of Europe
-
Asia-Pacific: China, Japan, South Korea, India, Southeast Asia, Rest of Asia-Pacific
-
South America: Brazil, Argentina, Colombia, Rest of South America
-
Middle East and Africa: Saudi Arabia, UAE, Egypt, Nigeria, South Africa, Rest of MEA
FAQ Section
What is the current market size of the Oral Nonsteroidal Anti-Inflammatory Drugs market?
- The global market was valued at USD 20,820 million in 2024.
Which are the key companies operating in the Oral Nonsteroidal Anti-Inflammatory Drugs market?
- Prominent players include Bayer AG, Pfizer Inc, Novartis AG, Reckitt Benckiser Group PLC, and Johnson & Johnson.
What are the key growth drivers in the Oral Nonsteroidal Anti-Inflammatory Drugs market?
- Key drivers include the rising prevalence of chronic diseases, increasing awareness, an aging population, and improved healthcare access.
Which regions dominate the Oral Nonsteroidal Anti-Inflammatory Drugs market?
- North America and Europe are leading regions, with Asia-Pacific showing the fastest growth.
What are the emerging trends in the Oral Nonsteroidal Anti-Inflammatory Drugs market?
- Emerging trends include the development of safer NSAID formulations, rising adoption in emerging markets, and increased focus on chronic pain management solutions.
Key Benefits of This Market Research:
- Industry drivers, restraints, and opportunities covered in the study
- Neutral perspective on the market performance
- Recent industry trends and developments
- Competitive landscape & strategies of key players
- Potential & niche segments and regions exhibiting promising growth covered
- Historical, current, and projected market size, in terms of value
- In-depth analysis of the Oral Nonsteroidal Anti-Inflammatory Drugs Market
- Overview of the regional outlook of the Oral Nonsteroidal Anti-Inflammatory Drugs Market:
Key Reasons to Buy this Report:
- Access to date statistics compiled by our researchers. These provide you with historical and forecast data, which is analyzed to tell you why your market is set to change
- This enables you to anticipate market changes to remain ahead of your competitors
- You will be able to copy data from the Excel spreadsheet straight into your marketing plans, business presentations, or other strategic documents
- The concise analysis, clear graph, and table format will enable you to pinpoint the information you require quickly
- Provision of market value data for each segment and sub-segment
- Indicates the region and segment that is expected to witness the fastest growth as well as to dominate the market
- Analysis by geography highlighting the consumption of the product/service in the region as well as indicating the factors that are affecting the market within each region
- Competitive landscape which incorporates the market ranking of the major players, along with new service/product launches, partnerships, business expansions, and acquisitions in the past five years of companies profiled
- Extensive company profiles comprising of company overview, company insights, product benchmarking, and SWOT analysis for the major market players
- The current as well as the future market outlook of the industry concerning recent developments which involve growth opportunities and drivers as well as challenges and restraints of both emerging as well as developed regions
- Includes in-depth analysis of the market from various perspectives through Porter
TABLE OF CONTENTS
Table of Contents
1 Research Methodology and Statistical Scope
1.1 Market Definition and Statistical Scope of Oral Nonsteroidal Anti-Inflammatory Drugs
1.2 Key Market Segments
1.2.1 Oral Nonsteroidal Anti-Inflammatory Drugs Segment by Type
1.2.2 Oral Nonsteroidal Anti-Inflammatory Drugs Segment by Application
1.3 Methodology & Sources of Information
1.3.1 Research Methodology
1.3.2 Research Process
1.3.3 Market Breakdown and Data Triangulation
1.3.4 Base Year
1.3.5 Report Assumptions & Caveats
2 Oral Nonsteroidal Anti-Inflammatory Drugs Market Overview
2.1 Global Market Overview
2.1.1 Global Oral Nonsteroidal Anti-Inflammatory Drugs Market Size (M USD) Estimates and Forecasts (2019-2032)
2.1.2 Global Oral Nonsteroidal Anti-Inflammatory Drugs Sales Estimates and Forecasts (2019-2032)
2.2 Market Segment Executive Summary
2.3 Global Market Size by Region
3 Oral Nonsteroidal Anti-Inflammatory Drugs Market Competitive Landscape
3.1 Global Oral Nonsteroidal Anti-Inflammatory Drugs Sales by Manufacturers (2019-2025)
3.2 Global Oral Nonsteroidal Anti-Inflammatory Drugs Revenue Market Share by Manufacturers (2019-2025)
3.3 Oral Nonsteroidal Anti-Inflammatory Drugs Market Share by Company Type (Tier 1, Tier 2, and Tier 3)
3.4 Global Oral Nonsteroidal Anti-Inflammatory Drugs Average Price by Manufacturers (2019-2025)
3.5 Manufacturers Oral Nonsteroidal Anti-Inflammatory Drugs Sales Sites, Area Served, Product Type
3.6 Oral Nonsteroidal Anti-Inflammatory Drugs Market Competitive Situation and Trends
3.6.1 Oral Nonsteroidal Anti-Inflammatory Drugs Market Concentration Rate
3.6.2 Global 5 and 10 Largest Oral Nonsteroidal Anti-Inflammatory Drugs Players Market Share by Revenue
3.6.3 Mergers & Acquisitions, Expansion
4 Oral Nonsteroidal Anti-Inflammatory Drugs Industry Chain Analysis
4.1 Oral Nonsteroidal Anti-Inflammatory Drugs Industry Chain Analysis
4.2 Market Overview of Key Raw Materials
4.3 Midstream Market Analysis
4.4 Downstream Customer Analysis
5 The Development and Dynamics of Oral Nonsteroidal Anti-Inflammatory Drugs Market
5.1 Key Development Trends
5.2 Driving Factors
5.3 Market Challenges
5.4 Market Restraints
5.5 Industry News
5.5.1 New Product Developments
5.5.2 Mergers & Acquisitions
5.5.3 Expansions
5.5.4 Collaboration/Supply Contracts
5.6 Industry Policies
6 Oral Nonsteroidal Anti-Inflammatory Drugs Market Segmentation by Type
6.1 Evaluation Matrix of Segment Market Development Potential (Type)
6.2 Global Oral Nonsteroidal Anti-Inflammatory Drugs Sales Market Share by Type (2019-2025)
6.3 Global Oral Nonsteroidal Anti-Inflammatory Drugs Market Size Market Share by Type (2019-2025)
6.4 Global Oral Nonsteroidal Anti-Inflammatory Drugs Price by Type (2019-2025)
7 Oral Nonsteroidal Anti-Inflammatory Drugs Market Segmentation by Application
7.1 Evaluation Matrix of Segment Market Development Potential (Application)
7.2 Global Oral Nonsteroidal Anti-Inflammatory Drugs Market Sales by Application (2019-2025)
7.3 Global Oral Nonsteroidal Anti-Inflammatory Drugs Market Size (M USD) by Application (2019-2025)
7.4 Global Oral Nonsteroidal Anti-Inflammatory Drugs Sales Growth Rate by Application (2019-2025)
8 Oral Nonsteroidal Anti-Inflammatory Drugs Market Consumption by Region
8.1 Global Oral Nonsteroidal Anti-Inflammatory Drugs Sales by Region
8.1.1 Global Oral Nonsteroidal Anti-Inflammatory Drugs Sales by Region
8.1.2 Global Oral Nonsteroidal Anti-Inflammatory Drugs Sales Market Share by Region
8.2 North America
8.2.1 North America Oral Nonsteroidal Anti-Inflammatory Drugs Sales by Country
8.2.2 U.S.
8.2.3 Canada
8.2.4 Mexico
8.3 Europe
8.3.1 Europe Oral Nonsteroidal Anti-Inflammatory Drugs Sales by Country
8.3.2 Germany
8.3.3 France
8.3.4 U.K.
8.3.5 Italy
8.3.6 Russia
8.4 Asia Pacific
8.4.1 Asia Pacific Oral Nonsteroidal Anti-Inflammatory Drugs Sales by Region
8.4.2 China
8.4.3 Japan
8.4.4 South Korea
8.4.5 India
8.4.6 Southeast Asia
8.5 South America
8.5.1 South America Oral Nonsteroidal Anti-Inflammatory Drugs Sales by Country
8.5.2 Brazil
8.5.3 Argentina
8.5.4 Columbia
8.6 Middle East and Africa
8.6.1 Middle East and Africa Oral Nonsteroidal Anti-Inflammatory Drugs Sales by Region
8.6.2 Saudi Arabia
8.6.3 UAE
8.6.4 Egypt
8.6.5 Nigeria
8.6.6 South Africa
9 Oral Nonsteroidal Anti-Inflammatory Drugs Market Production by Region
9.1 Global Production of Oral Nonsteroidal Anti-Inflammatory Drugs by Region (2019-2025)
9.2 Global Oral Nonsteroidal Anti-Inflammatory Drugs Revenue Market Share by Region (2019-2025)
9.3 Global Oral Nonsteroidal Anti-Inflammatory Drugs Production, Revenue, Price and Gross Margin (2019-2025)
9.4 North America Oral Nonsteroidal Anti-Inflammatory Drugs Production
9.4.1 North America Oral Nonsteroidal Anti-Inflammatory Drugs Production Growth Rate (2019-2025)
9.4.2 North America Oral Nonsteroidal Anti-Inflammatory Drugs Production, Revenue, Price and Gross Margin (2019-2025)
9.5 Europe Oral Nonsteroidal Anti-Inflammatory Drugs Production
9.5.1 Europe Oral Nonsteroidal Anti-Inflammatory Drugs Production Growth Rate (2019-2025)
9.5.2 Europe Oral Nonsteroidal Anti-Inflammatory Drugs Production, Revenue, Price and Gross Margin (2019-2025)
9.6 Japan Oral Nonsteroidal Anti-Inflammatory Drugs Production (2019-2025)
9.6.1 Japan Oral Nonsteroidal Anti-Inflammatory Drugs Production Growth Rate (2019-2025)
9.6.2 Japan Oral Nonsteroidal Anti-Inflammatory Drugs Production, Revenue, Price and Gross Margin (2019-2025)
9.7 China Oral Nonsteroidal Anti-Inflammatory Drugs Production (2019-2025)
9.7.1 China Oral Nonsteroidal Anti-Inflammatory Drugs Production Growth Rate (2019-2025)
9.7.2 China Oral Nonsteroidal Anti-Inflammatory Drugs Production, Revenue, Price and Gross Margin (2019-2025)
10 Key Companies Profile
10.1 Bayer AG
10.1.1 Bayer AG Oral Nonsteroidal Anti-Inflammatory Drugs Basic Information
10.1.2 Bayer AG Oral Nonsteroidal Anti-Inflammatory Drugs Product Overview
10.1.3 Bayer AG Oral Nonsteroidal Anti-Inflammatory Drugs Product Market Performance
10.1.4 Bayer AG Business Overview
10.1.5 Bayer AG Oral Nonsteroidal Anti-Inflammatory Drugs SWOT Analysis
10.1.6 Bayer AG Recent Developments
10.2 Pfizer Inc
10.2.1 Pfizer Inc Oral Nonsteroidal Anti-Inflammatory Drugs Basic Information
10.2.2 Pfizer Inc Oral Nonsteroidal Anti-Inflammatory Drugs Product Overview
10.2.3 Pfizer Inc Oral Nonsteroidal Anti-Inflammatory Drugs Product Market Performance
10.2.4 Pfizer Inc Business Overview
10.2.5 Pfizer Inc Oral Nonsteroidal Anti-Inflammatory Drugs SWOT Analysis
10.2.6 Pfizer Inc Recent Developments
10.3 Reckitt Benckiser Group PLC
10.3.1 Reckitt Benckiser Group PLC Oral Nonsteroidal Anti-Inflammatory Drugs Basic Information
10.3.2 Reckitt Benckiser Group PLC Oral Nonsteroidal Anti-Inflammatory Drugs Product Overview
10.3.3 Reckitt Benckiser Group PLC Oral Nonsteroidal Anti-Inflammatory Drugs Product Market Performance
10.3.4 Reckitt Benckiser Group PLC Oral Nonsteroidal Anti-Inflammatory Drugs SWOT Analysis
10.3.5 Reckitt Benckiser Group PLC Business Overview
10.3.6 Reckitt Benckiser Group PLC Recent Developments
10.4 Novartis AG
10.4.1 Novartis AG Oral Nonsteroidal Anti-Inflammatory Drugs Basic Information
10.4.2 Novartis AG Oral Nonsteroidal Anti-Inflammatory Drugs Product Overview
10.4.3 Novartis AG Oral Nonsteroidal Anti-Inflammatory Drugs Product Market Performance
10.4.4 Novartis AG Business Overview
10.4.5 Novartis AG Recent Developments
10.5 DAIICHI SANKYO COMPANY
10.5.1 DAIICHI SANKYO COMPANY Oral Nonsteroidal Anti-Inflammatory Drugs Basic Information
10.5.2 DAIICHI SANKYO COMPANY Oral Nonsteroidal Anti-Inflammatory Drugs Product Overview
10.5.3 DAIICHI SANKYO COMPANY Oral Nonsteroidal Anti-Inflammatory Drugs Product Market Performance
10.5.4 DAIICHI SANKYO COMPANY Business Overview
10.5.5 DAIICHI SANKYO COMPANY Recent Developments
10.6 LIMITED
10.6.1 LIMITED Oral Nonsteroidal Anti-Inflammatory Drugs Basic Information
10.6.2 LIMITED Oral Nonsteroidal Anti-Inflammatory Drugs Product Overview
10.6.3 LIMITED Oral Nonsteroidal Anti-Inflammatory Drugs Product Market Performance
10.6.4 LIMITED Business Overview
10.6.5 LIMITED Recent Developments
10.7 Zydus Group
10.7.1 Zydus Group Oral Nonsteroidal Anti-Inflammatory Drugs Basic Information
10.7.2 Zydus Group Oral Nonsteroidal Anti-Inflammatory Drugs Product Overview
10.7.3 Zydus Group Oral Nonsteroidal Anti-Inflammatory Drugs Product Market Performance
10.7.4 Zydus Group Business Overview
10.7.5 Zydus Group Recent Developments
10.8 Lupin
10.8.1 Lupin Oral Nonsteroidal Anti-Inflammatory Drugs Basic Information
10.8.2 Lupin Oral Nonsteroidal Anti-Inflammatory Drugs Product Overview
10.8.3 Lupin Oral Nonsteroidal Anti-Inflammatory Drugs Product Market Performance
10.8.4 Lupin Business Overview
10.8.5 Lupin Recent Developments
10.9 GSK Plc
10.9.1 GSK Plc Oral Nonsteroidal Anti-Inflammatory Drugs Basic Information
10.9.2 GSK Plc Oral Nonsteroidal Anti-Inflammatory Drugs Product Overview
10.9.3 GSK Plc Oral Nonsteroidal Anti-Inflammatory Drugs Product Market Performance
10.9.4 GSK Plc Business Overview
10.9.5 GSK Plc Recent Developments
10.10 Glenmark Pharmaceuticals Inc
10.10.1 Glenmark Pharmaceuticals Inc Oral Nonsteroidal Anti-Inflammatory Drugs Basic Information
10.10.2 Glenmark Pharmaceuticals Inc Oral Nonsteroidal Anti-Inflammatory Drugs Product Overview
10.10.3 Glenmark Pharmaceuticals Inc Oral Nonsteroidal Anti-Inflammatory Drugs Product Market Performance
10.10.4 Glenmark Pharmaceuticals Inc Business Overview
10.10.5 Glenmark Pharmaceuticals Inc Recent Developments
10.11 Amneal Pharmaceuticals
10.11.1 Amneal Pharmaceuticals Oral Nonsteroidal Anti-Inflammatory Drugs Basic Information
10.11.2 Amneal Pharmaceuticals Oral Nonsteroidal Anti-Inflammatory Drugs Product Overview
10.11.3 Amneal Pharmaceuticals Oral Nonsteroidal Anti-Inflammatory Drugs Product Market Performance
10.11.4 Amneal Pharmaceuticals Business Overview
10.11.5 Amneal Pharmaceuticals Recent Developments
10.12 AstraZeneca
10.12.1 AstraZeneca Oral Nonsteroidal Anti-Inflammatory Drugs Basic Information
10.12.2 AstraZeneca Oral Nonsteroidal Anti-Inflammatory Drugs Product Overview
10.12.3 AstraZeneca Oral Nonsteroidal Anti-Inflammatory Drugs Product Market Performance
10.12.4 AstraZeneca Business Overview
10.12.5 AstraZeneca Recent Developments
10.13 Johnson and Johnson
10.13.1 Johnson and Johnson Oral Nonsteroidal Anti-Inflammatory Drugs Basic Information
10.13.2 Johnson and Johnson Oral Nonsteroidal Anti-Inflammatory Drugs Product Overview
10.13.3 Johnson and Johnson Oral Nonsteroidal Anti-Inflammatory Drugs Product Market Performance
10.13.4 Johnson and Johnson Business Overview
10.13.5 Johnson and Johnson Recent Developments
11 Oral Nonsteroidal Anti-Inflammatory Drugs Market Forecast by Region
11.1 Global Oral Nonsteroidal Anti-Inflammatory Drugs Market Size Forecast
11.2 Global Oral Nonsteroidal Anti-Inflammatory Drugs Market Forecast by Region
11.2.1 North America Market Size Forecast by Country
11.2.2 Europe Oral Nonsteroidal Anti-Inflammatory Drugs Market Size Forecast by Country
11.2.3 Asia Pacific Oral Nonsteroidal Anti-Inflammatory Drugs Market Size Forecast by Region
11.2.4 South America Oral Nonsteroidal Anti-Inflammatory Drugs Market Size Forecast by Country
11.2.5 Middle East and Africa Forecasted Consumption of Oral Nonsteroidal Anti-Inflammatory Drugs by Country
12 Forecast Market by Type and by Application (2025-2032)
12.1 Global Oral Nonsteroidal Anti-Inflammatory Drugs Market Forecast by Type (2025-2032)
12.1.1 Global Forecasted Sales of Oral Nonsteroidal Anti-Inflammatory Drugs by Type (2025-2032)
12.1.2 Global Oral Nonsteroidal Anti-Inflammatory Drugs Market Size Forecast by Type (2025-2032)
12.1.3 Global Forecasted Price of Oral Nonsteroidal Anti-Inflammatory Drugs by Type (2025-2032)
12.2 Global Oral Nonsteroidal Anti-Inflammatory Drugs Market Forecast by Application (2025-2032)
12.2.1 Global Oral Nonsteroidal Anti-Inflammatory Drugs Sales (K MT) Forecast by Application
12.2.2 Global Oral Nonsteroidal Anti-Inflammatory Drugs Market Size (M USD) Forecast by Application (2025-2032)
13 Conclusion and Key Findings
LIST OF TABLES & FIGURES
List of Tables
Table 1. Introduction of the Type
Table 2. Introduction of the Application
Table 3. Market Size (M USD) Segment Executive Summary
Table 4. Oral Nonsteroidal Anti-Inflammatory Drugs Market Size Comparison by Region (M USD)
Table 5. Global Oral Nonsteroidal Anti-Inflammatory Drugs Sales (K MT) by Manufacturers (2019-2025)
Table 6. Global Oral Nonsteroidal Anti-Inflammatory Drugs Sales Market Share by Manufacturers (2019-2025)
Table 7. Global Oral Nonsteroidal Anti-Inflammatory Drugs Revenue (M USD) by Manufacturers (2019-2025)
Table 8. Global Oral Nonsteroidal Anti-Inflammatory Drugs Revenue Share by Manufacturers (2019-2025)
Table 9. Company Type (Tier 1, Tier 2, and Tier 3) & (based on the Revenue in Oral Nonsteroidal Anti-Inflammatory Drugs as of 2022)
Table 10. Global Market Oral Nonsteroidal Anti-Inflammatory Drugs Average Price (USD/MT) of Key Manufacturers (2019-2025)
Table 11. Manufacturers Oral Nonsteroidal Anti-Inflammatory Drugs Sales Sites and Area Served
Table 12. Manufacturers Oral Nonsteroidal Anti-Inflammatory Drugs Product Type
Table 13. Global Oral Nonsteroidal Anti-Inflammatory Drugs Manufacturers Market Concentration Ratio (CR5 and HHI)
Table 14. Mergers & Acquisitions, Expansion Plans
Table 15. Industry Chain Map of Oral Nonsteroidal Anti-Inflammatory Drugs
Table 16. Market Overview of Key Raw Materials
Table 17. Midstream Market Analysis
Table 18. Downstream Customer Analysis
Table 19. Key Development Trends
Table 20. Driving Factors
Table 21. Oral Nonsteroidal Anti-Inflammatory Drugs Market Challenges
Table 22. Global Oral Nonsteroidal Anti-Inflammatory Drugs Sales by Type (K MT)
Table 23. Global Oral Nonsteroidal Anti-Inflammatory Drugs Market Size by Type (M USD)
Table 24. Global Oral Nonsteroidal Anti-Inflammatory Drugs Sales (K MT) by Type (2019-2025)
Table 25. Global Oral Nonsteroidal Anti-Inflammatory Drugs Sales Market Share by Type (2019-2025)
Table 26. Global Oral Nonsteroidal Anti-Inflammatory Drugs Market Size (M USD) by Type (2019-2025)
Table 27. Global Oral Nonsteroidal Anti-Inflammatory Drugs Market Size Share by Type (2019-2025)
Table 28. Global Oral Nonsteroidal Anti-Inflammatory Drugs Price (USD/MT) by Type (2019-2025)
Table 29. Global Oral Nonsteroidal Anti-Inflammatory Drugs Sales (K MT) by Application
Table 30. Global Oral Nonsteroidal Anti-Inflammatory Drugs Market Size by Application
Table 31. Global Oral Nonsteroidal Anti-Inflammatory Drugs Sales by Application (2019-2025) & (K MT)
Table 32. Global Oral Nonsteroidal Anti-Inflammatory Drugs Sales Market Share by Application (2019-2025)
Table 33. Global Oral Nonsteroidal Anti-Inflammatory Drugs Sales by Application (2019-2025) & (M USD)
Table 34. Global Oral Nonsteroidal Anti-Inflammatory Drugs Market Share by Application (2019-2025)
Table 35. Global Oral Nonsteroidal Anti-Inflammatory Drugs Sales Growth Rate by Application (2019-2025)
Table 36. Global Oral Nonsteroidal Anti-Inflammatory Drugs Sales by Region (2019-2025) & (K MT)
Table 37. Global Oral Nonsteroidal Anti-Inflammatory Drugs Sales Market Share by Region (2019-2025)
Table 38. North America Oral Nonsteroidal Anti-Inflammatory Drugs Sales by Country (2019-2025) & (K MT)
Table 39. Europe Oral Nonsteroidal Anti-Inflammatory Drugs Sales by Country (2019-2025) & (K MT)
Table 40. Asia Pacific Oral Nonsteroidal Anti-Inflammatory Drugs Sales by Region (2019-2025) & (K MT)
Table 41. South America Oral Nonsteroidal Anti-Inflammatory Drugs Sales by Country (2019-2025) & (K MT)
Table 42. Middle East and Africa Oral Nonsteroidal Anti-Inflammatory Drugs Sales by Region (2019-2025) & (K MT)
Table 43. Global Oral Nonsteroidal Anti-Inflammatory Drugs Production (K MT) by Region (2019-2025)
Table 44. Global Oral Nonsteroidal Anti-Inflammatory Drugs Revenue (US$ Million) by Region (2019-2025)
Table 45. Global Oral Nonsteroidal Anti-Inflammatory Drugs Revenue Market Share by Region (2019-2025)
Table 46. Global Oral Nonsteroidal Anti-Inflammatory Drugs Production (K MT), Revenue (US$ Million), Price (USD/MT) and Gross Margin (2019-2025)
Table 47. North America Oral Nonsteroidal Anti-Inflammatory Drugs Production (K MT), Revenue (US$ Million), Price (USD/MT) and Gross Margin (2019-2025)
Table 48. Europe Oral Nonsteroidal Anti-Inflammatory Drugs Production (K MT), Revenue (US$ Million), Price (USD/MT) and Gross Margin (2019-2025)
Table 49. Japan Oral Nonsteroidal Anti-Inflammatory Drugs Production (K MT), Revenue (US$ Million), Price (USD/MT) and Gross Margin (2019-2025)
Table 50. China Oral Nonsteroidal Anti-Inflammatory Drugs Production (K MT), Revenue (US$ Million), Price (USD/MT) and Gross Margin (2019-2025)
Table 51. Bayer AG Oral Nonsteroidal Anti-Inflammatory Drugs Basic Information
Table 52. Bayer AG Oral Nonsteroidal Anti-Inflammatory Drugs Product Overview
Table 53. Bayer AG Oral Nonsteroidal Anti-Inflammatory Drugs Sales (K MT), Revenue (M USD), Price (USD/MT) and Gross Margin (2019-2025)
Table 54. Bayer AG Business Overview
Table 55. Bayer AG Oral Nonsteroidal Anti-Inflammatory Drugs SWOT Analysis
Table 56. Bayer AG Recent Developments
Table 57. Pfizer Inc Oral Nonsteroidal Anti-Inflammatory Drugs Basic Information
Table 58. Pfizer Inc Oral Nonsteroidal Anti-Inflammatory Drugs Product Overview
Table 59. Pfizer Inc Oral Nonsteroidal Anti-Inflammatory Drugs Sales (K MT), Revenue (M USD), Price (USD/MT) and Gross Margin (2019-2025)
Table 60. Pfizer Inc Business Overview
Table 61. Pfizer Inc Oral Nonsteroidal Anti-Inflammatory Drugs SWOT Analysis
Table 62. Pfizer Inc Recent Developments
Table 63. Reckitt Benckiser Group PLC Oral Nonsteroidal Anti-Inflammatory Drugs Basic Information
Table 64. Reckitt Benckiser Group PLC Oral Nonsteroidal Anti-Inflammatory Drugs Product Overview
Table 65. Reckitt Benckiser Group PLC Oral Nonsteroidal Anti-Inflammatory Drugs Sales (K MT), Revenue (M USD), Price (USD/MT) and Gross Margin (2019-2025)
Table 66. Reckitt Benckiser Group PLC Oral Nonsteroidal Anti-Inflammatory Drugs SWOT Analysis
Table 67. Reckitt Benckiser Group PLC Business Overview
Table 68. Reckitt Benckiser Group PLC Recent Developments
Table 69. Novartis AG Oral Nonsteroidal Anti-Inflammatory Drugs Basic Information
Table 70. Novartis AG Oral Nonsteroidal Anti-Inflammatory Drugs Product Overview
Table 71. Novartis AG Oral Nonsteroidal Anti-Inflammatory Drugs Sales (K MT), Revenue (M USD), Price (USD/MT) and Gross Margin (2019-2025)
Table 72. Novartis AG Business Overview
Table 73. Novartis AG Recent Developments
Table 74. DAIICHI SANKYO COMPANY Oral Nonsteroidal Anti-Inflammatory Drugs Basic Information
Table 75. DAIICHI SANKYO COMPANY Oral Nonsteroidal Anti-Inflammatory Drugs Product Overview
Table 76. DAIICHI SANKYO COMPANY Oral Nonsteroidal Anti-Inflammatory Drugs Sales (K MT), Revenue (M USD), Price (USD/MT) and Gross Margin (2019-2025)
Table 77. DAIICHI SANKYO COMPANY Business Overview
Table 78. DAIICHI SANKYO COMPANY Recent Developments
Table 79. LIMITED Oral Nonsteroidal Anti-Inflammatory Drugs Basic Information
Table 80. LIMITED Oral Nonsteroidal Anti-Inflammatory Drugs Product Overview
Table 81. LIMITED Oral Nonsteroidal Anti-Inflammatory Drugs Sales (K MT), Revenue (M USD), Price (USD/MT) and Gross Margin (2019-2025)
Table 82. LIMITED Business Overview
Table 83. LIMITED Recent Developments
Table 84. Zydus Group Oral Nonsteroidal Anti-Inflammatory Drugs Basic Information
Table 85. Zydus Group Oral Nonsteroidal Anti-Inflammatory Drugs Product Overview
Table 86. Zydus Group Oral Nonsteroidal Anti-Inflammatory Drugs Sales (K MT), Revenue (M USD), Price (USD/MT) and Gross Margin (2019-2025)
Table 87. Zydus Group Business Overview
Table 88. Zydus Group Recent Developments
Table 89. Lupin Oral Nonsteroidal Anti-Inflammatory Drugs Basic Information
Table 90. Lupin Oral Nonsteroidal Anti-Inflammatory Drugs Product Overview
Table 91. Lupin Oral Nonsteroidal Anti-Inflammatory Drugs Sales (K MT), Revenue (M USD), Price (USD/MT) and Gross Margin (2019-2025)
Table 92. Lupin Business Overview
Table 93. Lupin Recent Developments
Table 94. GSK Plc Oral Nonsteroidal Anti-Inflammatory Drugs Basic Information
Table 95. GSK Plc Oral Nonsteroidal Anti-Inflammatory Drugs Product Overview
Table 96. GSK Plc Oral Nonsteroidal Anti-Inflammatory Drugs Sales (K MT), Revenue (M USD), Price (USD/MT) and Gross Margin (2019-2025)
Table 97. GSK Plc Business Overview
Table 98. GSK Plc Recent Developments
Table 99. Glenmark Pharmaceuticals Inc Oral Nonsteroidal Anti-Inflammatory Drugs Basic Information
Table 100. Glenmark Pharmaceuticals Inc Oral Nonsteroidal Anti-Inflammatory Drugs Product Overview
Table 101. Glenmark Pharmaceuticals Inc Oral Nonsteroidal Anti-Inflammatory Drugs Sales (K MT), Revenue (M USD), Price (USD/MT) and Gross Margin (2019-2025)
Table 102. Glenmark Pharmaceuticals Inc Business Overview
Table 103. Glenmark Pharmaceuticals Inc Recent Developments
Table 104. Amneal Pharmaceuticals Oral Nonsteroidal Anti-Inflammatory Drugs Basic Information
Table 105. Amneal Pharmaceuticals Oral Nonsteroidal Anti-Inflammatory Drugs Product Overview
Table 106. Amneal Pharmaceuticals Oral Nonsteroidal Anti-Inflammatory Drugs Sales (K MT), Revenue (M USD), Price (USD/MT) and Gross Margin (2019-2025)
Table 107. Amneal Pharmaceuticals Business Overview
Table 108. Amneal Pharmaceuticals Recent Developments
Table 109. AstraZeneca Oral Nonsteroidal Anti-Inflammatory Drugs Basic Information
Table 110. AstraZeneca Oral Nonsteroidal Anti-Inflammatory Drugs Product Overview
Table 111. AstraZeneca Oral Nonsteroidal Anti-Inflammatory Drugs Sales (K MT), Revenue (M USD), Price (USD/MT) and Gross Margin (2019-2025)
Table 112. AstraZeneca Business Overview
Table 113. AstraZeneca Recent Developments
Table 114. Johnson and Johnson Oral Nonsteroidal Anti-Inflammatory Drugs Basic Information
Table 115. Johnson and Johnson Oral Nonsteroidal Anti-Inflammatory Drugs Product Overview
Table 116. Johnson and Johnson Oral Nonsteroidal Anti-Inflammatory Drugs Sales (K MT), Revenue (M USD), Price (USD/MT) and Gross Margin (2019-2025)
Table 117. Johnson and Johnson Business Overview
Table 118. Johnson and Johnson Recent Developments
Table 119. Global Oral Nonsteroidal Anti-Inflammatory Drugs Sales Forecast by Region (2025-2032) & (K MT)
Table 120. Global Oral Nonsteroidal Anti-Inflammatory Drugs Market Size Forecast by Region (2025-2032) & (M USD)
Table 121. North America Oral Nonsteroidal Anti-Inflammatory Drugs Sales Forecast by Country (2025-2032) & (K MT)
Table 122. North America Oral Nonsteroidal Anti-Inflammatory Drugs Market Size Forecast by Country (2025-2032) & (M USD)
Table 123. Europe Oral Nonsteroidal Anti-Inflammatory Drugs Sales Forecast by Country (2025-2032) & (K MT)
Table 124. Europe Oral Nonsteroidal Anti-Inflammatory Drugs Market Size Forecast by Country (2025-2032) & (M USD)
Table 125. Asia Pacific Oral Nonsteroidal Anti-Inflammatory Drugs Sales Forecast by Region (2025-2032) & (K MT)
Table 126. Asia Pacific Oral Nonsteroidal Anti-Inflammatory Drugs Market Size Forecast by Region (2025-2032) & (M USD)
Table 127. South America Oral Nonsteroidal Anti-Inflammatory Drugs Sales Forecast by Country (2025-2032) & (K MT)
Table 128. South America Oral Nonsteroidal Anti-Inflammatory Drugs Market Size Forecast by Country (2025-2032) & (M USD)
Table 129. Middle East and Africa Oral Nonsteroidal Anti-Inflammatory Drugs Consumption Forecast by Country (2025-2032) & (Units)
Table 130. Middle East and Africa Oral Nonsteroidal Anti-Inflammatory Drugs Market Size Forecast by Country (2025-2032) & (M USD)
Table 131. Global Oral Nonsteroidal Anti-Inflammatory Drugs Sales Forecast by Type (2025-2032) & (K MT)
Table 132. Global Oral Nonsteroidal Anti-Inflammatory Drugs Market Size Forecast by Type (2025-2032) & (M USD)
Table 133. Global Oral Nonsteroidal Anti-Inflammatory Drugs Price Forecast by Type (2025-2032) & (USD/MT)
Table 134. Global Oral Nonsteroidal Anti-Inflammatory Drugs Sales (K MT) Forecast by Application (2025-2032)
Table 135. Global Oral Nonsteroidal Anti-Inflammatory Drugs Market Size Forecast by Application (2025-2032) & (M USD)
List of Figures
Figure 1. Product Picture of Oral Nonsteroidal Anti-Inflammatory Drugs
Figure 2. Data Triangulation
Figure 3. Key Caveats
Figure 4. Global Oral Nonsteroidal Anti-Inflammatory Drugs Market Size (M USD), 2019-2032
Figure 5. Global Oral Nonsteroidal Anti-Inflammatory Drugs Market Size (M USD) (2019-2032)
Figure 6. Global Oral Nonsteroidal Anti-Inflammatory Drugs Sales (K MT) & (2019-2032)
Figure 7. Evaluation Matrix of Segment Market Development Potential (Type)
Figure 8. Evaluation Matrix of Segment Market Development Potential (Application)
Figure 9. Evaluation Matrix of Regional Market Development Potential
Figure 10. Oral Nonsteroidal Anti-Inflammatory Drugs Market Size by Country (M USD)
Figure 11. Oral Nonsteroidal Anti-Inflammatory Drugs Sales Share by Manufacturers in 2023
Figure 12. Global Oral Nonsteroidal Anti-Inflammatory Drugs Revenue Share by Manufacturers in 2023
Figure 13. Oral Nonsteroidal Anti-Inflammatory Drugs Market Share by Company Type (Tier 1, Tier 2 and Tier 3): 2023
Figure 14. Global Market Oral Nonsteroidal Anti-Inflammatory Drugs Average Price (USD/MT) of Key Manufacturers in 2023
Figure 15. The Global 5 and 10 Largest Players: Market Share by Oral Nonsteroidal Anti-Inflammatory Drugs Revenue in 2023
Figure 16. Evaluation Matrix of Segment Market Development Potential (Type)
Figure 17. Global Oral Nonsteroidal Anti-Inflammatory Drugs Market Share by Type
Figure 18. Sales Market Share of Oral Nonsteroidal Anti-Inflammatory Drugs by Type (2019-2025)
Figure 19. Sales Market Share of Oral Nonsteroidal Anti-Inflammatory Drugs by Type in 2023
Figure 20. Market Size Share of Oral Nonsteroidal Anti-Inflammatory Drugs by Type (2019-2025)
Figure 21. Market Size Market Share of Oral Nonsteroidal Anti-Inflammatory Drugs by Type in 2023
Figure 22. Evaluation Matrix of Segment Market Development Potential (Application)
Figure 23. Global Oral Nonsteroidal Anti-Inflammatory Drugs Market Share by Application
Figure 24. Global Oral Nonsteroidal Anti-Inflammatory Drugs Sales Market Share by Application (2019-2025)
Figure 25. Global Oral Nonsteroidal Anti-Inflammatory Drugs Sales Market Share by Application in 2023
Figure 26. Global Oral Nonsteroidal Anti-Inflammatory Drugs Market Share by Application (2019-2025)
Figure 27. Global Oral Nonsteroidal Anti-Inflammatory Drugs Market Share by Application in 2023
Figure 28. Global Oral Nonsteroidal Anti-Inflammatory Drugs Sales Growth Rate by Application (2019-2025)
Figure 29. Global Oral Nonsteroidal Anti-Inflammatory Drugs Sales Market Share by Region (2019-2025)
Figure 30. North America Oral Nonsteroidal Anti-Inflammatory Drugs Sales and Growth Rate (2019-2025) & (K MT)
Figure 31. North America Oral Nonsteroidal Anti-Inflammatory Drugs Sales Market Share by Country in 2023
Figure 32. U.S. Oral Nonsteroidal Anti-Inflammatory Drugs Sales and Growth Rate (2019-2025) & (K MT)
Figure 33. Canada Oral Nonsteroidal Anti-Inflammatory Drugs Sales (K MT) and Growth Rate (2019-2025)
Figure 34. Mexico Oral Nonsteroidal Anti-Inflammatory Drugs Sales (Units) and Growth Rate (2019-2025)
Figure 35. Europe Oral Nonsteroidal Anti-Inflammatory Drugs Sales and Growth Rate (2019-2025) & (K MT)
Figure 36. Europe Oral Nonsteroidal Anti-Inflammatory Drugs Sales Market Share by Country in 2023
Figure 37. Germany Oral Nonsteroidal Anti-Inflammatory Drugs Sales and Growth Rate (2019-2025) & (K MT)
Figure 38. France Oral Nonsteroidal Anti-Inflammatory Drugs Sales and Growth Rate (2019-2025) & (K MT)
Figure 39. U.K. Oral Nonsteroidal Anti-Inflammatory Drugs Sales and Growth Rate (2019-2025) & (K MT)
Figure 40. Italy Oral Nonsteroidal Anti-Inflammatory Drugs Sales and Growth Rate (2019-2025) & (K MT)
Figure 41. Russia Oral Nonsteroidal Anti-Inflammatory Drugs Sales and Growth Rate (2019-2025) & (K MT)
Figure 42. Asia Pacific Oral Nonsteroidal Anti-Inflammatory Drugs Sales and Growth Rate (K MT)
Figure 43. Asia Pacific Oral Nonsteroidal Anti-Inflammatory Drugs Sales Market Share by Region in 2023
Figure 44. China Oral Nonsteroidal Anti-Inflammatory Drugs Sales and Growth Rate (2019-2025) & (K MT)
Figure 45. Japan Oral Nonsteroidal Anti-Inflammatory Drugs Sales and Growth Rate (2019-2025) & (K MT)
Figure 46. South Korea Oral Nonsteroidal Anti-Inflammatory Drugs Sales and Growth Rate (2019-2025) & (K MT)
Figure 47. India Oral Nonsteroidal Anti-Inflammatory Drugs Sales and Growth Rate (2019-2025) & (K MT)
Figure 48. Southeast Asia Oral Nonsteroidal Anti-Inflammatory Drugs Sales and Growth Rate (2019-2025) & (K MT)
Figure 49. South America Oral Nonsteroidal Anti-Inflammatory Drugs Sales and Growth Rate (K MT)
Figure 50. South America Oral Nonsteroidal Anti-Inflammatory Drugs Sales Market Share by Country in 2023
Figure 51. Brazil Oral Nonsteroidal Anti-Inflammatory Drugs Sales and Growth Rate (2019-2025) & (K MT)
Figure 52. Argentina Oral Nonsteroidal Anti-Inflammatory Drugs Sales and Growth Rate (2019-2025) & (K MT)
Figure 53. Columbia Oral Nonsteroidal Anti-Inflammatory Drugs Sales and Growth Rate (2019-2025) & (K MT)
Figure 54. Middle East and Africa Oral Nonsteroidal Anti-Inflammatory Drugs Sales and Growth Rate (K MT)
Figure 55. Middle East and Africa Oral Nonsteroidal Anti-Inflammatory Drugs Sales Market Share by Region in 2023
Figure 56. Saudi Arabia Oral Nonsteroidal Anti-Inflammatory Drugs Sales and Growth Rate (2019-2025) & (K MT)
Figure 57. UAE Oral Nonsteroidal Anti-Inflammatory Drugs Sales and Growth Rate (2019-2025) & (K MT)
Figure 58. Egypt Oral Nonsteroidal Anti-Inflammatory Drugs Sales and Growth Rate (2019-2025) & (K MT)
Figure 59. Nigeria Oral Nonsteroidal Anti-Inflammatory Drugs Sales and Growth Rate (2019-2025) & (K MT)
Figure 60. South Africa Oral Nonsteroidal Anti-Inflammatory Drugs Sales and Growth Rate (2019-2025) & (K MT)
Figure 61. Global Oral Nonsteroidal Anti-Inflammatory Drugs Production Market Share by Region (2019-2025)
Figure 62. North America Oral Nonsteroidal Anti-Inflammatory Drugs Production (K MT) Growth Rate (2019-2025)
Figure 63. Europe Oral Nonsteroidal Anti-Inflammatory Drugs Production (K MT) Growth Rate (2019-2025)
Figure 64. Japan Oral Nonsteroidal Anti-Inflammatory Drugs Production (K MT) Growth Rate (2019-2025)
Figure 65. China Oral Nonsteroidal Anti-Inflammatory Drugs Production (K MT) Growth Rate (2019-2025)
Figure 66. Global Oral Nonsteroidal Anti-Inflammatory Drugs Sales Forecast by Volume (2019-2032) & (K MT)
Figure 67. Global Oral Nonsteroidal Anti-Inflammatory Drugs Market Size Forecast by Value (2019-2032) & (M USD)
Figure 68. Global Oral Nonsteroidal Anti-Inflammatory Drugs Sales Market Share Forecast by Type (2025-2032)
Figure 69. Global Oral Nonsteroidal Anti-Inflammatory Drugs Market Share Forecast by Type (2025-2032)
Figure 70. Global Oral Nonsteroidal Anti-Inflammatory Drugs Sales Forecast by Application (2025-2032)
Figure 71. Global Oral Nonsteroidal Anti-Inflammatory Drugs Market Share Forecast by Application (2025-2032)

