The global Pheromone Monitor market involves devices designed to monitor insect pheromone levels and detect pest activity in agricultural settings. These devices utilize pheromones, chemical signals emitted by insects, to lure and trap them, providing real-time data on pest populations. The key products in this market include various types of traps and monitoring systems that help farmers, pest control professionals, and researchers monitor pest activity, specifically targeting insects that impact crop yields.
Pheromone monitoring plays a significant role in integrated pest management (IPM) systems, which are designed to minimize the use of chemical pesticides and reduce environmental impact. By using pheromones to track pests, these devices offer a more eco-friendly and sustainable approach to pest control.
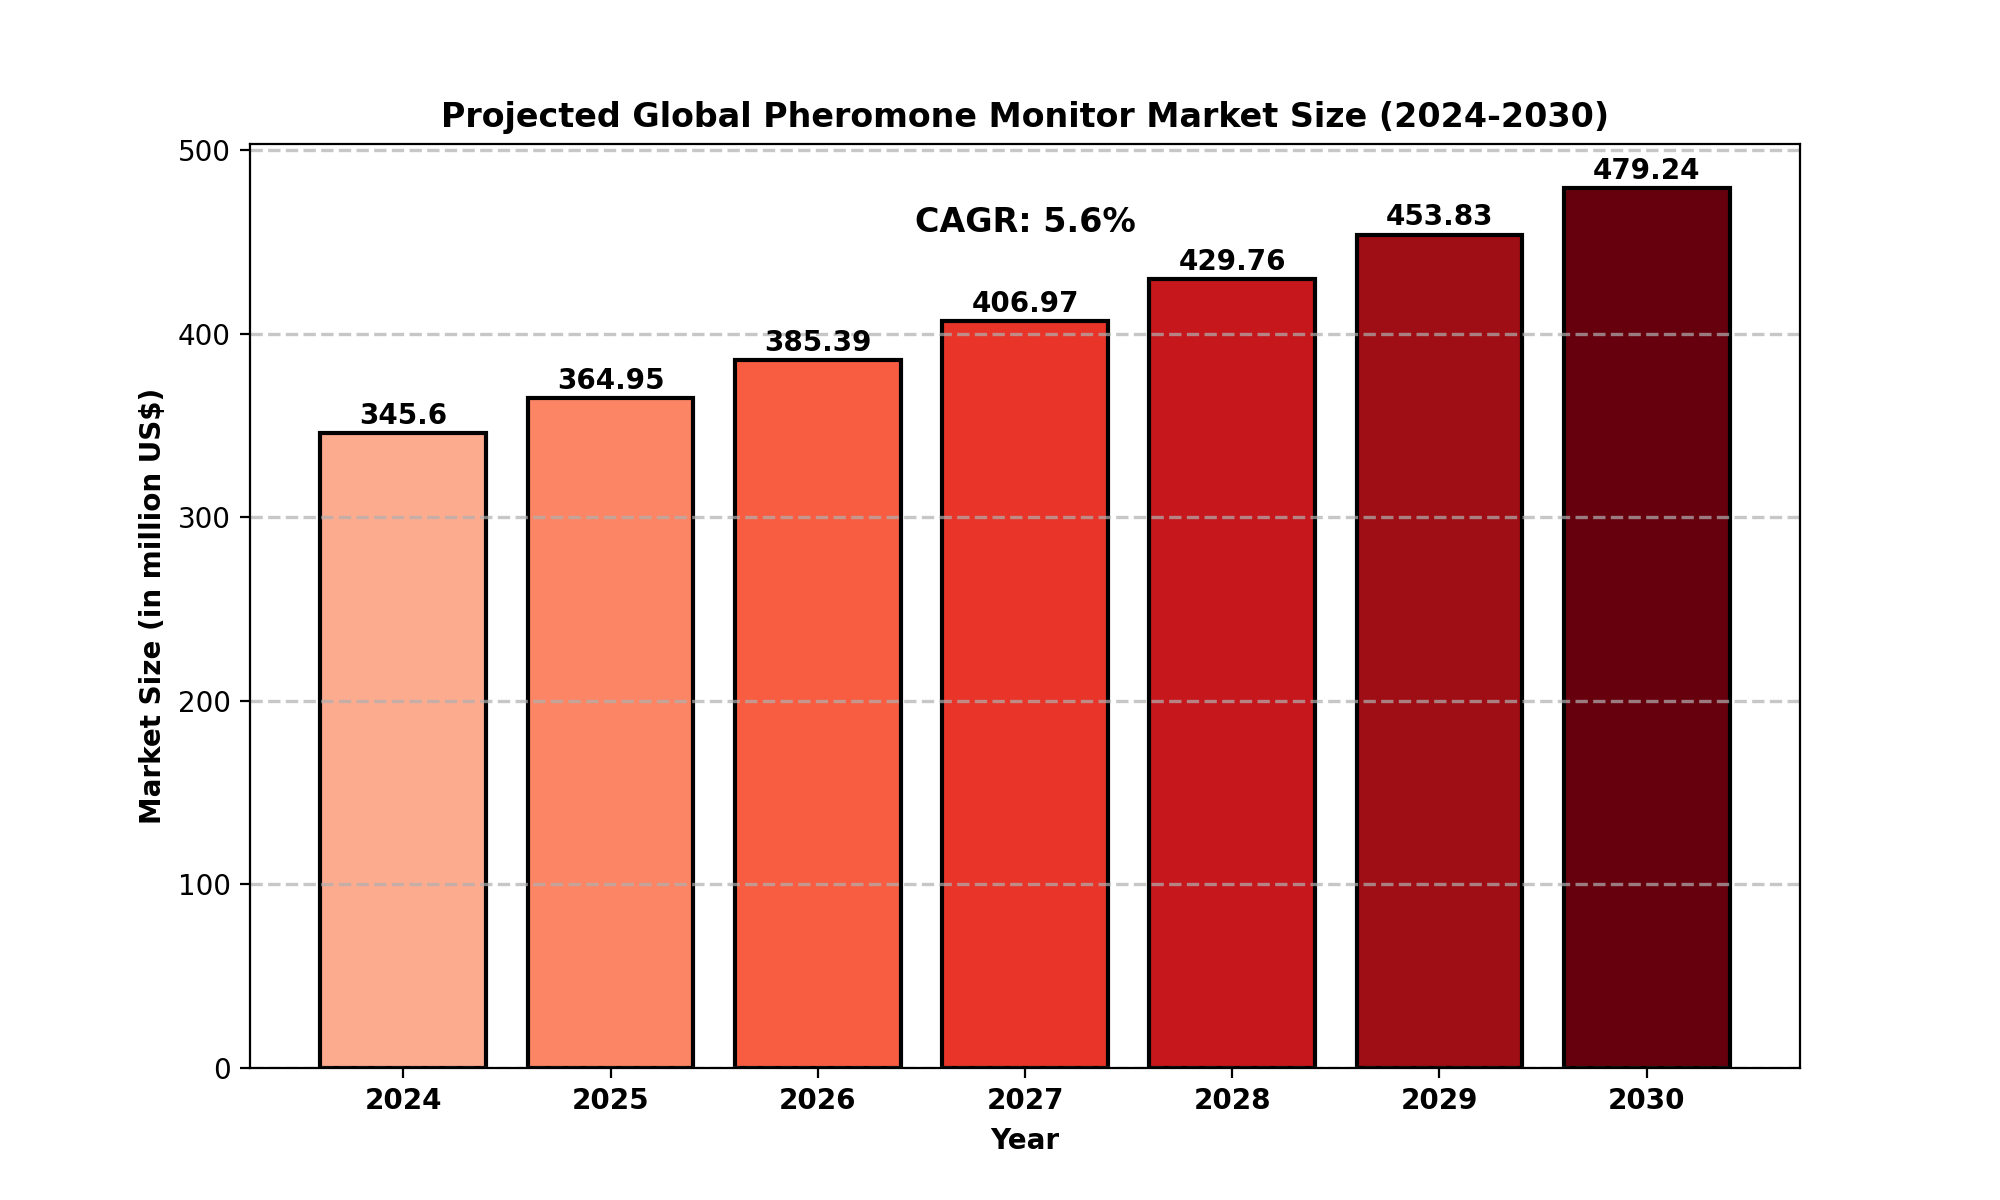
Market Size
The global Pheromone Monitor market was valued at USD 345.6 million in 2024 and is expected to grow significantly, with projections reaching USD 479.2 million by 2030, at a compound annual growth rate (CAGR) of 5.6% during the forecast period of 2024-2030. This growth is driven by the increasing adoption of integrated pest management (IPM) strategies, which prioritize sustainable and eco-friendly pest control methods.
The market is also experiencing a shift towards more accurate and efficient monitoring devices, which are essential in pest detection and management. With growing concerns over the environmental impact of chemical pesticides, pheromone monitors are becoming a preferred solution in many agricultural sectors worldwide.
Market Dynamics (Drivers, Restraints, Opportunities, and Challenges)
Drivers
-
Sustainability and Eco-Friendly Practices: The increasing demand for eco-friendly pest control methods is one of the primary drivers for the market. Pheromone monitors support integrated pest management (IPM), reducing reliance on chemical pesticides and contributing to sustainable agricultural practices.
-
Technological Advancements: Innovation in pheromone monitoring devices, such as enhanced accuracy, longer operational life, and more efficient designs, has driven market expansion.
-
Rising Global Agriculture Demand: As the global population grows, the demand for increased agricultural productivity intensifies. Farmers seek more effective ways to protect crops, driving the need for advanced pest detection and management systems.
Restraints
-
High Initial Investment: The upfront cost of implementing pheromone monitoring systems can be a barrier for smaller farmers, particularly in developing regions.
-
Technical Expertise: Proper installation and operation of pheromone monitors require a certain level of expertise, which may limit adoption in some regions.
-
Limited Awareness: In some parts of the world, particularly in developing countries, there is limited awareness about the benefits of pheromone monitoring, hindering market growth.
Opportunities
-
Expanding Agricultural Markets: As emerging economies invest in modern agricultural technologies, the potential for pheromone monitor adoption increases.
-
Development of More Accurate and Cost-Effective Devices: Manufacturers have the opportunity to innovate and develop pheromone monitors that are not only more accurate but also more affordable, making them accessible to a wider range of agricultural producers.
-
Government Support and Regulations: Many governments worldwide are promoting sustainable agricultural practices, creating a favorable regulatory environment for the adoption of eco-friendly pest control methods.
Challenges
-
Pest Resistance: Over-reliance on pheromone-based monitoring can lead to resistance in certain pest species, potentially reducing the effectiveness of this method.
-
Environmental and Climate Factors: Adverse weather conditions can impact the performance of pheromone traps, which rely on specific environmental factors to function optimally.
Regional Analysis
North America
The United States dominates the North American Pheromone Monitor market, with a projected market size of USD 98.4 million in 2024, expected to reach USD 134.5 million by 2030. The region's advanced agricultural infrastructure, adoption of sustainable farming practices, and government support for eco-friendly pest control solutions contribute to the growth of the market.
Europe
Europe is another key market for pheromone monitors, with significant demand driven by the agricultural sector in countries like Germany, the UK, and France. The region's emphasis on sustainable agricultural practices and reducing chemical pesticide use supports market expansion.
Asia-Pacific
The Asia-Pacific region, especially China and India, represents a rapidly growing market due to the large agricultural sectors in these countries. Increasing awareness of integrated pest management techniques and rising agricultural productivity requirements are driving the adoption of pheromone monitoring systems.
South America
In South America, countries like Brazil and Argentina are expected to see growth in pheromone monitor usage, driven by their extensive agricultural production and increasing need for effective pest control solutions.
Middle East and Africa
The Middle East and Africa represent a smaller portion of the market, but as agricultural techniques advance in countries like Saudi Arabia and Egypt, demand for pest monitoring systems is on the rise.
Competitor Analysis
Key players in the global Pheromone Monitor market include:
These companies are engaged in research and development to improve pheromone-based pest control products. They focus on technological innovation, product expansion, and strategic partnerships to strengthen their positions in the market. Key strategies involve diversifying product offerings, entering emerging markets, and offering customized solutions for different agricultural sectors.
Global Pheromone Monitor: Market Segmentation Analysis
This report provides a deep insight into the global Pheromone Monitor market, covering all its essential aspects. This ranges from a macro overview of the market to micro details of the market size, competitive landscape, development trends, niche market, key market drivers, and challenges, SWOT analysis, value chain analysis, etc.
The analysis helps the reader to shape the competition within the industries and strategies for the competitive environment to enhance the potential profit. Furthermore, it provides a simple framework for evaluating and assessing the position of the business organization. The report structure also focuses on the competitive landscape of the Global Pheromone Monitor Market, this report introduces in detail the market share, market performance, product situation, operation situation, etc., of the main players, which helps the readers in the industry to identify the main competitors and deeply understand the competition pattern of the market.
In a word, this report is a must-read for industry players, investors, researchers, consultants, business strategists, and all those who have any kind of stake or are planning to foray into the Pheromone Monitor market in any manner.
Market Segmentation (by Application)
-
Fruits and Vegetables
-
Field Crops
Market Segmentation (by Type)
-
Bottle Trap
-
Funnel Trap
-
Delta Trap
-
Others
Key Company
Geographic Segmentation
-
North America (USA, Canada, Mexico)
-
Europe (Germany, UK, France, Russia, Italy, Rest of Europe)
-
Asia-Pacific (China, Japan, South Korea, India, Southeast Asia, Rest of Asia-Pacific)
-
South America (Brazil, Argentina, Columbia, Rest of South America)
-
The Middle East and Africa (Saudi Arabia, UAE, Egypt, Nigeria, South Africa, Rest of MEA)
FAQ Section
What is the current market size of the Pheromone Monitor market?
- The global Pheromone Monitor market is valued at USD 345.6 million in 2024, with projections to reach USD 478.9 million by 2030, growing at a CAGR of 5.6%.
Which are the key companies operating in the Pheromone Monitor market?
- Key companies include Shin-Etsu, BASF, Suterra, Biobest Group, Isagro, Bedoukian Research, Hercon Environmental, and others.
What are the key growth drivers in the Pheromone Monitor market?
- Key drivers include the demand for sustainable agricultural practices, advancements in pheromone monitoring technologies, and rising global agricultural demands.
Which regions dominate the Pheromone Monitor market?
- North America, Europe, and Asia-Pacific are the dominant regions, with the United States, Germany, and China leading the market.
What are the emerging trends in the Pheromone Monitor market?
- Emerging trends include technological innovations in pest detection accuracy, the adoption of eco-friendly pest management methods, and increased government support for sustainable agriculture practices.
Key Benefits of This Market Research:
- Industry drivers, restraints, and opportunities covered in the study
- Neutral perspective on the market performance
- Recent industry trends and developments
- Competitive landscape & strategies of key players
- Potential & niche segments and regions exhibiting promising growth covered
- Historical, current, and projected market size, in terms of value
- In-depth analysis of the Pheromone Monitor Market
- Overview of the regional outlook of the Pheromone Monitor Market:
Key Reasons to Buy this Report:
- Access to date statistics compiled by our researchers. These provide you with historical and forecast data, which is analyzed to tell you why your market is set to change
- This enables you to anticipate market changes to remain ahead of your competitors
- You will be able to copy data from the Excel spreadsheet straight into your marketing plans, business presentations, or other strategic documents
- The concise analysis, clear graph, and table format will enable you to pinpoint the information you require quickly
- Provision of market value (USD Billion) data for each segment and sub-segment
- Indicates the region and segment that is expected to witness the fastest growth as well as to dominate the market
- Analysis by geography highlighting the consumption of the product/service in the region as well as indicating the factors that are affecting the market within each region
- Competitive landscape which incorporates the market ranking of the major players, along with new service/product launches, partnerships, business expansions, and acquisitions in the past five years of companies profiled
- Extensive company profiles comprising of company overview, company insights, product benchmarking, and SWOT analysis for the major market players
- The current as well as the future market outlook of the industry concerning recent developments which involve growth opportunities and drivers as well as challenges and restraints of both emerging as well as developed regions
- Includes in-depth analysis of the market from various perspectives through Porter
TABLE OF CONTENTS
Table of Contents
1 Research Methodology and Statistical Scope
1.1 Market Definition and Statistical Scope of Pheromone Monitor
1.2 Key Market Segments
1.2.1 Pheromone Monitor Segment by Type
1.2.2 Pheromone Monitor Segment by Application
1.3 Methodology & Sources of Information
1.3.1 Research Methodology
1.3.2 Research Process
1.3.3 Market Breakdown and Data Triangulation
1.3.4 Base Year
1.3.5 Report Assumptions & Caveats
2 Pheromone Monitor Market Overview
2.1 Global Market Overview
2.1.1 Global Pheromone Monitor Market Size (M USD) Estimates and Forecasts (2019-2030)
2.1.2 Global Pheromone Monitor Sales Estimates and Forecasts (2019-2030)
2.2 Market Segment Executive Summary
2.3 Global Market Size by Region
3 Pheromone Monitor Market Competitive Landscape
3.1 Global Pheromone Monitor Sales by Manufacturers (2019-2024)
3.2 Global Pheromone Monitor Revenue Market Share by Manufacturers (2019-2024)
3.3 Pheromone Monitor Market Share by Company Type (Tier 1, Tier 2, and Tier 3)
3.4 Global Pheromone Monitor Average Price by Manufacturers (2019-2024)
3.5 Manufacturers Pheromone Monitor Sales Sites, Area Served, Product Type
3.6 Pheromone Monitor Market Competitive Situation and Trends
3.6.1 Pheromone Monitor Market Concentration Rate
3.6.2 Global 5 and 10 Largest Pheromone Monitor Players Market Share by Revenue
3.6.3 Mergers & Acquisitions, Expansion
4 Pheromone Monitor Industry Chain Analysis
4.1 Pheromone Monitor Industry Chain Analysis
4.2 Market Overview of Key Raw Materials
4.3 Midstream Market Analysis
4.4 Downstream Customer Analysis
5 The Development and Dynamics of Pheromone Monitor Market
5.1 Key Development Trends
5.2 Driving Factors
5.3 Market Challenges
5.4 Market Restraints
5.5 Industry News
5.5.1 New Product Developments
5.5.2 Mergers & Acquisitions
5.5.3 Expansions
5.5.4 Collaboration/Supply Contracts
5.6 Industry Policies
6 Pheromone Monitor Market Segmentation by Type
6.1 Evaluation Matrix of Segment Market Development Potential (Type)
6.2 Global Pheromone Monitor Sales Market Share by Type (2019-2024)
6.3 Global Pheromone Monitor Market Size Market Share by Type (2019-2024)
6.4 Global Pheromone Monitor Price by Type (2019-2024)
7 Pheromone Monitor Market Segmentation by Application
7.1 Evaluation Matrix of Segment Market Development Potential (Application)
7.2 Global Pheromone Monitor Market Sales by Application (2019-2024)
7.3 Global Pheromone Monitor Market Size (M USD) by Application (2019-2024)
7.4 Global Pheromone Monitor Sales Growth Rate by Application (2019-2024)
8 Pheromone Monitor Market Segmentation by Region
8.1 Global Pheromone Monitor Sales by Region
8.1.1 Global Pheromone Monitor Sales by Region
8.1.2 Global Pheromone Monitor Sales Market Share by Region
8.2 North America
8.2.1 North America Pheromone Monitor Sales by Country
8.2.2 U.S.
8.2.3 Canada
8.2.4 Mexico
8.3 Europe
8.3.1 Europe Pheromone Monitor Sales by Country
8.3.2 Germany
8.3.3 France
8.3.4 U.K.
8.3.5 Italy
8.3.6 Russia
8.4 Asia Pacific
8.4.1 Asia Pacific Pheromone Monitor Sales by Region
8.4.2 China
8.4.3 Japan
8.4.4 South Korea
8.4.5 India
8.4.6 Southeast Asia
8.5 South America
8.5.1 South America Pheromone Monitor Sales by Country
8.5.2 Brazil
8.5.3 Argentina
8.5.4 Columbia
8.6 Middle East and Africa
8.6.1 Middle East and Africa Pheromone Monitor Sales by Region
8.6.2 Saudi Arabia
8.6.3 UAE
8.6.4 Egypt
8.6.5 Nigeria
8.6.6 South Africa
9 Key Companies Profile
9.1 Shin-Etsu
9.1.1 Shin-Etsu Pheromone Monitor Basic Information
9.1.2 Shin-Etsu Pheromone Monitor Product Overview
9.1.3 Shin-Etsu Pheromone Monitor Product Market Performance
9.1.4 Shin-Etsu Business Overview
9.1.5 Shin-Etsu Pheromone Monitor SWOT Analysis
9.1.6 Shin-Etsu Recent Developments
9.2 BASF
9.2.1 BASF Pheromone Monitor Basic Information
9.2.2 BASF Pheromone Monitor Product Overview
9.2.3 BASF Pheromone Monitor Product Market Performance
9.2.4 BASF Business Overview
9.2.5 BASF Pheromone Monitor SWOT Analysis
9.2.6 BASF Recent Developments
9.3 Suterra
9.3.1 Suterra Pheromone Monitor Basic Information
9.3.2 Suterra Pheromone Monitor Product Overview
9.3.3 Suterra Pheromone Monitor Product Market Performance
9.3.4 Suterra Pheromone Monitor SWOT Analysis
9.3.5 Suterra Business Overview
9.3.6 Suterra Recent Developments
9.4 Biobest Group
9.4.1 Biobest Group Pheromone Monitor Basic Information
9.4.2 Biobest Group Pheromone Monitor Product Overview
9.4.3 Biobest Group Pheromone Monitor Product Market Performance
9.4.4 Biobest Group Business Overview
9.4.5 Biobest Group Recent Developments
9.5 Isagro
9.5.1 Isagro Pheromone Monitor Basic Information
9.5.2 Isagro Pheromone Monitor Product Overview
9.5.3 Isagro Pheromone Monitor Product Market Performance
9.5.4 Isagro Business Overview
9.5.5 Isagro Recent Developments
9.6 Bedoukian Research
9.6.1 Bedoukian Research Pheromone Monitor Basic Information
9.6.2 Bedoukian Research Pheromone Monitor Product Overview
9.6.3 Bedoukian Research Pheromone Monitor Product Market Performance
9.6.4 Bedoukian Research Business Overview
9.6.5 Bedoukian Research Recent Developments
9.7 Hercon Environmental
9.7.1 Hercon Environmental Pheromone Monitor Basic Information
9.7.2 Hercon Environmental Pheromone Monitor Product Overview
9.7.3 Hercon Environmental Pheromone Monitor Product Market Performance
9.7.4 Hercon Environmental Business Overview
9.7.5 Hercon Environmental Recent Developments
9.8 Koppert Biological Systems
9.8.1 Koppert Biological Systems Pheromone Monitor Basic Information
9.8.2 Koppert Biological Systems Pheromone Monitor Product Overview
9.8.3 Koppert Biological Systems Pheromone Monitor Product Market Performance
9.8.4 Koppert Biological Systems Business Overview
9.8.5 Koppert Biological Systems Recent Developments
9.9 Pherobio Technology
9.9.1 Pherobio Technology Pheromone Monitor Basic Information
9.9.2 Pherobio Technology Pheromone Monitor Product Overview
9.9.3 Pherobio Technology Pheromone Monitor Product Market Performance
9.9.4 Pherobio Technology Business Overview
9.9.5 Pherobio Technology Recent Developments
9.10 Russell IPM
9.10.1 Russell IPM Pheromone Monitor Basic Information
9.10.2 Russell IPM Pheromone Monitor Product Overview
9.10.3 Russell IPM Pheromone Monitor Product Market Performance
9.10.4 Russell IPM Business Overview
9.10.5 Russell IPM Recent Developments
9.11 SEDQ Healthy Crops
9.11.1 SEDQ Healthy Crops Pheromone Monitor Basic Information
9.11.2 SEDQ Healthy Crops Pheromone Monitor Product Overview
9.11.3 SEDQ Healthy Crops Pheromone Monitor Product Market Performance
9.11.4 SEDQ Healthy Crops Business Overview
9.11.5 SEDQ Healthy Crops Recent Developments
9.12 Certis Europe
9.12.1 Certis Europe Pheromone Monitor Basic Information
9.12.2 Certis Europe Pheromone Monitor Product Overview
9.12.3 Certis Europe Pheromone Monitor Product Market Performance
9.12.4 Certis Europe Business Overview
9.12.5 Certis Europe Recent Developments
9.13 Agrobio
9.13.1 Agrobio Pheromone Monitor Basic Information
9.13.2 Agrobio Pheromone Monitor Product Overview
9.13.3 Agrobio Pheromone Monitor Product Market Performance
9.13.4 Agrobio Business Overview
9.13.5 Agrobio Recent Developments
9.14 Jiangsu Wanhe Daye
9.14.1 Jiangsu Wanhe Daye Pheromone Monitor Basic Information
9.14.2 Jiangsu Wanhe Daye Pheromone Monitor Product Overview
9.14.3 Jiangsu Wanhe Daye Pheromone Monitor Product Market Performance
9.14.4 Jiangsu Wanhe Daye Business Overview
9.14.5 Jiangsu Wanhe Daye Recent Developments
9.15 ISCA
9.15.1 ISCA Pheromone Monitor Basic Information
9.15.2 ISCA Pheromone Monitor Product Overview
9.15.3 ISCA Pheromone Monitor Product Market Performance
9.15.4 ISCA Business Overview
9.15.5 ISCA Recent Developments
9.16 Scentry Biologicals
9.16.1 Scentry Biologicals Pheromone Monitor Basic Information
9.16.2 Scentry Biologicals Pheromone Monitor Product Overview
9.16.3 Scentry Biologicals Pheromone Monitor Product Market Performance
9.16.4 Scentry Biologicals Business Overview
9.16.5 Scentry Biologicals Recent Developments
10 Pheromone Monitor Market Forecast by Region
10.1 Global Pheromone Monitor Market Size Forecast
10.2 Global Pheromone Monitor Market Forecast by Region
10.2.1 North America Market Size Forecast by Country
10.2.2 Europe Pheromone Monitor Market Size Forecast by Country
10.2.3 Asia Pacific Pheromone Monitor Market Size Forecast by Region
10.2.4 South America Pheromone Monitor Market Size Forecast by Country
10.2.5 Middle East and Africa Forecasted Consumption of Pheromone Monitor by Country
11 Forecast Market by Type and by Application (2025-2030)
11.1 Global Pheromone Monitor Market Forecast by Type (2025-2030)
11.1.1 Global Forecasted Sales of Pheromone Monitor by Type (2025-2030)
11.1.2 Global Pheromone Monitor Market Size Forecast by Type (2025-2030)
11.1.3 Global Forecasted Price of Pheromone Monitor by Type (2025-2030)
11.2 Global Pheromone Monitor Market Forecast by Application (2025-2030)
11.2.1 Global Pheromone Monitor Sales (Kilotons) Forecast by Application
11.2.2 Global Pheromone Monitor Market Size (M USD) Forecast by Application (2025-2030)
12 Conclusion and Key Findings
LIST OF TABLES & FIGURES
List of Tables
Table 1. Introduction of the Type
Table 2. Introduction of the Application
Table 3. Market Size (M USD) Segment Executive Summary
Table 4. Pheromone Monitor Market Size Comparison by Region (M USD)
Table 5. Global Pheromone Monitor Sales (Kilotons) by Manufacturers (2019-2024)
Table 6. Global Pheromone Monitor Sales Market Share by Manufacturers (2019-2024)
Table 7. Global Pheromone Monitor Revenue (M USD) by Manufacturers (2019-2024)
Table 8. Global Pheromone Monitor Revenue Share by Manufacturers (2019-2024)
Table 9. Company Type (Tier 1, Tier 2, and Tier 3) & (based on the Revenue in Pheromone Monitor as of 2022)
Table 10. Global Market Pheromone Monitor Average Price (USD/Ton) of Key Manufacturers (2019-2024)
Table 11. Manufacturers Pheromone Monitor Sales Sites and Area Served
Table 12. Manufacturers Pheromone Monitor Product Type
Table 13. Global Pheromone Monitor Manufacturers Market Concentration Ratio (CR5 and HHI)
Table 14. Mergers & Acquisitions, Expansion Plans
Table 15. Industry Chain Map of Pheromone Monitor
Table 16. Market Overview of Key Raw Materials
Table 17. Midstream Market Analysis
Table 18. Downstream Customer Analysis
Table 19. Key Development Trends
Table 20. Driving Factors
Table 21. Pheromone Monitor Market Challenges
Table 22. Global Pheromone Monitor Sales by Type (Kilotons)
Table 23. Global Pheromone Monitor Market Size by Type (M USD)
Table 24. Global Pheromone Monitor Sales (Kilotons) by Type (2019-2024)
Table 25. Global Pheromone Monitor Sales Market Share by Type (2019-2024)
Table 26. Global Pheromone Monitor Market Size (M USD) by Type (2019-2024)
Table 27. Global Pheromone Monitor Market Size Share by Type (2019-2024)
Table 28. Global Pheromone Monitor Price (USD/Ton) by Type (2019-2024)
Table 29. Global Pheromone Monitor Sales (Kilotons) by Application
Table 30. Global Pheromone Monitor Market Size by Application
Table 31. Global Pheromone Monitor Sales by Application (2019-2024) & (Kilotons)
Table 32. Global Pheromone Monitor Sales Market Share by Application (2019-2024)
Table 33. Global Pheromone Monitor Sales by Application (2019-2024) & (M USD)
Table 34. Global Pheromone Monitor Market Share by Application (2019-2024)
Table 35. Global Pheromone Monitor Sales Growth Rate by Application (2019-2024)
Table 36. Global Pheromone Monitor Sales by Region (2019-2024) & (Kilotons)
Table 37. Global Pheromone Monitor Sales Market Share by Region (2019-2024)
Table 38. North America Pheromone Monitor Sales by Country (2019-2024) & (Kilotons)
Table 39. Europe Pheromone Monitor Sales by Country (2019-2024) & (Kilotons)
Table 40. Asia Pacific Pheromone Monitor Sales by Region (2019-2024) & (Kilotons)
Table 41. South America Pheromone Monitor Sales by Country (2019-2024) & (Kilotons)
Table 42. Middle East and Africa Pheromone Monitor Sales by Region (2019-2024) & (Kilotons)
Table 43. Shin-Etsu Pheromone Monitor Basic Information
Table 44. Shin-Etsu Pheromone Monitor Product Overview
Table 45. Shin-Etsu Pheromone Monitor Sales (Kilotons), Revenue (M USD), Price (USD/Ton) and Gross Margin (2019-2024)
Table 46. Shin-Etsu Business Overview
Table 47. Shin-Etsu Pheromone Monitor SWOT Analysis
Table 48. Shin-Etsu Recent Developments
Table 49. BASF Pheromone Monitor Basic Information
Table 50. BASF Pheromone Monitor Product Overview
Table 51. BASF Pheromone Monitor Sales (Kilotons), Revenue (M USD), Price (USD/Ton) and Gross Margin (2019-2024)
Table 52. BASF Business Overview
Table 53. BASF Pheromone Monitor SWOT Analysis
Table 54. BASF Recent Developments
Table 55. Suterra Pheromone Monitor Basic Information
Table 56. Suterra Pheromone Monitor Product Overview
Table 57. Suterra Pheromone Monitor Sales (Kilotons), Revenue (M USD), Price (USD/Ton) and Gross Margin (2019-2024)
Table 58. Suterra Pheromone Monitor SWOT Analysis
Table 59. Suterra Business Overview
Table 60. Suterra Recent Developments
Table 61. Biobest Group Pheromone Monitor Basic Information
Table 62. Biobest Group Pheromone Monitor Product Overview
Table 63. Biobest Group Pheromone Monitor Sales (Kilotons), Revenue (M USD), Price (USD/Ton) and Gross Margin (2019-2024)
Table 64. Biobest Group Business Overview
Table 65. Biobest Group Recent Developments
Table 66. Isagro Pheromone Monitor Basic Information
Table 67. Isagro Pheromone Monitor Product Overview
Table 68. Isagro Pheromone Monitor Sales (Kilotons), Revenue (M USD), Price (USD/Ton) and Gross Margin (2019-2024)
Table 69. Isagro Business Overview
Table 70. Isagro Recent Developments
Table 71. Bedoukian Research Pheromone Monitor Basic Information
Table 72. Bedoukian Research Pheromone Monitor Product Overview
Table 73. Bedoukian Research Pheromone Monitor Sales (Kilotons), Revenue (M USD), Price (USD/Ton) and Gross Margin (2019-2024)
Table 74. Bedoukian Research Business Overview
Table 75. Bedoukian Research Recent Developments
Table 76. Hercon Environmental Pheromone Monitor Basic Information
Table 77. Hercon Environmental Pheromone Monitor Product Overview
Table 78. Hercon Environmental Pheromone Monitor Sales (Kilotons), Revenue (M USD), Price (USD/Ton) and Gross Margin (2019-2024)
Table 79. Hercon Environmental Business Overview
Table 80. Hercon Environmental Recent Developments
Table 81. Koppert Biological Systems Pheromone Monitor Basic Information
Table 82. Koppert Biological Systems Pheromone Monitor Product Overview
Table 83. Koppert Biological Systems Pheromone Monitor Sales (Kilotons), Revenue (M USD), Price (USD/Ton) and Gross Margin (2019-2024)
Table 84. Koppert Biological Systems Business Overview
Table 85. Koppert Biological Systems Recent Developments
Table 86. Pherobio Technology Pheromone Monitor Basic Information
Table 87. Pherobio Technology Pheromone Monitor Product Overview
Table 88. Pherobio Technology Pheromone Monitor Sales (Kilotons), Revenue (M USD), Price (USD/Ton) and Gross Margin (2019-2024)
Table 89. Pherobio Technology Business Overview
Table 90. Pherobio Technology Recent Developments
Table 91. Russell IPM Pheromone Monitor Basic Information
Table 92. Russell IPM Pheromone Monitor Product Overview
Table 93. Russell IPM Pheromone Monitor Sales (Kilotons), Revenue (M USD), Price (USD/Ton) and Gross Margin (2019-2024)
Table 94. Russell IPM Business Overview
Table 95. Russell IPM Recent Developments
Table 96. SEDQ Healthy Crops Pheromone Monitor Basic Information
Table 97. SEDQ Healthy Crops Pheromone Monitor Product Overview
Table 98. SEDQ Healthy Crops Pheromone Monitor Sales (Kilotons), Revenue (M USD), Price (USD/Ton) and Gross Margin (2019-2024)
Table 99. SEDQ Healthy Crops Business Overview
Table 100. SEDQ Healthy Crops Recent Developments
Table 101. Certis Europe Pheromone Monitor Basic Information
Table 102. Certis Europe Pheromone Monitor Product Overview
Table 103. Certis Europe Pheromone Monitor Sales (Kilotons), Revenue (M USD), Price (USD/Ton) and Gross Margin (2019-2024)
Table 104. Certis Europe Business Overview
Table 105. Certis Europe Recent Developments
Table 106. Agrobio Pheromone Monitor Basic Information
Table 107. Agrobio Pheromone Monitor Product Overview
Table 108. Agrobio Pheromone Monitor Sales (Kilotons), Revenue (M USD), Price (USD/Ton) and Gross Margin (2019-2024)
Table 109. Agrobio Business Overview
Table 110. Agrobio Recent Developments
Table 111. Jiangsu Wanhe Daye Pheromone Monitor Basic Information
Table 112. Jiangsu Wanhe Daye Pheromone Monitor Product Overview
Table 113. Jiangsu Wanhe Daye Pheromone Monitor Sales (Kilotons), Revenue (M USD), Price (USD/Ton) and Gross Margin (2019-2024)
Table 114. Jiangsu Wanhe Daye Business Overview
Table 115. Jiangsu Wanhe Daye Recent Developments
Table 116. ISCA Pheromone Monitor Basic Information
Table 117. ISCA Pheromone Monitor Product Overview
Table 118. ISCA Pheromone Monitor Sales (Kilotons), Revenue (M USD), Price (USD/Ton) and Gross Margin (2019-2024)
Table 119. ISCA Business Overview
Table 120. ISCA Recent Developments
Table 121. Scentry Biologicals Pheromone Monitor Basic Information
Table 122. Scentry Biologicals Pheromone Monitor Product Overview
Table 123. Scentry Biologicals Pheromone Monitor Sales (Kilotons), Revenue (M USD), Price (USD/Ton) and Gross Margin (2019-2024)
Table 124. Scentry Biologicals Business Overview
Table 125. Scentry Biologicals Recent Developments
Table 126. Global Pheromone Monitor Sales Forecast by Region (2025-2030) & (Kilotons)
Table 127. Global Pheromone Monitor Market Size Forecast by Region (2025-2030) & (M USD)
Table 128. North America Pheromone Monitor Sales Forecast by Country (2025-2030) & (Kilotons)
Table 129. North America Pheromone Monitor Market Size Forecast by Country (2025-2030) & (M USD)
Table 130. Europe Pheromone Monitor Sales Forecast by Country (2025-2030) & (Kilotons)
Table 131. Europe Pheromone Monitor Market Size Forecast by Country (2025-2030) & (M USD)
Table 132. Asia Pacific Pheromone Monitor Sales Forecast by Region (2025-2030) & (Kilotons)
Table 133. Asia Pacific Pheromone Monitor Market Size Forecast by Region (2025-2030) & (M USD)
Table 134. South America Pheromone Monitor Sales Forecast by Country (2025-2030) & (Kilotons)
Table 135. South America Pheromone Monitor Market Size Forecast by Country (2025-2030) & (M USD)
Table 136. Middle East and Africa Pheromone Monitor Consumption Forecast by Country (2025-2030) & (Units)
Table 137. Middle East and Africa Pheromone Monitor Market Size Forecast by Country (2025-2030) & (M USD)
Table 138. Global Pheromone Monitor Sales Forecast by Type (2025-2030) & (Kilotons)
Table 139. Global Pheromone Monitor Market Size Forecast by Type (2025-2030) & (M USD)
Table 140. Global Pheromone Monitor Price Forecast by Type (2025-2030) & (USD/Ton)
Table 141. Global Pheromone Monitor Sales (Kilotons) Forecast by Application (2025-2030)
Table 142. Global Pheromone Monitor Market Size Forecast by Application (2025-2030) & (M USD)
List of Figures
Figure 1. Product Picture of Pheromone Monitor
Figure 2. Data Triangulation
Figure 3. Key Caveats
Figure 4. Global Pheromone Monitor Market Size (M USD), 2019-2030
Figure 5. Global Pheromone Monitor Market Size (M USD) (2019-2030)
Figure 6. Global Pheromone Monitor Sales (Kilotons) & (2019-2030)
Figure 7. Evaluation Matrix of Segment Market Development Potential (Type)
Figure 8. Evaluation Matrix of Segment Market Development Potential (Application)
Figure 9. Evaluation Matrix of Regional Market Development Potential
Figure 10. Pheromone Monitor Market Size by Country (M USD)
Figure 11. Pheromone Monitor Sales Share by Manufacturers in 2023
Figure 12. Global Pheromone Monitor Revenue Share by Manufacturers in 2023
Figure 13. Pheromone Monitor Market Share by Company Type (Tier 1, Tier 2 and Tier 3): 2023
Figure 14. Global Market Pheromone Monitor Average Price (USD/Ton) of Key Manufacturers in 2023
Figure 15. The Global 5 and 10 Largest Players: Market Share by Pheromone Monitor Revenue in 2023
Figure 16. Evaluation Matrix of Segment Market Development Potential (Type)
Figure 17. Global Pheromone Monitor Market Share by Type
Figure 18. Sales Market Share of Pheromone Monitor by Type (2019-2024)
Figure 19. Sales Market Share of Pheromone Monitor by Type in 2023
Figure 20. Market Size Share of Pheromone Monitor by Type (2019-2024)
Figure 21. Market Size Market Share of Pheromone Monitor by Type in 2023
Figure 22. Evaluation Matrix of Segment Market Development Potential (Application)
Figure 23. Global Pheromone Monitor Market Share by Application
Figure 24. Global Pheromone Monitor Sales Market Share by Application (2019-2024)
Figure 25. Global Pheromone Monitor Sales Market Share by Application in 2023
Figure 26. Global Pheromone Monitor Market Share by Application (2019-2024)
Figure 27. Global Pheromone Monitor Market Share by Application in 2023
Figure 28. Global Pheromone Monitor Sales Growth Rate by Application (2019-2024)
Figure 29. Global Pheromone Monitor Sales Market Share by Region (2019-2024)
Figure 30. North America Pheromone Monitor Sales and Growth Rate (2019-2024) & (Kilotons)
Figure 31. North America Pheromone Monitor Sales Market Share by Country in 2023
Figure 32. U.S. Pheromone Monitor Sales and Growth Rate (2019-2024) & (Kilotons)
Figure 33. Canada Pheromone Monitor Sales (Kilotons) and Growth Rate (2019-2024)
Figure 34. Mexico Pheromone Monitor Sales (Units) and Growth Rate (2019-2024)
Figure 35. Europe Pheromone Monitor Sales and Growth Rate (2019-2024) & (Kilotons)
Figure 36. Europe Pheromone Monitor Sales Market Share by Country in 2023
Figure 37. Germany Pheromone Monitor Sales and Growth Rate (2019-2024) & (Kilotons)
Figure 38. France Pheromone Monitor Sales and Growth Rate (2019-2024) & (Kilotons)
Figure 39. U.K. Pheromone Monitor Sales and Growth Rate (2019-2024) & (Kilotons)
Figure 40. Italy Pheromone Monitor Sales and Growth Rate (2019-2024) & (Kilotons)
Figure 41. Russia Pheromone Monitor Sales and Growth Rate (2019-2024) & (Kilotons)
Figure 42. Asia Pacific Pheromone Monitor Sales and Growth Rate (Kilotons)
Figure 43. Asia Pacific Pheromone Monitor Sales Market Share by Region in 2023
Figure 44. China Pheromone Monitor Sales and Growth Rate (2019-2024) & (Kilotons)
Figure 45. Japan Pheromone Monitor Sales and Growth Rate (2019-2024) & (Kilotons)
Figure 46. South Korea Pheromone Monitor Sales and Growth Rate (2019-2024) & (Kilotons)
Figure 47. India Pheromone Monitor Sales and Growth Rate (2019-2024) & (Kilotons)
Figure 48. Southeast Asia Pheromone Monitor Sales and Growth Rate (2019-2024) & (Kilotons)
Figure 49. South America Pheromone Monitor Sales and Growth Rate (Kilotons)
Figure 50. South America Pheromone Monitor Sales Market Share by Country in 2023
Figure 51. Brazil Pheromone Monitor Sales and Growth Rate (2019-2024) & (Kilotons)
Figure 52. Argentina Pheromone Monitor Sales and Growth Rate (2019-2024) & (Kilotons)
Figure 53. Columbia Pheromone Monitor Sales and Growth Rate (2019-2024) & (Kilotons)
Figure 54. Middle East and Africa Pheromone Monitor Sales and Growth Rate (Kilotons)
Figure 55. Middle East and Africa Pheromone Monitor Sales Market Share by Region in 2023
Figure 56. Saudi Arabia Pheromone Monitor Sales and Growth Rate (2019-2024) & (Kilotons)
Figure 57. UAE Pheromone Monitor Sales and Growth Rate (2019-2024) & (Kilotons)
Figure 58. Egypt Pheromone Monitor Sales and Growth Rate (2019-2024) & (Kilotons)
Figure 59. Nigeria Pheromone Monitor Sales and Growth Rate (2019-2024) & (Kilotons)
Figure 60. South Africa Pheromone Monitor Sales and Growth Rate (2019-2024) & (Kilotons)
Figure 61. Global Pheromone Monitor Sales Forecast by Volume (2019-2030) & (Kilotons)
Figure 62. Global Pheromone Monitor Market Size Forecast by Value (2019-2030) & (M USD)
Figure 63. Global Pheromone Monitor Sales Market Share Forecast by Type (2025-2030)
Figure 64. Global Pheromone Monitor Market Share Forecast by Type (2025-2030)
Figure 65. Global Pheromone Monitor Sales Forecast by Application (2025-2030)
Figure 66. Global Pheromone Monitor Market Share Forecast by Application (2025-2030)
")
