The global Rumen Protected Mineral market revolves around products that are designed to improve the health and productivity of cattle by protecting essential minerals from the harsh rumen environment. The rumen, the first stomach compartment in cattle, can degrade certain minerals like zinc, copper, manganese, and selenium before they are absorbed in the small intestine. Therefore, these minerals are often provided in a protected form, known as Rumen Protected Minerals, which are designed to withstand the digestive process and release the minerals in the small intestine for better absorption. Cobalt is another key mineral that plays a vital role in rumen function and the production of vitamin B12.
These minerals are crucial for cattle health, supporting functions such as immunity, growth, reproduction, and overall productivity. By ensuring that essential trace minerals are absorbed more efficiently, Rumen Protected Minerals are a staple in livestock nutrition, especially in dairy and beef cattle production.
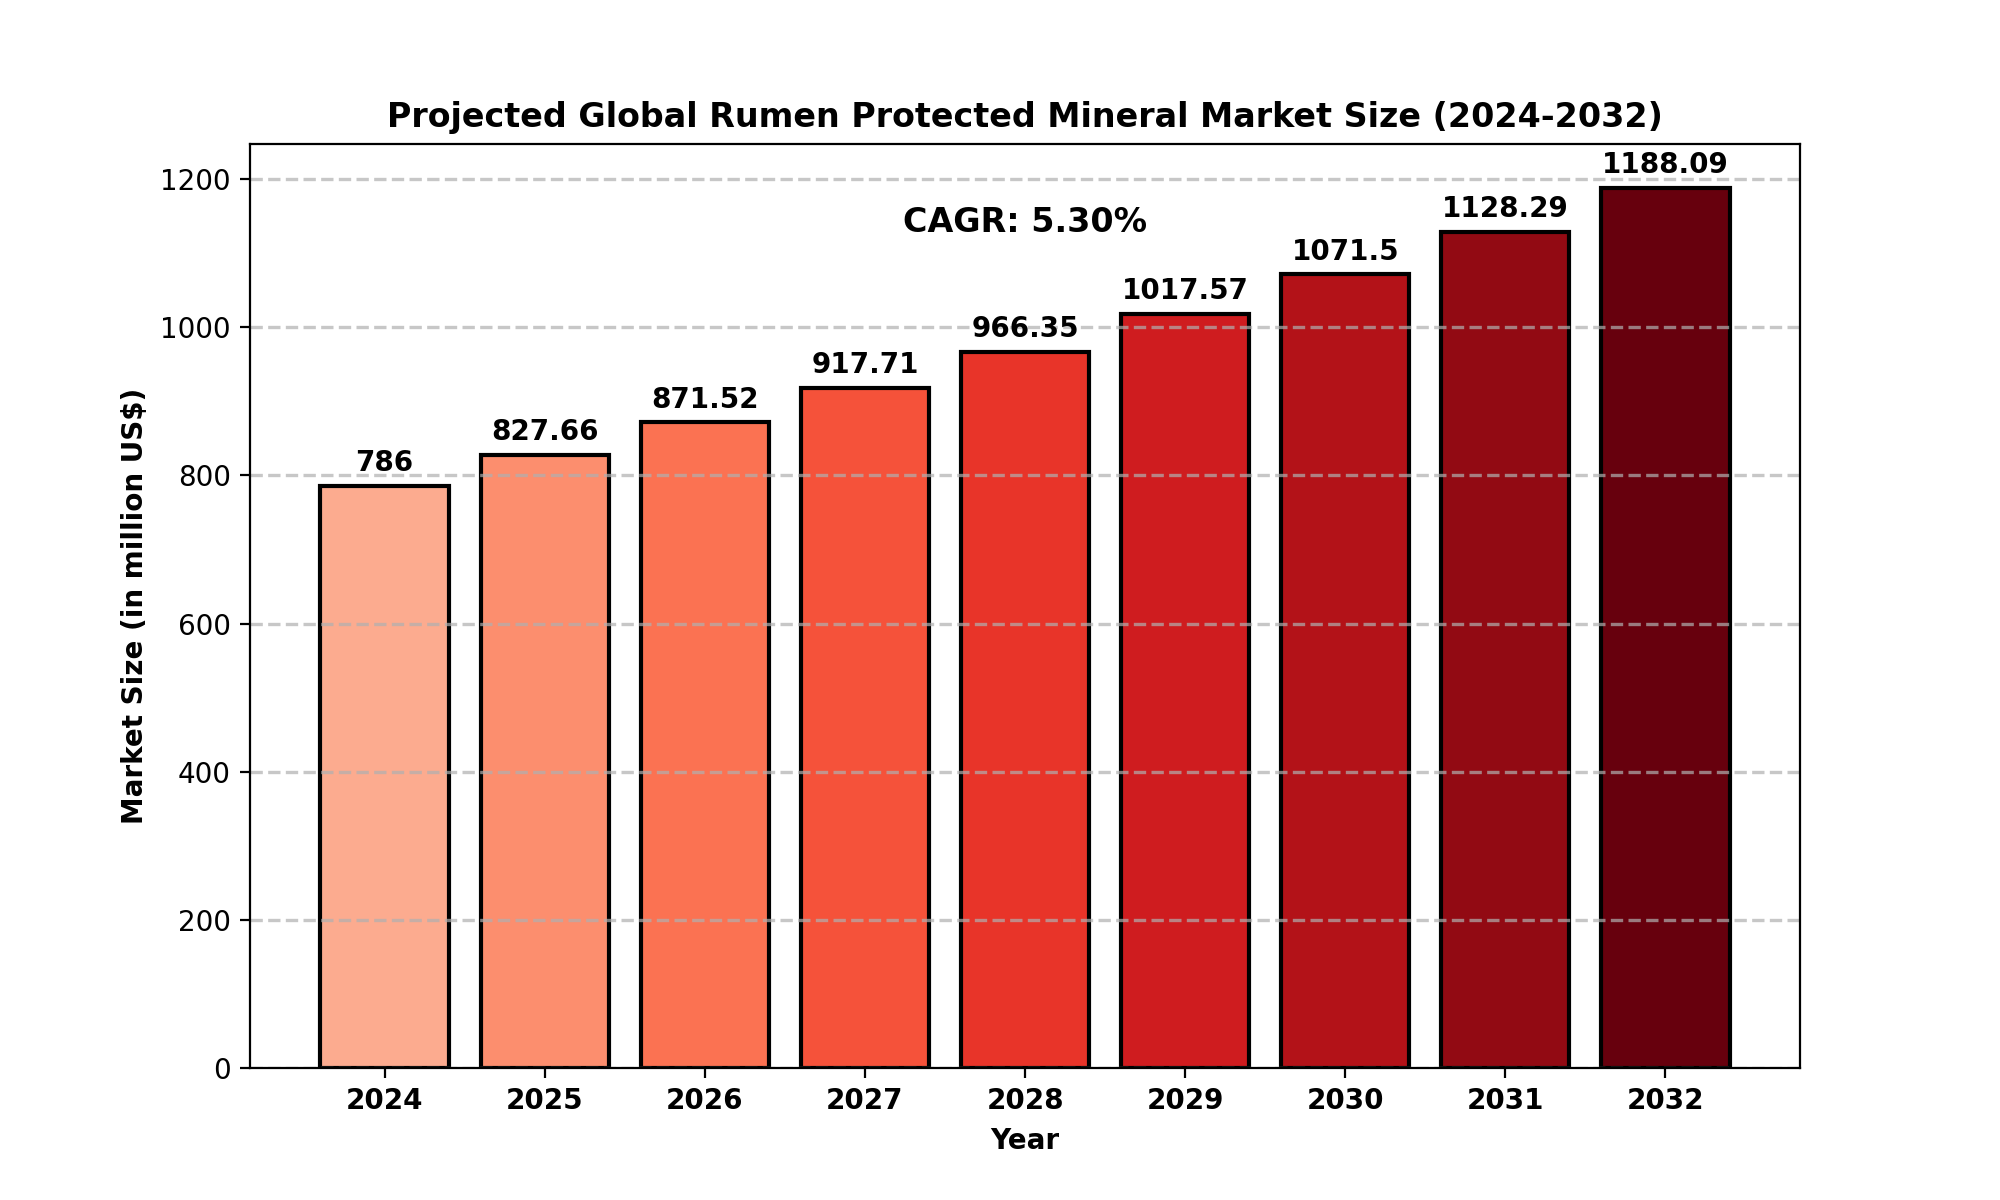
Market Size
The global Rumen Protected Mineral market was valued at USD 786 million in 2024 and is forecasted to grow significantly, reaching USD 1188.09 million by 2032, at a Compound Annual Growth Rate (CAGR) of 5.30% during the forecast period.
This growth reflects the increasing awareness of the benefits of Rumen Protected Minerals in enhancing cattle health and productivity, especially in regions with high livestock populations.
In North America, the Rumen Protected Mineral market was valued at USD 223.84 million in 2024, and is expected to grow at a CAGR of 4.54% through 2032.
This growth is fueled by increasing adoption of high-quality cattle feed additives and rising demand for beef and dairy products. As livestock owners and farmers continue to focus on improving cattle productivity and health, the need for effective mineral supplementation is becoming a key driver.
Market Dynamics (Drivers, Restraints, Opportunities, and Challenges)
Drivers
-
Increased Livestock Production: As the global demand for meat and dairy products rises, livestock production has been scaling up, leading to greater adoption of advanced nutritional solutions, including Rumen Protected Minerals. These minerals help optimize the health and productivity of cattle.
-
Improved Animal Health Awareness: Growing awareness about the importance of mineral supplementation in improving cattle health is driving market growth. Minerals play an essential role in strengthening immunity, enhancing growth, and ensuring reproductive success.
-
Advancements in Animal Feed Technology: The continuous development of feed additives, particularly those tailored for improved absorption in cattle, is enhancing the efficacy of Rumen Protected Minerals. These innovations ensure that nutrients are released at the optimal time for absorption.
Restraints
-
High Production Costs: The manufacturing of Rumen Protected Minerals requires advanced technologies and processes to ensure the minerals are shielded from the rumen environment. These specialized processes make the production cost higher compared to conventional minerals, posing a barrier for cost-sensitive farmers.
-
Regulatory Challenges: Different regions have varying regulations regarding the use of feed additives and minerals in livestock. Navigating these regulations and ensuring compliance can be a challenge for market players, especially in emerging markets.
Opportunities
-
Emerging Markets: The increasing demand for livestock production in emerging economies, particularly in Asia-Pacific, presents significant growth opportunities for the Rumen Protected Mineral market. As these regions modernize their agricultural practices, they offer untapped potential for market players.
-
Expanding Dairy and Beef Cattle Industry: With the rising global consumption of dairy and beef products, there is a growing need to enhance the quality of livestock production, which drives the demand for Rumen Protected Minerals in these sectors.
Challenges
-
Skepticism Among Farmers: Despite the proven benefits of Rumen Protected Minerals, some farmers remain skeptical about the return on investment. The need for proper education and awareness to demonstrate the long-term benefits of these products is a critical challenge.
-
Supply Chain Issues: The global supply chain for raw materials and production processes for these minerals can be disrupted by factors like geopolitical instability, natural disasters, or changes in trade policies, which could hamper the market growth.
Regional Analysis
The Rumen Protected Mineral market is experiencing growth across various regions, with significant demand in North America, Europe, and Asia-Pacific.
North America:
North America holds a prominent share in the Rumen Protected Mineral market. The U.S. and Canada have seen a steady increase in livestock production, particularly in dairy farming. The region's demand for high-quality livestock nutrition is anticipated to continue driving the market during the forecast period.
Europe:
Europe is another key market for Rumen Protected Minerals, driven by high livestock density and a growing focus on animal health. Countries like Germany, France, and the UK are leading the way, with advancements in livestock farming practices contributing to market growth.
Asia-Pacific:
Asia-Pacific is poised for significant growth in the Rumen Protected Mineral market. Countries like China, India, and Southeast Asia are investing in improving livestock productivity, making this region a major area for market expansion. The growing middle class in Asia is also contributing to higher meat and dairy consumption, which boosts the demand for cattle feed additives.
South America:
Brazil and Argentina are the key contributors to the Rumen Protected Mineral market in South America, with the region being known for large-scale cattle farming. The demand for these minerals in South America is on the rise as the agricultural sector modernizes.
Middle East and Africa:
The Middle East and Africa region shows potential for market growth as well. The rising need for animal health improvements in the region is increasing the demand for Rumen Protected Minerals, especially in countries like Saudi Arabia, UAE, and South Africa.
Competitor Analysis (in brief)
Key players in the Rumen Protected Mineral market include:
-
Novus International
-
Kemin
-
Provimi
-
Vitatrace Nutrition
-
Bewital Agri
-
Vetagro
-
Shiraishi Group
-
Maxx Performance
-
King Techina Group
-
Rio Nutrition
-
Feedworks
-
Specialist Nutrition
These companies are actively expanding their market presence through product innovations, strategic acquisitions, and partnerships. Their strategies focus on offering advanced, high-quality Rumen Protected Mineral solutions that cater to the growing demand for optimized livestock nutrition.
Global Rumen Protected Mineral Market: Market Segmentation Analysis
This report provides a deep insight into the global Rumen Protected Mineral market, covering all its essential aspects. This ranges from a macro overview of the market to micro details of the market size, competitive landscape, development trend, niche market, key market drivers and challenges, SWOT analysis, value chain analysis, etc.
The analysis helps the reader to shape the competition within the industries and strategies for the competitive environment to enhance the potential profit. Furthermore, it provides a simple framework for evaluating and assessing the position of the business organization. The report structure also focuses on the competitive landscape of the Global Rumen Protected Mineral Market. This report introduces in detail the market share, market performance, product situation, operation situation, etc., of the main players, which helps the readers in the industry to identify the main competitors and deeply understand the competition pattern of the market.
In a word, this report is a must-read for industry players, investors, researchers, consultants, business strategists, and all those who have any kind of stake or are planning to foray into the Rumen Protected Mineral market in any manner.
Market Segmentation (by Application)
-
Calf
-
Dairy Cattle
-
Beef Cattle
-
Others
Market Segmentation (by Type)
-
Single Mineral
-
Complex Mineral
Key Company
-
Novus International
-
Kemin
-
Provimi
-
Vitatrace Nutrition
-
Bewital Agri
-
Vetagro
-
Shiraishi Group
-
Maxx Performance
-
King Techina Group
-
Rio Nutrition
-
Feedworks
-
Specialist Nutrition
Geographic Segmentation
-
North America (USA, Canada, Mexico)
-
Europe (Germany, UK, France, Russia, Italy, Rest of Europe)
-
Asia-Pacific (China, Japan, South Korea, India, Southeast Asia, Rest of Asia-Pacific)
-
South America (Brazil, Argentina, Columbia, Rest of South America)
-
The Middle East and Africa (Saudi Arabia, UAE, Egypt, Nigeria, South Africa, Rest of MEA)
FAQ Section
1. What is the current market size of the Rumen Protected Mineral market?
- The global market size for Rumen Protected Minerals was estimated at USD 786 million in 2024 and is projected to reach USD 1251.06 million by 2032, with a CAGR of 5.30%.
2. Which are the key companies operating in the Rumen Protected Mineral market?
- Key players include Novus International, Kemin, Provimi, Vitatrace Nutrition, Bewital Agri, Vetagro, and others.
3. What are the key growth drivers in the Rumen Protected Mineral market?
- Drivers include increased livestock production, enhanced awareness of animal health, and advancements in feed technology.
4. Which regions dominate the Rumen Protected Mineral market?
- North America and Europe dominate the market, with Asia-Pacific expected to see significant growth in the coming years.
5. What are the emerging trends in the Rumen Protected Mineral market?
- Emerging trends include innovations in mineral protection technology, rising demand in emerging markets, and increased focus on improving livestock productivity.
Key Benefits of This Market Research:
- Industry drivers, restraints, and opportunities covered in the study
- Neutral perspective on the market performance
- Recent industry trends and developments
- Competitive landscape & strategies of key players
- Potential & niche segments and regions exhibiting promising growth covered
- Historical, current, and projected market size, in terms of value
- In-depth analysis of the Rumen Protected Mineral Market
- Overview of the regional outlook of the Rumen Protected Mineral Market:
Key Reasons to Buy this Report:
- Access to date statistics compiled by our researchers. These provide you with historical and forecast data, which is analyzed to tell you why your market is set to change
- This enables you to anticipate market changes to remain ahead of your competitors
- You will be able to copy data from the Excel spreadsheet straight into your marketing plans, business presentations, or other strategic documents
- The concise analysis, clear graph, and table format will enable you to pinpoint the information you require quickly
- Provision of market value data for each segment and sub-segment
- Indicates the region and segment that is expected to witness the fastest growth as well as to dominate the market
- Analysis by geography highlighting the consumption of the product/service in the region as well as indicating the factors that are affecting the market within each region
- Competitive landscape which incorporates the market ranking of the major players, along with new service/product launches, partnerships, business expansions, and acquisitions in the past five years of companies profiled
- Extensive company profiles comprising of company overview, company insights, product benchmarking, and SWOT analysis for the major market players
- The current as well as the future market outlook of the industry concerning recent developments which involve growth opportunities and drivers as well as challenges and restraints of both emerging as well as developed regions
- Includes in-depth analysis of the market from various perspectives through Porter
TABLE OF CONTENTS
Table of Contents
1 Research Methodology and Statistical Scope
1.1 Market Definition and Statistical Scope of Rumen Protected Mineral
1.2 Key Market Segments
1.2.1 Rumen Protected Mineral Segment by Type
1.2.2 Rumen Protected Mineral Segment by Application
1.3 Methodology & Sources of Information
1.3.1 Research Methodology
1.3.2 Research Process
1.3.3 Market Breakdown and Data Triangulation
1.3.4 Base Year
1.3.5 Report Assumptions & Caveats
2 Rumen Protected Mineral Market Overview
2.1 Global Market Overview
2.1.1 Global Rumen Protected Mineral Market Size (M USD) Estimates and Forecasts (2019-2032)
2.1.2 Global Rumen Protected Mineral Sales Estimates and Forecasts (2019-2032)
2.2 Market Segment Executive Summary
2.3 Global Market Size by Region
3 Rumen Protected Mineral Market Competitive Landscape
3.1 Global Rumen Protected Mineral Sales by Manufacturers (2019-2025)
3.2 Global Rumen Protected Mineral Revenue Market Share by Manufacturers (2019-2025)
3.3 Rumen Protected Mineral Market Share by Company Type (Tier 1, Tier 2, and Tier 3)
3.4 Global Rumen Protected Mineral Average Price by Manufacturers (2019-2025)
3.5 Manufacturers Rumen Protected Mineral Sales Sites, Area Served, Product Type
3.6 Rumen Protected Mineral Market Competitive Situation and Trends
3.6.1 Rumen Protected Mineral Market Concentration Rate
3.6.2 Global 5 and 10 Largest Rumen Protected Mineral Players Market Share by Revenue
3.6.3 Mergers & Acquisitions, Expansion
4 Rumen Protected Mineral Industry Chain Analysis
4.1 Rumen Protected Mineral Industry Chain Analysis
4.2 Market Overview of Key Raw Materials
4.3 Midstream Market Analysis
4.4 Downstream Customer Analysis
5 The Development and Dynamics of Rumen Protected Mineral Market
5.1 Key Development Trends
5.2 Driving Factors
5.3 Market Challenges
5.4 Market Restraints
5.5 Industry News
5.5.1 New Product Developments
5.5.2 Mergers & Acquisitions
5.5.3 Expansions
5.5.4 Collaboration/Supply Contracts
5.6 Industry Policies
6 Rumen Protected Mineral Market Segmentation by Type
6.1 Evaluation Matrix of Segment Market Development Potential (Type)
6.2 Global Rumen Protected Mineral Sales Market Share by Type (2019-2025)
6.3 Global Rumen Protected Mineral Market Size Market Share by Type (2019-2025)
6.4 Global Rumen Protected Mineral Price by Type (2019-2025)
7 Rumen Protected Mineral Market Segmentation by Application
7.1 Evaluation Matrix of Segment Market Development Potential (Application)
7.2 Global Rumen Protected Mineral Market Sales by Application (2019-2025)
7.3 Global Rumen Protected Mineral Market Size (M USD) by Application (2019-2025)
7.4 Global Rumen Protected Mineral Sales Growth Rate by Application (2019-2025)
8 Rumen Protected Mineral Market Consumption by Region
8.1 Global Rumen Protected Mineral Sales by Region
8.1.1 Global Rumen Protected Mineral Sales by Region
8.1.2 Global Rumen Protected Mineral Sales Market Share by Region
8.2 North America
8.2.1 North America Rumen Protected Mineral Sales by Country
8.2.2 U.S.
8.2.3 Canada
8.2.4 Mexico
8.3 Europe
8.3.1 Europe Rumen Protected Mineral Sales by Country
8.3.2 Germany
8.3.3 France
8.3.4 U.K.
8.3.5 Italy
8.3.6 Russia
8.4 Asia Pacific
8.4.1 Asia Pacific Rumen Protected Mineral Sales by Region
8.4.2 China
8.4.3 Japan
8.4.4 South Korea
8.4.5 India
8.4.6 Southeast Asia
8.5 South America
8.5.1 South America Rumen Protected Mineral Sales by Country
8.5.2 Brazil
8.5.3 Argentina
8.5.4 Columbia
8.6 Middle East and Africa
8.6.1 Middle East and Africa Rumen Protected Mineral Sales by Region
8.6.2 Saudi Arabia
8.6.3 UAE
8.6.4 Egypt
8.6.5 Nigeria
8.6.6 South Africa
9 Rumen Protected Mineral Market Production by Region
9.1 Global Production of Rumen Protected Mineral by Region (2019-2025)
9.2 Global Rumen Protected Mineral Revenue Market Share by Region (2019-2025)
9.3 Global Rumen Protected Mineral Production, Revenue, Price and Gross Margin (2019-2025)
9.4 North America Rumen Protected Mineral Production
9.4.1 North America Rumen Protected Mineral Production Growth Rate (2019-2025)
9.4.2 North America Rumen Protected Mineral Production, Revenue, Price and Gross Margin (2019-2025)
9.5 Europe Rumen Protected Mineral Production
9.5.1 Europe Rumen Protected Mineral Production Growth Rate (2019-2025)
9.5.2 Europe Rumen Protected Mineral Production, Revenue, Price and Gross Margin (2019-2025)
9.6 Japan Rumen Protected Mineral Production (2019-2025)
9.6.1 Japan Rumen Protected Mineral Production Growth Rate (2019-2025)
9.6.2 Japan Rumen Protected Mineral Production, Revenue, Price and Gross Margin (2019-2025)
9.7 China Rumen Protected Mineral Production (2019-2025)
9.7.1 China Rumen Protected Mineral Production Growth Rate (2019-2025)
9.7.2 China Rumen Protected Mineral Production, Revenue, Price and Gross Margin (2019-2025)
10 Key Companies Profile
10.1 Novus International
10.1.1 Novus International Rumen Protected Mineral Basic Information
10.1.2 Novus International Rumen Protected Mineral Product Overview
10.1.3 Novus International Rumen Protected Mineral Product Market Performance
10.1.4 Novus International Business Overview
10.1.5 Novus International Rumen Protected Mineral SWOT Analysis
10.1.6 Novus International Recent Developments
10.2 Kemin
10.2.1 Kemin Rumen Protected Mineral Basic Information
10.2.2 Kemin Rumen Protected Mineral Product Overview
10.2.3 Kemin Rumen Protected Mineral Product Market Performance
10.2.4 Kemin Business Overview
10.2.5 Kemin Rumen Protected Mineral SWOT Analysis
10.2.6 Kemin Recent Developments
10.3 Provimi
10.3.1 Provimi Rumen Protected Mineral Basic Information
10.3.2 Provimi Rumen Protected Mineral Product Overview
10.3.3 Provimi Rumen Protected Mineral Product Market Performance
10.3.4 Provimi Rumen Protected Mineral SWOT Analysis
10.3.5 Provimi Business Overview
10.3.6 Provimi Recent Developments
10.4 Vitatrace Nutrition
10.4.1 Vitatrace Nutrition Rumen Protected Mineral Basic Information
10.4.2 Vitatrace Nutrition Rumen Protected Mineral Product Overview
10.4.3 Vitatrace Nutrition Rumen Protected Mineral Product Market Performance
10.4.4 Vitatrace Nutrition Business Overview
10.4.5 Vitatrace Nutrition Recent Developments
10.5 Bewital Agri
10.5.1 Bewital Agri Rumen Protected Mineral Basic Information
10.5.2 Bewital Agri Rumen Protected Mineral Product Overview
10.5.3 Bewital Agri Rumen Protected Mineral Product Market Performance
10.5.4 Bewital Agri Business Overview
10.5.5 Bewital Agri Recent Developments
10.6 Vetagro
10.6.1 Vetagro Rumen Protected Mineral Basic Information
10.6.2 Vetagro Rumen Protected Mineral Product Overview
10.6.3 Vetagro Rumen Protected Mineral Product Market Performance
10.6.4 Vetagro Business Overview
10.6.5 Vetagro Recent Developments
10.7 Shiraishi Group
10.7.1 Shiraishi Group Rumen Protected Mineral Basic Information
10.7.2 Shiraishi Group Rumen Protected Mineral Product Overview
10.7.3 Shiraishi Group Rumen Protected Mineral Product Market Performance
10.7.4 Shiraishi Group Business Overview
10.7.5 Shiraishi Group Recent Developments
10.8 Maxx Performance
10.8.1 Maxx Performance Rumen Protected Mineral Basic Information
10.8.2 Maxx Performance Rumen Protected Mineral Product Overview
10.8.3 Maxx Performance Rumen Protected Mineral Product Market Performance
10.8.4 Maxx Performance Business Overview
10.8.5 Maxx Performance Recent Developments
10.9 King Techina Group
10.9.1 King Techina Group Rumen Protected Mineral Basic Information
10.9.2 King Techina Group Rumen Protected Mineral Product Overview
10.9.3 King Techina Group Rumen Protected Mineral Product Market Performance
10.9.4 King Techina Group Business Overview
10.9.5 King Techina Group Recent Developments
10.10 Rio Nutrition
10.10.1 Rio Nutrition Rumen Protected Mineral Basic Information
10.10.2 Rio Nutrition Rumen Protected Mineral Product Overview
10.10.3 Rio Nutrition Rumen Protected Mineral Product Market Performance
10.10.4 Rio Nutrition Business Overview
10.10.5 Rio Nutrition Recent Developments
10.11 Feedworks
10.11.1 Feedworks Rumen Protected Mineral Basic Information
10.11.2 Feedworks Rumen Protected Mineral Product Overview
10.11.3 Feedworks Rumen Protected Mineral Product Market Performance
10.11.4 Feedworks Business Overview
10.11.5 Feedworks Recent Developments
10.12 Specialist Nutrition
10.12.1 Specialist Nutrition Rumen Protected Mineral Basic Information
10.12.2 Specialist Nutrition Rumen Protected Mineral Product Overview
10.12.3 Specialist Nutrition Rumen Protected Mineral Product Market Performance
10.12.4 Specialist Nutrition Business Overview
10.12.5 Specialist Nutrition Recent Developments
11 Rumen Protected Mineral Market Forecast by Region
11.1 Global Rumen Protected Mineral Market Size Forecast
11.2 Global Rumen Protected Mineral Market Forecast by Region
11.2.1 North America Market Size Forecast by Country
11.2.2 Europe Rumen Protected Mineral Market Size Forecast by Country
11.2.3 Asia Pacific Rumen Protected Mineral Market Size Forecast by Region
11.2.4 South America Rumen Protected Mineral Market Size Forecast by Country
11.2.5 Middle East and Africa Forecasted Consumption of Rumen Protected Mineral by Country
12 Forecast Market by Type and by Application (2025-2032)
12.1 Global Rumen Protected Mineral Market Forecast by Type (2025-2032)
12.1.1 Global Forecasted Sales of Rumen Protected Mineral by Type (2025-2032)
12.1.2 Global Rumen Protected Mineral Market Size Forecast by Type (2025-2032)
12.1.3 Global Forecasted Price of Rumen Protected Mineral by Type (2025-2032)
12.2 Global Rumen Protected Mineral Market Forecast by Application (2025-2032)
12.2.1 Global Rumen Protected Mineral Sales (K MT) Forecast by Application
12.2.2 Global Rumen Protected Mineral Market Size (M USD) Forecast by Application (2025-2032)
13 Conclusion and Key Findings
LIST OF TABLES & FIGURES
List of Tables
Table 1. Introduction of the Type
Table 2. Introduction of the Application
Table 3. Market Size (M USD) Segment Executive Summary
Table 4. Rumen Protected Mineral Market Size Comparison by Region (M USD)
Table 5. Global Rumen Protected Mineral Sales (K MT) by Manufacturers (2019-2025)
Table 6. Global Rumen Protected Mineral Sales Market Share by Manufacturers (2019-2025)
Table 7. Global Rumen Protected Mineral Revenue (M USD) by Manufacturers (2019-2025)
Table 8. Global Rumen Protected Mineral Revenue Share by Manufacturers (2019-2025)
Table 9. Company Type (Tier 1, Tier 2, and Tier 3) & (based on the Revenue in Rumen Protected Mineral as of 2022)
Table 10. Global Market Rumen Protected Mineral Average Price (USD/MT) of Key Manufacturers (2019-2025)
Table 11. Manufacturers Rumen Protected Mineral Sales Sites and Area Served
Table 12. Manufacturers Rumen Protected Mineral Product Type
Table 13. Global Rumen Protected Mineral Manufacturers Market Concentration Ratio (CR5 and HHI)
Table 14. Mergers & Acquisitions, Expansion Plans
Table 15. Industry Chain Map of Rumen Protected Mineral
Table 16. Market Overview of Key Raw Materials
Table 17. Midstream Market Analysis
Table 18. Downstream Customer Analysis
Table 19. Key Development Trends
Table 20. Driving Factors
Table 21. Rumen Protected Mineral Market Challenges
Table 22. Global Rumen Protected Mineral Sales by Type (K MT)
Table 23. Global Rumen Protected Mineral Market Size by Type (M USD)
Table 24. Global Rumen Protected Mineral Sales (K MT) by Type (2019-2025)
Table 25. Global Rumen Protected Mineral Sales Market Share by Type (2019-2025)
Table 26. Global Rumen Protected Mineral Market Size (M USD) by Type (2019-2025)
Table 27. Global Rumen Protected Mineral Market Size Share by Type (2019-2025)
Table 28. Global Rumen Protected Mineral Price (USD/MT) by Type (2019-2025)
Table 29. Global Rumen Protected Mineral Sales (K MT) by Application
Table 30. Global Rumen Protected Mineral Market Size by Application
Table 31. Global Rumen Protected Mineral Sales by Application (2019-2025) & (K MT)
Table 32. Global Rumen Protected Mineral Sales Market Share by Application (2019-2025)
Table 33. Global Rumen Protected Mineral Sales by Application (2019-2025) & (M USD)
Table 34. Global Rumen Protected Mineral Market Share by Application (2019-2025)
Table 35. Global Rumen Protected Mineral Sales Growth Rate by Application (2019-2025)
Table 36. Global Rumen Protected Mineral Sales by Region (2019-2025) & (K MT)
Table 37. Global Rumen Protected Mineral Sales Market Share by Region (2019-2025)
Table 38. North America Rumen Protected Mineral Sales by Country (2019-2025) & (K MT)
Table 39. Europe Rumen Protected Mineral Sales by Country (2019-2025) & (K MT)
Table 40. Asia Pacific Rumen Protected Mineral Sales by Region (2019-2025) & (K MT)
Table 41. South America Rumen Protected Mineral Sales by Country (2019-2025) & (K MT)
Table 42. Middle East and Africa Rumen Protected Mineral Sales by Region (2019-2025) & (K MT)
Table 43. Global Rumen Protected Mineral Production (K MT) by Region (2019-2025)
Table 44. Global Rumen Protected Mineral Revenue (US$ Million) by Region (2019-2025)
Table 45. Global Rumen Protected Mineral Revenue Market Share by Region (2019-2025)
Table 46. Global Rumen Protected Mineral Production (K MT), Revenue (US$ Million), Price (USD/MT) and Gross Margin (2019-2025)
Table 47. North America Rumen Protected Mineral Production (K MT), Revenue (US$ Million), Price (USD/MT) and Gross Margin (2019-2025)
Table 48. Europe Rumen Protected Mineral Production (K MT), Revenue (US$ Million), Price (USD/MT) and Gross Margin (2019-2025)
Table 49. Japan Rumen Protected Mineral Production (K MT), Revenue (US$ Million), Price (USD/MT) and Gross Margin (2019-2025)
Table 50. China Rumen Protected Mineral Production (K MT), Revenue (US$ Million), Price (USD/MT) and Gross Margin (2019-2025)
Table 51. Novus International Rumen Protected Mineral Basic Information
Table 52. Novus International Rumen Protected Mineral Product Overview
Table 53. Novus International Rumen Protected Mineral Sales (K MT), Revenue (M USD), Price (USD/MT) and Gross Margin (2019-2025)
Table 54. Novus International Business Overview
Table 55. Novus International Rumen Protected Mineral SWOT Analysis
Table 56. Novus International Recent Developments
Table 57. Kemin Rumen Protected Mineral Basic Information
Table 58. Kemin Rumen Protected Mineral Product Overview
Table 59. Kemin Rumen Protected Mineral Sales (K MT), Revenue (M USD), Price (USD/MT) and Gross Margin (2019-2025)
Table 60. Kemin Business Overview
Table 61. Kemin Rumen Protected Mineral SWOT Analysis
Table 62. Kemin Recent Developments
Table 63. Provimi Rumen Protected Mineral Basic Information
Table 64. Provimi Rumen Protected Mineral Product Overview
Table 65. Provimi Rumen Protected Mineral Sales (K MT), Revenue (M USD), Price (USD/MT) and Gross Margin (2019-2025)
Table 66. Provimi Rumen Protected Mineral SWOT Analysis
Table 67. Provimi Business Overview
Table 68. Provimi Recent Developments
Table 69. Vitatrace Nutrition Rumen Protected Mineral Basic Information
Table 70. Vitatrace Nutrition Rumen Protected Mineral Product Overview
Table 71. Vitatrace Nutrition Rumen Protected Mineral Sales (K MT), Revenue (M USD), Price (USD/MT) and Gross Margin (2019-2025)
Table 72. Vitatrace Nutrition Business Overview
Table 73. Vitatrace Nutrition Recent Developments
Table 74. Bewital Agri Rumen Protected Mineral Basic Information
Table 75. Bewital Agri Rumen Protected Mineral Product Overview
Table 76. Bewital Agri Rumen Protected Mineral Sales (K MT), Revenue (M USD), Price (USD/MT) and Gross Margin (2019-2025)
Table 77. Bewital Agri Business Overview
Table 78. Bewital Agri Recent Developments
Table 79. Vetagro Rumen Protected Mineral Basic Information
Table 80. Vetagro Rumen Protected Mineral Product Overview
Table 81. Vetagro Rumen Protected Mineral Sales (K MT), Revenue (M USD), Price (USD/MT) and Gross Margin (2019-2025)
Table 82. Vetagro Business Overview
Table 83. Vetagro Recent Developments
Table 84. Shiraishi Group Rumen Protected Mineral Basic Information
Table 85. Shiraishi Group Rumen Protected Mineral Product Overview
Table 86. Shiraishi Group Rumen Protected Mineral Sales (K MT), Revenue (M USD), Price (USD/MT) and Gross Margin (2019-2025)
Table 87. Shiraishi Group Business Overview
Table 88. Shiraishi Group Recent Developments
Table 89. Maxx Performance Rumen Protected Mineral Basic Information
Table 90. Maxx Performance Rumen Protected Mineral Product Overview
Table 91. Maxx Performance Rumen Protected Mineral Sales (K MT), Revenue (M USD), Price (USD/MT) and Gross Margin (2019-2025)
Table 92. Maxx Performance Business Overview
Table 93. Maxx Performance Recent Developments
Table 94. King Techina Group Rumen Protected Mineral Basic Information
Table 95. King Techina Group Rumen Protected Mineral Product Overview
Table 96. King Techina Group Rumen Protected Mineral Sales (K MT), Revenue (M USD), Price (USD/MT) and Gross Margin (2019-2025)
Table 97. King Techina Group Business Overview
Table 98. King Techina Group Recent Developments
Table 99. Rio Nutrition Rumen Protected Mineral Basic Information
Table 100. Rio Nutrition Rumen Protected Mineral Product Overview
Table 101. Rio Nutrition Rumen Protected Mineral Sales (K MT), Revenue (M USD), Price (USD/MT) and Gross Margin (2019-2025)
Table 102. Rio Nutrition Business Overview
Table 103. Rio Nutrition Recent Developments
Table 104. Feedworks Rumen Protected Mineral Basic Information
Table 105. Feedworks Rumen Protected Mineral Product Overview
Table 106. Feedworks Rumen Protected Mineral Sales (K MT), Revenue (M USD), Price (USD/MT) and Gross Margin (2019-2025)
Table 107. Feedworks Business Overview
Table 108. Feedworks Recent Developments
Table 109. Specialist Nutrition Rumen Protected Mineral Basic Information
Table 110. Specialist Nutrition Rumen Protected Mineral Product Overview
Table 111. Specialist Nutrition Rumen Protected Mineral Sales (K MT), Revenue (M USD), Price (USD/MT) and Gross Margin (2019-2025)
Table 112. Specialist Nutrition Business Overview
Table 113. Specialist Nutrition Recent Developments
Table 114. Global Rumen Protected Mineral Sales Forecast by Region (2025-2032) & (K MT)
Table 115. Global Rumen Protected Mineral Market Size Forecast by Region (2025-2032) & (M USD)
Table 116. North America Rumen Protected Mineral Sales Forecast by Country (2025-2032) & (K MT)
Table 117. North America Rumen Protected Mineral Market Size Forecast by Country (2025-2032) & (M USD)
Table 118. Europe Rumen Protected Mineral Sales Forecast by Country (2025-2032) & (K MT)
Table 119. Europe Rumen Protected Mineral Market Size Forecast by Country (2025-2032) & (M USD)
Table 120. Asia Pacific Rumen Protected Mineral Sales Forecast by Region (2025-2032) & (K MT)
Table 121. Asia Pacific Rumen Protected Mineral Market Size Forecast by Region (2025-2032) & (M USD)
Table 122. South America Rumen Protected Mineral Sales Forecast by Country (2025-2032) & (K MT)
Table 123. South America Rumen Protected Mineral Market Size Forecast by Country (2025-2032) & (M USD)
Table 124. Middle East and Africa Rumen Protected Mineral Consumption Forecast by Country (2025-2032) & (Units)
Table 125. Middle East and Africa Rumen Protected Mineral Market Size Forecast by Country (2025-2032) & (M USD)
Table 126. Global Rumen Protected Mineral Sales Forecast by Type (2025-2032) & (K MT)
Table 127. Global Rumen Protected Mineral Market Size Forecast by Type (2025-2032) & (M USD)
Table 128. Global Rumen Protected Mineral Price Forecast by Type (2025-2032) & (USD/MT)
Table 129. Global Rumen Protected Mineral Sales (K MT) Forecast by Application (2025-2032)
Table 130. Global Rumen Protected Mineral Market Size Forecast by Application (2025-2032) & (M USD)
List of Figures
Figure 1. Product Picture of Rumen Protected Mineral
Figure 2. Data Triangulation
Figure 3. Key Caveats
Figure 4. Global Rumen Protected Mineral Market Size (M USD), 2019-2032
Figure 5. Global Rumen Protected Mineral Market Size (M USD) (2019-2032)
Figure 6. Global Rumen Protected Mineral Sales (K MT) & (2019-2032)
Figure 7. Evaluation Matrix of Segment Market Development Potential (Type)
Figure 8. Evaluation Matrix of Segment Market Development Potential (Application)
Figure 9. Evaluation Matrix of Regional Market Development Potential
Figure 10. Rumen Protected Mineral Market Size by Country (M USD)
Figure 11. Rumen Protected Mineral Sales Share by Manufacturers in 2023
Figure 12. Global Rumen Protected Mineral Revenue Share by Manufacturers in 2023
Figure 13. Rumen Protected Mineral Market Share by Company Type (Tier 1, Tier 2 and Tier 3): 2023
Figure 14. Global Market Rumen Protected Mineral Average Price (USD/MT) of Key Manufacturers in 2023
Figure 15. The Global 5 and 10 Largest Players: Market Share by Rumen Protected Mineral Revenue in 2023
Figure 16. Evaluation Matrix of Segment Market Development Potential (Type)
Figure 17. Global Rumen Protected Mineral Market Share by Type
Figure 18. Sales Market Share of Rumen Protected Mineral by Type (2019-2025)
Figure 19. Sales Market Share of Rumen Protected Mineral by Type in 2023
Figure 20. Market Size Share of Rumen Protected Mineral by Type (2019-2025)
Figure 21. Market Size Market Share of Rumen Protected Mineral by Type in 2023
Figure 22. Evaluation Matrix of Segment Market Development Potential (Application)
Figure 23. Global Rumen Protected Mineral Market Share by Application
Figure 24. Global Rumen Protected Mineral Sales Market Share by Application (2019-2025)
Figure 25. Global Rumen Protected Mineral Sales Market Share by Application in 2023
Figure 26. Global Rumen Protected Mineral Market Share by Application (2019-2025)
Figure 27. Global Rumen Protected Mineral Market Share by Application in 2023
Figure 28. Global Rumen Protected Mineral Sales Growth Rate by Application (2019-2025)
Figure 29. Global Rumen Protected Mineral Sales Market Share by Region (2019-2025)
Figure 30. North America Rumen Protected Mineral Sales and Growth Rate (2019-2025) & (K MT)
Figure 31. North America Rumen Protected Mineral Sales Market Share by Country in 2023
Figure 32. U.S. Rumen Protected Mineral Sales and Growth Rate (2019-2025) & (K MT)
Figure 33. Canada Rumen Protected Mineral Sales (K MT) and Growth Rate (2019-2025)
Figure 34. Mexico Rumen Protected Mineral Sales (Units) and Growth Rate (2019-2025)
Figure 35. Europe Rumen Protected Mineral Sales and Growth Rate (2019-2025) & (K MT)
Figure 36. Europe Rumen Protected Mineral Sales Market Share by Country in 2023
Figure 37. Germany Rumen Protected Mineral Sales and Growth Rate (2019-2025) & (K MT)
Figure 38. France Rumen Protected Mineral Sales and Growth Rate (2019-2025) & (K MT)
Figure 39. U.K. Rumen Protected Mineral Sales and Growth Rate (2019-2025) & (K MT)
Figure 40. Italy Rumen Protected Mineral Sales and Growth Rate (2019-2025) & (K MT)
Figure 41. Russia Rumen Protected Mineral Sales and Growth Rate (2019-2025) & (K MT)
Figure 42. Asia Pacific Rumen Protected Mineral Sales and Growth Rate (K MT)
Figure 43. Asia Pacific Rumen Protected Mineral Sales Market Share by Region in 2023
Figure 44. China Rumen Protected Mineral Sales and Growth Rate (2019-2025) & (K MT)
Figure 45. Japan Rumen Protected Mineral Sales and Growth Rate (2019-2025) & (K MT)
Figure 46. South Korea Rumen Protected Mineral Sales and Growth Rate (2019-2025) & (K MT)
Figure 47. India Rumen Protected Mineral Sales and Growth Rate (2019-2025) & (K MT)
Figure 48. Southeast Asia Rumen Protected Mineral Sales and Growth Rate (2019-2025) & (K MT)
Figure 49. South America Rumen Protected Mineral Sales and Growth Rate (K MT)
Figure 50. South America Rumen Protected Mineral Sales Market Share by Country in 2023
Figure 51. Brazil Rumen Protected Mineral Sales and Growth Rate (2019-2025) & (K MT)
Figure 52. Argentina Rumen Protected Mineral Sales and Growth Rate (2019-2025) & (K MT)
Figure 53. Columbia Rumen Protected Mineral Sales and Growth Rate (2019-2025) & (K MT)
Figure 54. Middle East and Africa Rumen Protected Mineral Sales and Growth Rate (K MT)
Figure 55. Middle East and Africa Rumen Protected Mineral Sales Market Share by Region in 2023
Figure 56. Saudi Arabia Rumen Protected Mineral Sales and Growth Rate (2019-2025) & (K MT)
Figure 57. UAE Rumen Protected Mineral Sales and Growth Rate (2019-2025) & (K MT)
Figure 58. Egypt Rumen Protected Mineral Sales and Growth Rate (2019-2025) & (K MT)
Figure 59. Nigeria Rumen Protected Mineral Sales and Growth Rate (2019-2025) & (K MT)
Figure 60. South Africa Rumen Protected Mineral Sales and Growth Rate (2019-2025) & (K MT)
Figure 61. Global Rumen Protected Mineral Production Market Share by Region (2019-2025)
Figure 62. North America Rumen Protected Mineral Production (K MT) Growth Rate (2019-2025)
Figure 63. Europe Rumen Protected Mineral Production (K MT) Growth Rate (2019-2025)
Figure 64. Japan Rumen Protected Mineral Production (K MT) Growth Rate (2019-2025)
Figure 65. China Rumen Protected Mineral Production (K MT) Growth Rate (2019-2025)
Figure 66. Global Rumen Protected Mineral Sales Forecast by Volume (2019-2032) & (K MT)
Figure 67. Global Rumen Protected Mineral Market Size Forecast by Value (2019-2032) & (M USD)
Figure 68. Global Rumen Protected Mineral Sales Market Share Forecast by Type (2025-2032)
Figure 69. Global Rumen Protected Mineral Market Share Forecast by Type (2025-2032)
Figure 70. Global Rumen Protected Mineral Sales Forecast by Application (2025-2032)
Figure 71. Global Rumen Protected Mineral Market Share Forecast by Application (2025-2032)

