Zirconium-Vanadium-Iron Alloy is a specialized metallic material that combines the properties of zirconium, vanadium, and iron. This alloy is known for its high strength, excellent corrosion resistance, and superior heat resistance. These properties make it a preferred material for high-performance applications in industries such as nuclear energy, chemical processing, aerospace, and advanced manufacturing.
Market Size
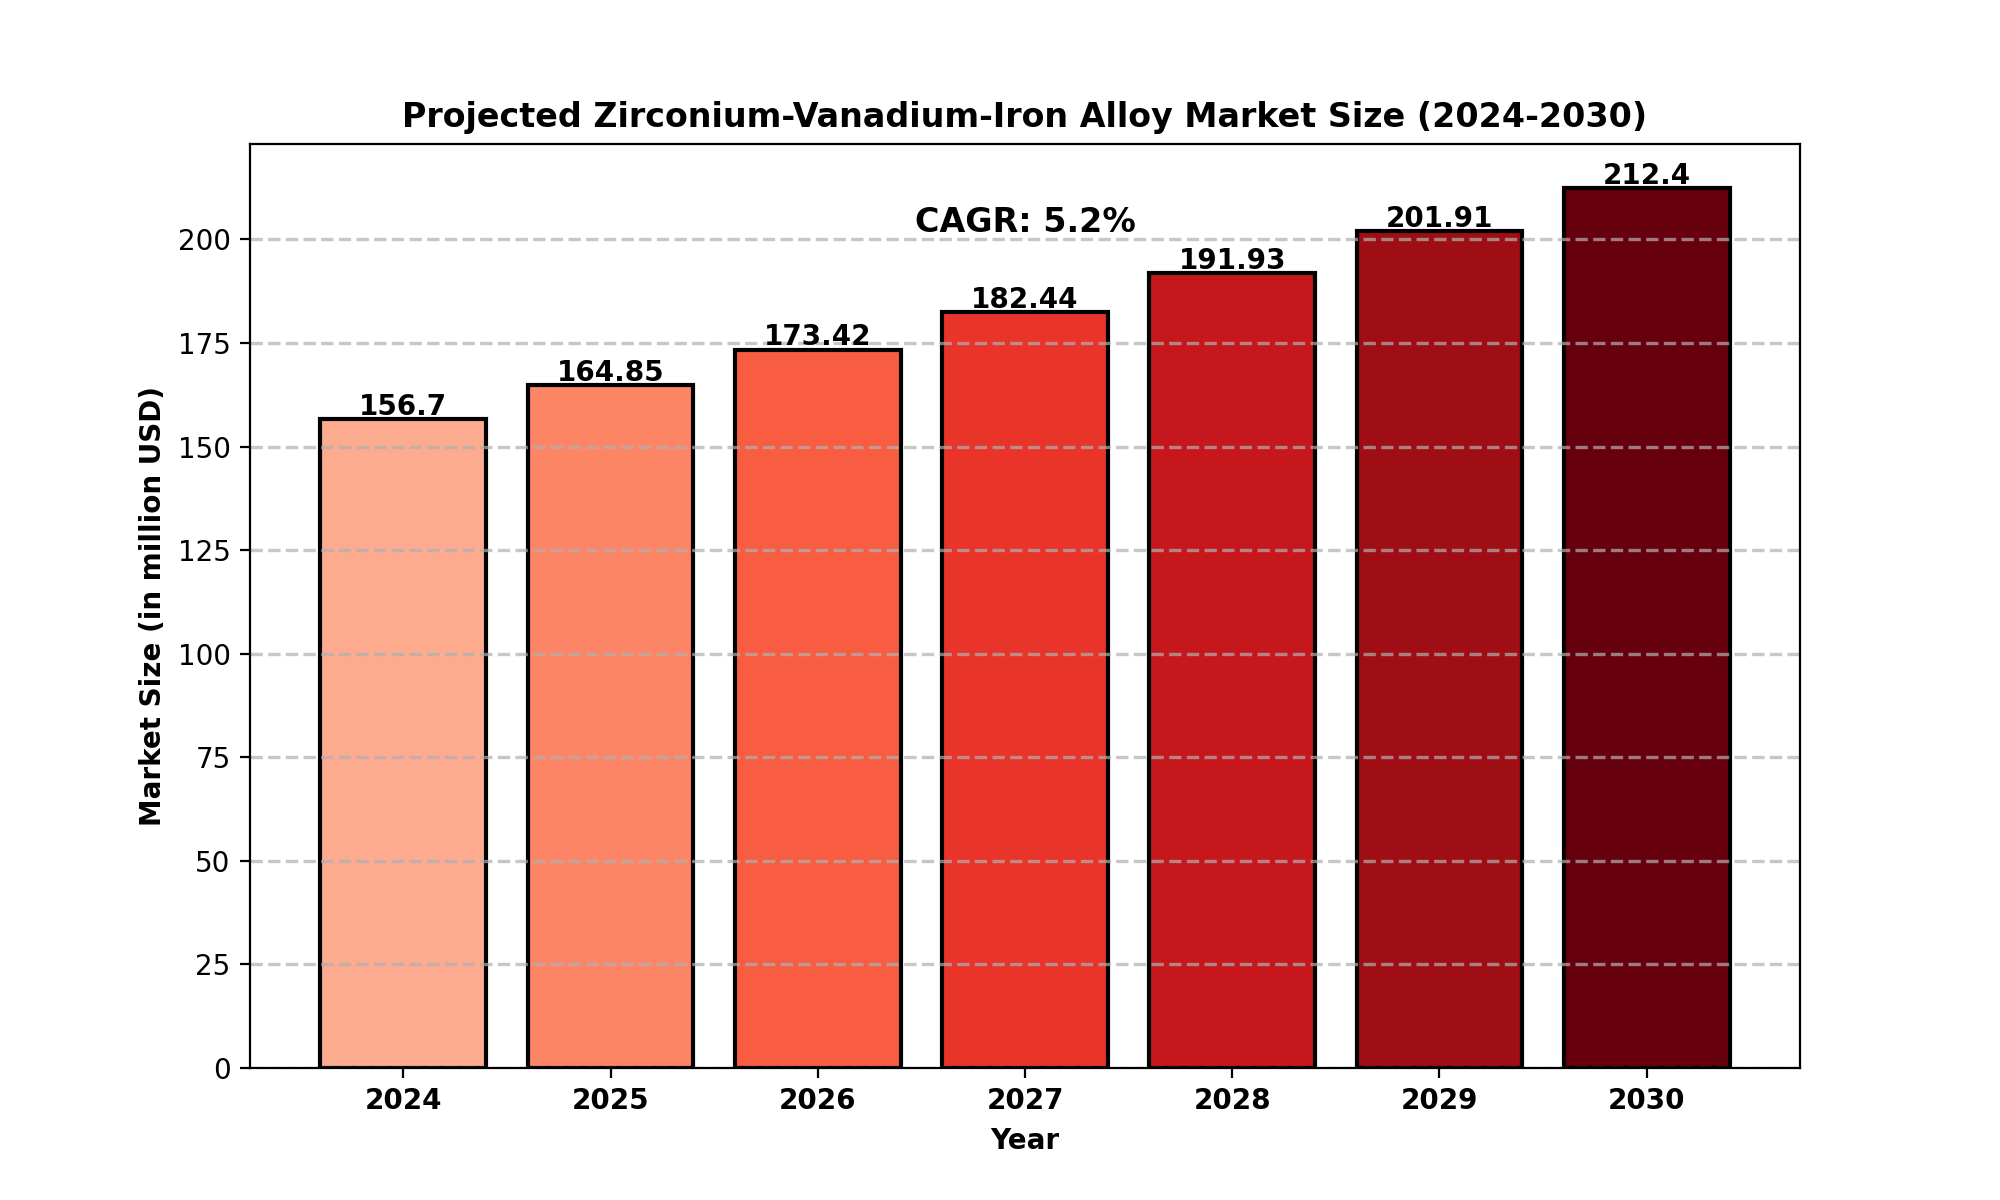
The global Zirconium-Vanadium-Iron Alloy market was valued at US$ 156.7 million in 2024 and is expected to reach US$ 212.4 million by 2030, growing at a CAGR of 5.2% during the forecast period.
The United States market was valued at US$ 42.3 million in 2024 and is projected to reach US$ 55.6 million by 2030, with a CAGR of 4.7%.
In 2023, total global production of the alloy reached 3,200 metric tons, with Asia-Pacific and North America accounting for 70% of global demand. The nuclear energy sector dominates consumption, holding a 45% market share, followed by chemical processing at 30%.
Market Dynamics (Drivers, Restraints, Opportunities, and Challenges)
Drivers
-
Increasing Demand in the Nuclear Energy Sector: The alloy's high resistance to radiation and heat makes it a preferred material for nuclear reactors.
-
Growing Applications in Chemical Processing: The alloy's corrosion resistance drives its adoption in reactors and storage vessels for harsh chemical environments.
-
Rising Use in Aerospace and High-Performance Engineering: Lightweight and high-strength properties support growth in aerospace applications.
-
Advancements in Metallurgical Techniques: Innovations in powder metallurgy and heat treatment improve the material’s properties, expanding its application scope.
Restraints
-
High Manufacturing Costs: The complex production process increases costs, limiting adoption in cost-sensitive applications.
-
Competition from Alternative Alloys: Nickel-based superalloys are gaining market share in some applications, posing a competitive threat.
-
Raw Material Price Fluctuations: Prices of zirconium and vanadium are volatile, affecting production costs.
Opportunities
-
Expansion of Advanced Nuclear Reactors: Increased R&D in nuclear energy is creating new applications for the alloy.
-
Growing Investment in Hydrogen Storage Technologies: The alloy is finding new applications in hydrogen storage and getter materials.
-
Development of High-Purity Alloy Variants: Increasing demand for high-performance materials in cutting-edge industries offers a growth avenue.
Challenges
-
Environmental Regulations on Metal Extraction: Stricter regulations on zirconium and vanadium mining could impact supply chains.
-
Technical Barriers in Large-Scale Production: Achieving consistent material properties at scale remains a challenge.
Regional Analysis
North America
Europe
-
Increasing use in chemical processing and hydrogen storage technologies.
-
Germany, the UK, and France are major consumers.
Asia-Pacific
South America & MEA
-
Growing investments in industrial processing and alternative energy storage.
-
Limited local production, with reliance on imports.
Competitor Analysis
Key players in the market include:
-
Treibacher
-
Getter Technologies International Inc.
-
Jinzhou Haixin Metal Material
-
Stanford Advanced Materials
These companies focus on product innovation, supply chain optimization, and strategic partnerships to strengthen their market position.
Market Segmentation (by Application)
-
Hydrogen Storage
-
Hydrogen Getter
-
Battery Alloys
Market Segmentation (by Type)
-
Diameter 4mm
-
Diameter 6mm
-
Diameter 10mm
Geographic Segmentation
-
North America (USA, Canada, Mexico)
-
Europe (Germany, UK, France, Russia, Italy, Rest of Europe)
-
Asia-Pacific (China, Japan, South Korea, India, Southeast Asia, Rest of Asia-Pacific)
-
South America (Brazil, Argentina, Columbia, Rest of South America)
-
The Middle East and Africa (Saudi Arabia, UAE, Egypt, Nigeria, South Africa, Rest of MEA)
FAQ Section
What is the current market size of the Zirconium-Vanadium-Iron Alloy industry?
- The global market was valued at US$ 156.7 million in 2024 and is expected to reach US$ 212.4 million by 2030, growing at a CAGR of 5.2%.
Which are the key companies operating in the market?
- Major players include Treibacher, Getter Technologies International Inc., Jinzhou Haixin Metal Material, and Stanford Advanced Materials.
What are the key growth drivers in the market?
- Growth is driven by increasing demand in nuclear energy, chemical processing, aerospace, and hydrogen storage industries.
Which regions dominate the market?
- Asia-Pacific and North America lead in market demand, accounting for 70% of global consumption.
What are the emerging trends in the Zirconium-Vanadium-Iron Alloy market?
Emerging trends include:
-
R&D in specialized alloy compositions for nuclear reactors.
-
Advancements in powder metallurgy techniques.
-
Increased adoption in hydrogen storage and getter applications.
Key Benefits of This Market Research:
- Industry drivers, restraints, and opportunities covered in the study
- Neutral perspective on the market performance
- Recent industry trends and developments
- Competitive landscape & strategies of key players
- Potential & niche segments and regions exhibiting promising growth covered
- Historical, current, and projected market size, in terms of value
- In-depth analysis of the Zirconium-Vanadium-Iron Alloy Market
- Overview of the regional outlook of the Zirconium-Vanadium-Iron Alloy Market:
Key Reasons to Buy this Report:
- Access to date statistics compiled by our researchers. These provide you with historical and forecast data, which is analyzed to tell you why your market is set to change
- This enables you to anticipate market changes to remain ahead of your competitors
- You will be able to copy data from the Excel spreadsheet straight into your marketing plans, business presentations, or other strategic documents
- The concise analysis, clear graph, and table format will enable you to pinpoint the information you require quickly
- Provision of market value (USD Billion) data for each segment and sub-segment
- Indicates the region and segment that is expected to witness the fastest growth as well as to dominate the market
- Analysis by geography highlighting the consumption of the product/service in the region as well as indicating the factors that are affecting the market within each region
- Competitive landscape which incorporates the market ranking of the major players, along with new service/product launches, partnerships, business expansions, and acquisitions in the past five years of companies profiled
- Extensive company profiles comprising of company overview, company insights, product benchmarking, and SWOT analysis for the major market players
- The current as well as the future market outlook of the industry concerning recent developments which involve growth opportunities and drivers as well as challenges and restraints of both emerging as well as developed regions
- Includes in-depth analysis of the market from various perspectives through Porter.
TABLE OF CONTENTS
Table of Contents
1 Research Methodology and Statistical Scope
1.1 Market Definition and Statistical Scope of Zirconium-Vanadium-Iron Alloy
1.2 Key Market Segments
1.2.1 Zirconium-Vanadium-Iron Alloy Segment by Type
1.2.2 Zirconium-Vanadium-Iron Alloy Segment by Application
1.3 Methodology & Sources of Information
1.3.1 Research Methodology
1.3.2 Research Process
1.3.3 Market Breakdown and Data Triangulation
1.3.4 Base Year
1.3.5 Report Assumptions & Caveats
2 Zirconium-Vanadium-Iron Alloy Market Overview
2.1 Global Market Overview
2.1.1 Global Zirconium-Vanadium-Iron Alloy Market Size (M USD) Estimates and Forecasts (2019-2030)
2.1.2 Global Zirconium-Vanadium-Iron Alloy Sales Estimates and Forecasts (2019-2030)
2.2 Market Segment Executive Summary
2.3 Global Market Size by Region
3 Zirconium-Vanadium-Iron Alloy Market Competitive Landscape
3.1 Global Zirconium-Vanadium-Iron Alloy Sales by Manufacturers (2019-2024)
3.2 Global Zirconium-Vanadium-Iron Alloy Revenue Market Share by Manufacturers (2019-2024)
3.3 Zirconium-Vanadium-Iron Alloy Market Share by Company Type (Tier 1, Tier 2, and Tier 3)
3.4 Global Zirconium-Vanadium-Iron Alloy Average Price by Manufacturers (2019-2024)
3.5 Manufacturers Zirconium-Vanadium-Iron Alloy Sales Sites, Area Served, Product Type
3.6 Zirconium-Vanadium-Iron Alloy Market Competitive Situation and Trends
3.6.1 Zirconium-Vanadium-Iron Alloy Market Concentration Rate
3.6.2 Global 5 and 10 Largest Zirconium-Vanadium-Iron Alloy Players Market Share by Revenue
3.6.3 Mergers & Acquisitions, Expansion
4 Zirconium-Vanadium-Iron Alloy Industry Chain Analysis
4.1 Zirconium-Vanadium-Iron Alloy Industry Chain Analysis
4.2 Market Overview of Key Raw Materials
4.3 Midstream Market Analysis
4.4 Downstream Customer Analysis
5 The Development and Dynamics of Zirconium-Vanadium-Iron Alloy Market
5.1 Key Development Trends
5.2 Driving Factors
5.3 Market Challenges
5.4 Market Restraints
5.5 Industry News
5.5.1 New Product Developments
5.5.2 Mergers & Acquisitions
5.5.3 Expansions
5.5.4 Collaboration/Supply Contracts
5.6 Industry Policies
6 Zirconium-Vanadium-Iron Alloy Market Segmentation by Type
6.1 Evaluation Matrix of Segment Market Development Potential (Type)
6.2 Global Zirconium-Vanadium-Iron Alloy Sales Market Share by Type (2019-2024)
6.3 Global Zirconium-Vanadium-Iron Alloy Market Size Market Share by Type (2019-2024)
6.4 Global Zirconium-Vanadium-Iron Alloy Price by Type (2019-2024)
7 Zirconium-Vanadium-Iron Alloy Market Segmentation by Application
7.1 Evaluation Matrix of Segment Market Development Potential (Application)
7.2 Global Zirconium-Vanadium-Iron Alloy Market Sales by Application (2019-2024)
7.3 Global Zirconium-Vanadium-Iron Alloy Market Size (M USD) by Application (2019-2024)
7.4 Global Zirconium-Vanadium-Iron Alloy Sales Growth Rate by Application (2019-2024)
8 Zirconium-Vanadium-Iron Alloy Market Segmentation by Region
8.1 Global Zirconium-Vanadium-Iron Alloy Sales by Region
8.1.1 Global Zirconium-Vanadium-Iron Alloy Sales by Region
8.1.2 Global Zirconium-Vanadium-Iron Alloy Sales Market Share by Region
8.2 North America
8.2.1 North America Zirconium-Vanadium-Iron Alloy Sales by Country
8.2.2 U.S.
8.2.3 Canada
8.2.4 Mexico
8.3 Europe
8.3.1 Europe Zirconium-Vanadium-Iron Alloy Sales by Country
8.3.2 Germany
8.3.3 France
8.3.4 U.K.
8.3.5 Italy
8.3.6 Russia
8.4 Asia Pacific
8.4.1 Asia Pacific Zirconium-Vanadium-Iron Alloy Sales by Region
8.4.2 China
8.4.3 Japan
8.4.4 South Korea
8.4.5 India
8.4.6 Southeast Asia
8.5 South America
8.5.1 South America Zirconium-Vanadium-Iron Alloy Sales by Country
8.5.2 Brazil
8.5.3 Argentina
8.5.4 Columbia
8.6 Middle East and Africa
8.6.1 Middle East and Africa Zirconium-Vanadium-Iron Alloy Sales by Region
8.6.2 Saudi Arabia
8.6.3 UAE
8.6.4 Egypt
8.6.5 Nigeria
8.6.6 South Africa
9 Key Companies Profile
9.1 Treibacher
9.1.1 Treibacher Zirconium-Vanadium-Iron Alloy Basic Information
9.1.2 Treibacher Zirconium-Vanadium-Iron Alloy Product Overview
9.1.3 Treibacher Zirconium-Vanadium-Iron Alloy Product Market Performance
9.1.4 Treibacher Business Overview
9.1.5 Treibacher Zirconium-Vanadium-Iron Alloy SWOT Analysis
9.1.6 Treibacher Recent Developments
9.2 Getter Technologies International Inc
9.2.1 Getter Technologies International Inc Zirconium-Vanadium-Iron Alloy Basic Information
9.2.2 Getter Technologies International Inc Zirconium-Vanadium-Iron Alloy Product Overview
9.2.3 Getter Technologies International Inc Zirconium-Vanadium-Iron Alloy Product Market Performance
9.2.4 Getter Technologies International Inc Business Overview
9.2.5 Getter Technologies International Inc Zirconium-Vanadium-Iron Alloy SWOT Analysis
9.2.6 Getter Technologies International Inc Recent Developments
9.3 Jinzhou Haixin Metal Material
9.3.1 Jinzhou Haixin Metal Material Zirconium-Vanadium-Iron Alloy Basic Information
9.3.2 Jinzhou Haixin Metal Material Zirconium-Vanadium-Iron Alloy Product Overview
9.3.3 Jinzhou Haixin Metal Material Zirconium-Vanadium-Iron Alloy Product Market Performance
9.3.4 Jinzhou Haixin Metal Material Zirconium-Vanadium-Iron Alloy SWOT Analysis
9.3.5 Jinzhou Haixin Metal Material Business Overview
9.3.6 Jinzhou Haixin Metal Material Recent Developments
9.4 Stanford Advanced Materials
9.4.1 Stanford Advanced Materials Zirconium-Vanadium-Iron Alloy Basic Information
9.4.2 Stanford Advanced Materials Zirconium-Vanadium-Iron Alloy Product Overview
9.4.3 Stanford Advanced Materials Zirconium-Vanadium-Iron Alloy Product Market Performance
9.4.4 Stanford Advanced Materials Business Overview
9.4.5 Stanford Advanced Materials Recent Developments
10 Zirconium-Vanadium-Iron Alloy Market Forecast by Region
10.1 Global Zirconium-Vanadium-Iron Alloy Market Size Forecast
10.2 Global Zirconium-Vanadium-Iron Alloy Market Forecast by Region
10.2.1 North America Market Size Forecast by Country
10.2.2 Europe Zirconium-Vanadium-Iron Alloy Market Size Forecast by Country
10.2.3 Asia Pacific Zirconium-Vanadium-Iron Alloy Market Size Forecast by Region
10.2.4 South America Zirconium-Vanadium-Iron Alloy Market Size Forecast by Country
10.2.5 Middle East and Africa Forecasted Consumption of Zirconium-Vanadium-Iron Alloy by Country
11 Forecast Market by Type and by Application (2025-2030)
11.1 Global Zirconium-Vanadium-Iron Alloy Market Forecast by Type (2025-2030)
11.1.1 Global Forecasted Sales of Zirconium-Vanadium-Iron Alloy by Type (2025-2030)
11.1.2 Global Zirconium-Vanadium-Iron Alloy Market Size Forecast by Type (2025-2030)
11.1.3 Global Forecasted Price of Zirconium-Vanadium-Iron Alloy by Type (2025-2030)
11.2 Global Zirconium-Vanadium-Iron Alloy Market Forecast by Application (2025-2030)
11.2.1 Global Zirconium-Vanadium-Iron Alloy Sales (Kilotons) Forecast by Application
11.2.2 Global Zirconium-Vanadium-Iron Alloy Market Size (M USD) Forecast by Application (2025-2030)
12 Conclusion and Key Findings
LIST OF TABLES & FIGURES
List of Tables
Table 1. Introduction of the Type
Table 2. Introduction of the Application
Table 3. Market Size (M USD) Segment Executive Summary
Table 4. Zirconium-Vanadium-Iron Alloy Market Size Comparison by Region (M USD)
Table 5. Global Zirconium-Vanadium-Iron Alloy Sales (Kilotons) by Manufacturers (2019-2024)
Table 6. Global Zirconium-Vanadium-Iron Alloy Sales Market Share by Manufacturers (2019-2024)
Table 7. Global Zirconium-Vanadium-Iron Alloy Revenue (M USD) by Manufacturers (2019-2024)
Table 8. Global Zirconium-Vanadium-Iron Alloy Revenue Share by Manufacturers (2019-2024)
Table 9. Company Type (Tier 1, Tier 2, and Tier 3) & (based on the Revenue in Zirconium-Vanadium-Iron Alloy as of 2022)
Table 10. Global Market Zirconium-Vanadium-Iron Alloy Average Price (USD/Ton) of Key Manufacturers (2019-2024)
Table 11. Manufacturers Zirconium-Vanadium-Iron Alloy Sales Sites and Area Served
Table 12. Manufacturers Zirconium-Vanadium-Iron Alloy Product Type
Table 13. Global Zirconium-Vanadium-Iron Alloy Manufacturers Market Concentration Ratio (CR5 and HHI)
Table 14. Mergers & Acquisitions, Expansion Plans
Table 15. Industry Chain Map of Zirconium-Vanadium-Iron Alloy
Table 16. Market Overview of Key Raw Materials
Table 17. Midstream Market Analysis
Table 18. Downstream Customer Analysis
Table 19. Key Development Trends
Table 20. Driving Factors
Table 21. Zirconium-Vanadium-Iron Alloy Market Challenges
Table 22. Global Zirconium-Vanadium-Iron Alloy Sales by Type (Kilotons)
Table 23. Global Zirconium-Vanadium-Iron Alloy Market Size by Type (M USD)
Table 24. Global Zirconium-Vanadium-Iron Alloy Sales (Kilotons) by Type (2019-2024)
Table 25. Global Zirconium-Vanadium-Iron Alloy Sales Market Share by Type (2019-2024)
Table 26. Global Zirconium-Vanadium-Iron Alloy Market Size (M USD) by Type (2019-2024)
Table 27. Global Zirconium-Vanadium-Iron Alloy Market Size Share by Type (2019-2024)
Table 28. Global Zirconium-Vanadium-Iron Alloy Price (USD/Ton) by Type (2019-2024)
Table 29. Global Zirconium-Vanadium-Iron Alloy Sales (Kilotons) by Application
Table 30. Global Zirconium-Vanadium-Iron Alloy Market Size by Application
Table 31. Global Zirconium-Vanadium-Iron Alloy Sales by Application (2019-2024) & (Kilotons)
Table 32. Global Zirconium-Vanadium-Iron Alloy Sales Market Share by Application (2019-2024)
Table 33. Global Zirconium-Vanadium-Iron Alloy Sales by Application (2019-2024) & (M USD)
Table 34. Global Zirconium-Vanadium-Iron Alloy Market Share by Application (2019-2024)
Table 35. Global Zirconium-Vanadium-Iron Alloy Sales Growth Rate by Application (2019-2024)
Table 36. Global Zirconium-Vanadium-Iron Alloy Sales by Region (2019-2024) & (Kilotons)
Table 37. Global Zirconium-Vanadium-Iron Alloy Sales Market Share by Region (2019-2024)
Table 38. North America Zirconium-Vanadium-Iron Alloy Sales by Country (2019-2024) & (Kilotons)
Table 39. Europe Zirconium-Vanadium-Iron Alloy Sales by Country (2019-2024) & (Kilotons)
Table 40. Asia Pacific Zirconium-Vanadium-Iron Alloy Sales by Region (2019-2024) & (Kilotons)
Table 41. South America Zirconium-Vanadium-Iron Alloy Sales by Country (2019-2024) & (Kilotons)
Table 42. Middle East and Africa Zirconium-Vanadium-Iron Alloy Sales by Region (2019-2024) & (Kilotons)
Table 43. Treibacher Zirconium-Vanadium-Iron Alloy Basic Information
Table 44. Treibacher Zirconium-Vanadium-Iron Alloy Product Overview
Table 45. Treibacher Zirconium-Vanadium-Iron Alloy Sales (Kilotons), Revenue (M USD), Price (USD/Ton) and Gross Margin (2019-2024)
Table 46. Treibacher Business Overview
Table 47. Treibacher Zirconium-Vanadium-Iron Alloy SWOT Analysis
Table 48. Treibacher Recent Developments
Table 49. Getter Technologies International Inc Zirconium-Vanadium-Iron Alloy Basic Information
Table 50. Getter Technologies International Inc Zirconium-Vanadium-Iron Alloy Product Overview
Table 51. Getter Technologies International Inc Zirconium-Vanadium-Iron Alloy Sales (Kilotons), Revenue (M USD), Price (USD/Ton) and Gross Margin (2019-2024)
Table 52. Getter Technologies International Inc Business Overview
Table 53. Getter Technologies International Inc Zirconium-Vanadium-Iron Alloy SWOT Analysis
Table 54. Getter Technologies International Inc Recent Developments
Table 55. Jinzhou Haixin Metal Material Zirconium-Vanadium-Iron Alloy Basic Information
Table 56. Jinzhou Haixin Metal Material Zirconium-Vanadium-Iron Alloy Product Overview
Table 57. Jinzhou Haixin Metal Material Zirconium-Vanadium-Iron Alloy Sales (Kilotons), Revenue (M USD), Price (USD/Ton) and Gross Margin (2019-2024)
Table 58. Jinzhou Haixin Metal Material Zirconium-Vanadium-Iron Alloy SWOT Analysis
Table 59. Jinzhou Haixin Metal Material Business Overview
Table 60. Jinzhou Haixin Metal Material Recent Developments
Table 61. Stanford Advanced Materials Zirconium-Vanadium-Iron Alloy Basic Information
Table 62. Stanford Advanced Materials Zirconium-Vanadium-Iron Alloy Product Overview
Table 63. Stanford Advanced Materials Zirconium-Vanadium-Iron Alloy Sales (Kilotons), Revenue (M USD), Price (USD/Ton) and Gross Margin (2019-2024)
Table 64. Stanford Advanced Materials Business Overview
Table 65. Stanford Advanced Materials Recent Developments
Table 66. Global Zirconium-Vanadium-Iron Alloy Sales Forecast by Region (2025-2030) & (Kilotons)
Table 67. Global Zirconium-Vanadium-Iron Alloy Market Size Forecast by Region (2025-2030) & (M USD)
Table 68. North America Zirconium-Vanadium-Iron Alloy Sales Forecast by Country (2025-2030) & (Kilotons)
Table 69. North America Zirconium-Vanadium-Iron Alloy Market Size Forecast by Country (2025-2030) & (M USD)
Table 70. Europe Zirconium-Vanadium-Iron Alloy Sales Forecast by Country (2025-2030) & (Kilotons)
Table 71. Europe Zirconium-Vanadium-Iron Alloy Market Size Forecast by Country (2025-2030) & (M USD)
Table 72. Asia Pacific Zirconium-Vanadium-Iron Alloy Sales Forecast by Region (2025-2030) & (Kilotons)
Table 73. Asia Pacific Zirconium-Vanadium-Iron Alloy Market Size Forecast by Region (2025-2030) & (M USD)
Table 74. South America Zirconium-Vanadium-Iron Alloy Sales Forecast by Country (2025-2030) & (Kilotons)
Table 75. South America Zirconium-Vanadium-Iron Alloy Market Size Forecast by Country (2025-2030) & (M USD)
Table 76. Middle East and Africa Zirconium-Vanadium-Iron Alloy Consumption Forecast by Country (2025-2030) & (Units)
Table 77. Middle East and Africa Zirconium-Vanadium-Iron Alloy Market Size Forecast by Country (2025-2030) & (M USD)
Table 78. Global Zirconium-Vanadium-Iron Alloy Sales Forecast by Type (2025-2030) & (Kilotons)
Table 79. Global Zirconium-Vanadium-Iron Alloy Market Size Forecast by Type (2025-2030) & (M USD)
Table 80. Global Zirconium-Vanadium-Iron Alloy Price Forecast by Type (2025-2030) & (USD/Ton)
Table 81. Global Zirconium-Vanadium-Iron Alloy Sales (Kilotons) Forecast by Application (2025-2030)
Table 82. Global Zirconium-Vanadium-Iron Alloy Market Size Forecast by Application (2025-2030) & (M USD)
List of Figures
Figure 1. Product Picture of Zirconium-Vanadium-Iron Alloy
Figure 2. Data Triangulation
Figure 3. Key Caveats
Figure 4. Global Zirconium-Vanadium-Iron Alloy Market Size (M USD), 2019-2030
Figure 5. Global Zirconium-Vanadium-Iron Alloy Market Size (M USD) (2019-2030)
Figure 6. Global Zirconium-Vanadium-Iron Alloy Sales (Kilotons) & (2019-2030)
Figure 7. Evaluation Matrix of Segment Market Development Potential (Type)
Figure 8. Evaluation Matrix of Segment Market Development Potential (Application)
Figure 9. Evaluation Matrix of Regional Market Development Potential
Figure 10. Zirconium-Vanadium-Iron Alloy Market Size by Country (M USD)
Figure 11. Zirconium-Vanadium-Iron Alloy Sales Share by Manufacturers in 2023
Figure 12. Global Zirconium-Vanadium-Iron Alloy Revenue Share by Manufacturers in 2023
Figure 13. Zirconium-Vanadium-Iron Alloy Market Share by Company Type (Tier 1, Tier 2 and Tier 3): 2023
Figure 14. Global Market Zirconium-Vanadium-Iron Alloy Average Price (USD/Ton) of Key Manufacturers in 2023
Figure 15. The Global 5 and 10 Largest Players: Market Share by Zirconium-Vanadium-Iron Alloy Revenue in 2023
Figure 16. Evaluation Matrix of Segment Market Development Potential (Type)
Figure 17. Global Zirconium-Vanadium-Iron Alloy Market Share by Type
Figure 18. Sales Market Share of Zirconium-Vanadium-Iron Alloy by Type (2019-2024)
Figure 19. Sales Market Share of Zirconium-Vanadium-Iron Alloy by Type in 2023
Figure 20. Market Size Share of Zirconium-Vanadium-Iron Alloy by Type (2019-2024)
Figure 21. Market Size Market Share of Zirconium-Vanadium-Iron Alloy by Type in 2023
Figure 22. Evaluation Matrix of Segment Market Development Potential (Application)
Figure 23. Global Zirconium-Vanadium-Iron Alloy Market Share by Application
Figure 24. Global Zirconium-Vanadium-Iron Alloy Sales Market Share by Application (2019-2024)
Figure 25. Global Zirconium-Vanadium-Iron Alloy Sales Market Share by Application in 2023
Figure 26. Global Zirconium-Vanadium-Iron Alloy Market Share by Application (2019-2024)
Figure 27. Global Zirconium-Vanadium-Iron Alloy Market Share by Application in 2023
Figure 28. Global Zirconium-Vanadium-Iron Alloy Sales Growth Rate by Application (2019-2024)
Figure 29. Global Zirconium-Vanadium-Iron Alloy Sales Market Share by Region (2019-2024)
Figure 30. North America Zirconium-Vanadium-Iron Alloy Sales and Growth Rate (2019-2024) & (Kilotons)
Figure 31. North America Zirconium-Vanadium-Iron Alloy Sales Market Share by Country in 2023
Figure 32. U.S. Zirconium-Vanadium-Iron Alloy Sales and Growth Rate (2019-2024) & (Kilotons)
Figure 33. Canada Zirconium-Vanadium-Iron Alloy Sales (Kilotons) and Growth Rate (2019-2024)
Figure 34. Mexico Zirconium-Vanadium-Iron Alloy Sales (Units) and Growth Rate (2019-2024)
Figure 35. Europe Zirconium-Vanadium-Iron Alloy Sales and Growth Rate (2019-2024) & (Kilotons)
Figure 36. Europe Zirconium-Vanadium-Iron Alloy Sales Market Share by Country in 2023
Figure 37. Germany Zirconium-Vanadium-Iron Alloy Sales and Growth Rate (2019-2024) & (Kilotons)
Figure 38. France Zirconium-Vanadium-Iron Alloy Sales and Growth Rate (2019-2024) & (Kilotons)
Figure 39. U.K. Zirconium-Vanadium-Iron Alloy Sales and Growth Rate (2019-2024) & (Kilotons)
Figure 40. Italy Zirconium-Vanadium-Iron Alloy Sales and Growth Rate (2019-2024) & (Kilotons)
Figure 41. Russia Zirconium-Vanadium-Iron Alloy Sales and Growth Rate (2019-2024) & (Kilotons)
Figure 42. Asia Pacific Zirconium-Vanadium-Iron Alloy Sales and Growth Rate (Kilotons)
Figure 43. Asia Pacific Zirconium-Vanadium-Iron Alloy Sales Market Share by Region in 2023
Figure 44. China Zirconium-Vanadium-Iron Alloy Sales and Growth Rate (2019-2024) & (Kilotons)
Figure 45. Japan Zirconium-Vanadium-Iron Alloy Sales and Growth Rate (2019-2024) & (Kilotons)
Figure 46. South Korea Zirconium-Vanadium-Iron Alloy Sales and Growth Rate (2019-2024) & (Kilotons)
Figure 47. India Zirconium-Vanadium-Iron Alloy Sales and Growth Rate (2019-2024) & (Kilotons)
Figure 48. Southeast Asia Zirconium-Vanadium-Iron Alloy Sales and Growth Rate (2019-2024) & (Kilotons)
Figure 49. South America Zirconium-Vanadium-Iron Alloy Sales and Growth Rate (Kilotons)
Figure 50. South America Zirconium-Vanadium-Iron Alloy Sales Market Share by Country in 2023
Figure 51. Brazil Zirconium-Vanadium-Iron Alloy Sales and Growth Rate (2019-2024) & (Kilotons)
Figure 52. Argentina Zirconium-Vanadium-Iron Alloy Sales and Growth Rate (2019-2024) & (Kilotons)
Figure 53. Columbia Zirconium-Vanadium-Iron Alloy Sales and Growth Rate (2019-2024) & (Kilotons)
Figure 54. Middle East and Africa Zirconium-Vanadium-Iron Alloy Sales and Growth Rate (Kilotons)
Figure 55. Middle East and Africa Zirconium-Vanadium-Iron Alloy Sales Market Share by Region in 2023
Figure 56. Saudi Arabia Zirconium-Vanadium-Iron Alloy Sales and Growth Rate (2019-2024) & (Kilotons)
Figure 57. UAE Zirconium-Vanadium-Iron Alloy Sales and Growth Rate (2019-2024) & (Kilotons)
Figure 58. Egypt Zirconium-Vanadium-Iron Alloy Sales and Growth Rate (2019-2024) & (Kilotons)
Figure 59. Nigeria Zirconium-Vanadium-Iron Alloy Sales and Growth Rate (2019-2024) & (Kilotons)
Figure 60. South Africa Zirconium-Vanadium-Iron Alloy Sales and Growth Rate (2019-2024) & (Kilotons)
Figure 61. Global Zirconium-Vanadium-Iron Alloy Sales Forecast by Volume (2019-2030) & (Kilotons)
Figure 62. Global Zirconium-Vanadium-Iron Alloy Market Size Forecast by Value (2019-2030) & (M USD)
Figure 63. Global Zirconium-Vanadium-Iron Alloy Sales Market Share Forecast by Type (2025-2030)
Figure 64. Global Zirconium-Vanadium-Iron Alloy Market Share Forecast by Type (2025-2030)
Figure 65. Global Zirconium-Vanadium-Iron Alloy Sales Forecast by Application (2025-2030)
Figure 66. Global Zirconium-Vanadium-Iron Alloy Market Share Forecast by Application (2025-2030)
")
