TOP CATEGORY: Chemicals & Materials | Life Sciences | Banking & Finance | ICT Media

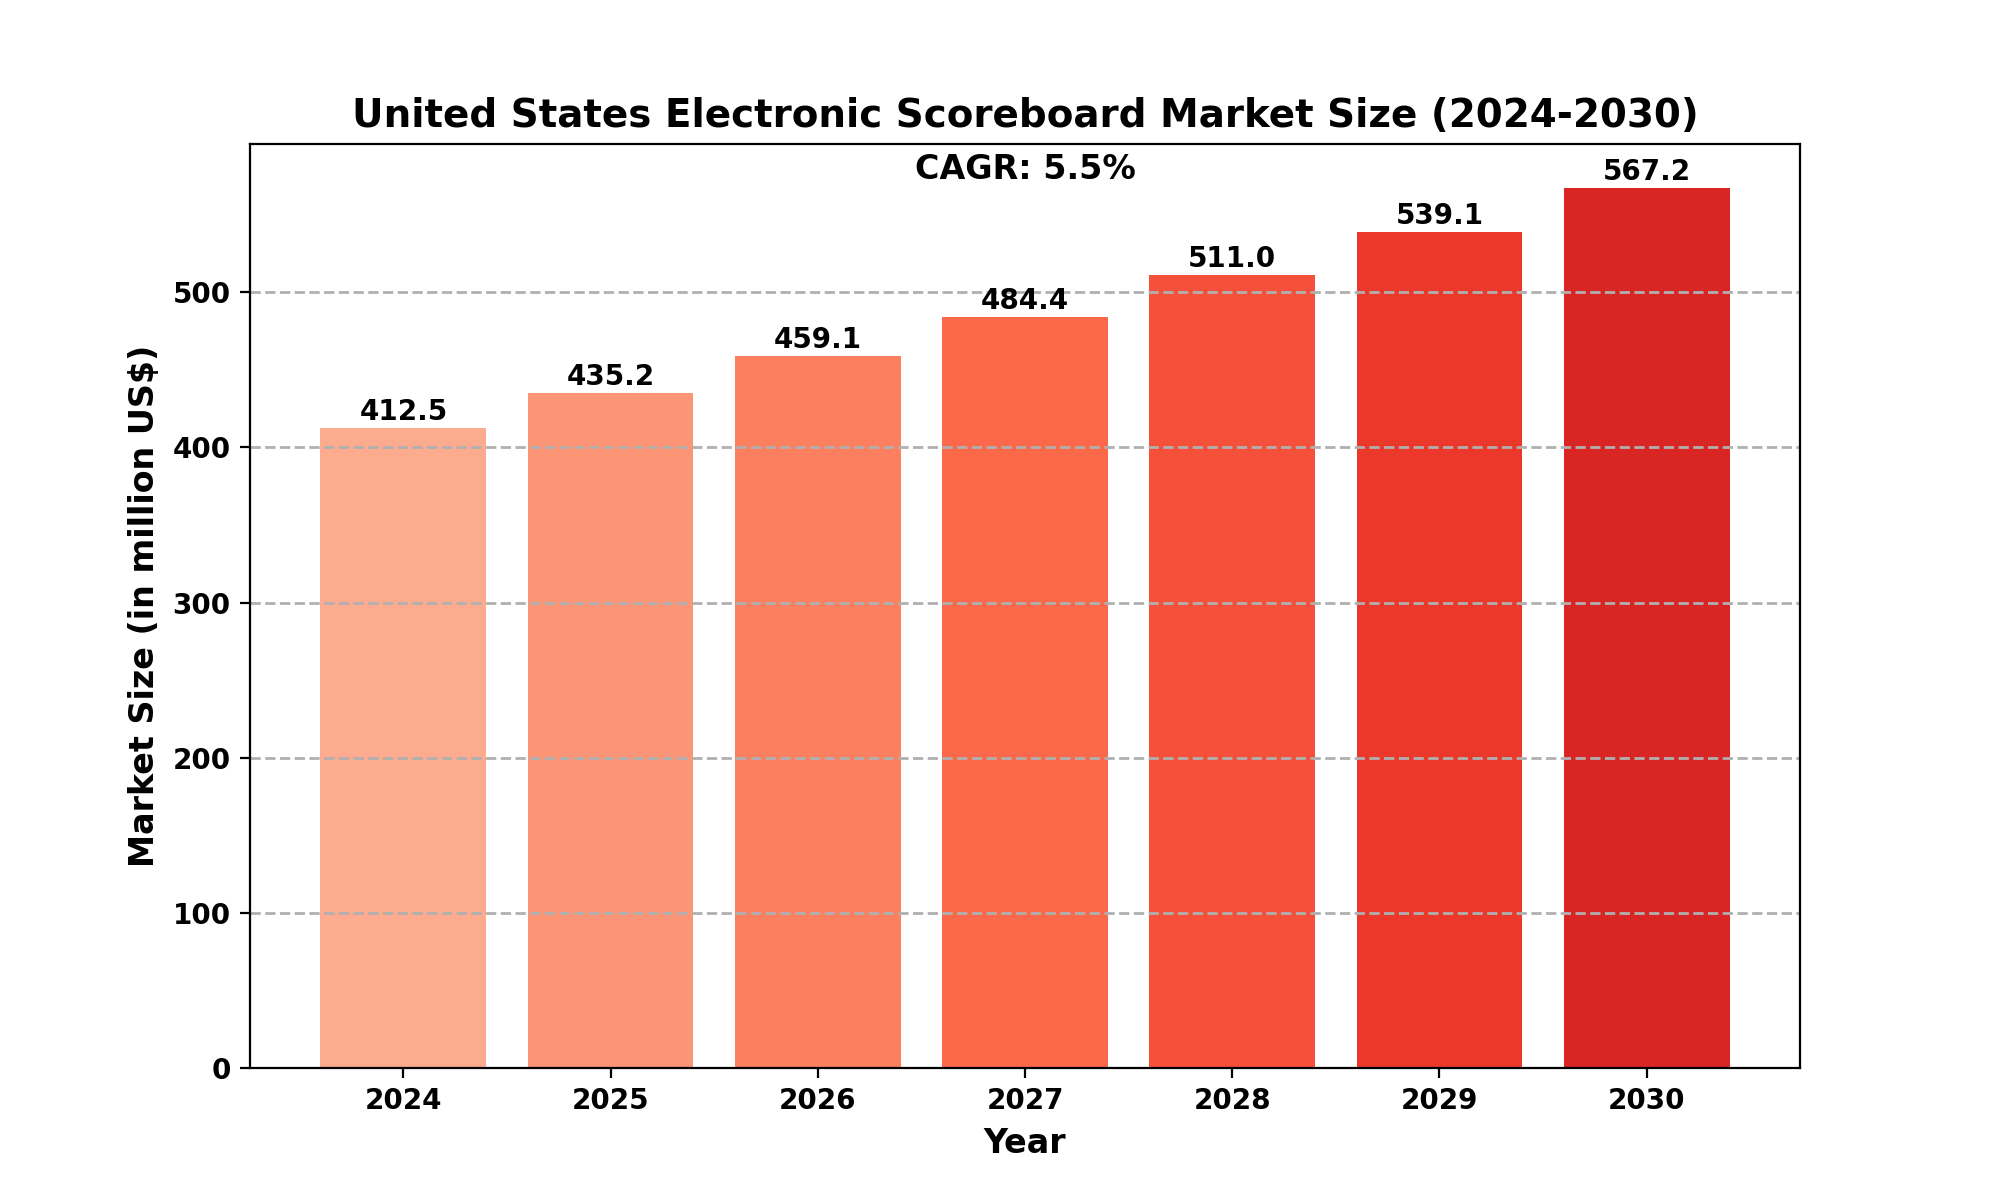
United States Electronic Scoreboard Market size was valued at US$ 412.5 million in 2024 and is projected to reach US$ 567.2 million by 2030, at a CAGR of 5.5% during the forecast period 2024-2030.
Digital displays used in sports venues and events to show real-time scores, statistics, and other relevant information to spectators and participants.
The U.S. Electronic Scoreboard market is growing steadily, supported by ongoing renovations and upgrades in sports facilities across the country and the increasing digitalization of sports experiences. The U.S. sports technology market, valued at $12.8 billion in 2023, drives innovation in sports infrastructure and fan engagement tools. Key trends include the development of high-resolution LED scoreboards with enhanced visibility, integration of social media feeds and interactive elements, and the rise of portable, battery-powered scoreboards for amateur and youth sports. The market faces challenges from the high initial investment costs for large-scale installations and the need for regular technology updates. Opportunities lie in creating multi-sport adaptable scoreboards for versatile use in school and community facilities, and developing eco-friendly, energy-efficient scoreboard solutions. With over 30,000 high schools and 1,100 colleges in the U.S. participating in organized sports, there's a substantial market for scoreboard installations and upgrades. The market benefits from the growing emphasis on enhancing fan experiences, with 65% of U.S. sports venues investing in digital infrastructure improvements in 2023 to boost engagement and attendance.
This report contains market size and forecasts of Electronic Scoreboard in United States, including the following market information:
• United States Electronic Scoreboard Market Revenue, 2019-2024, 2024-2030, ($ millions)
• United States Electronic Scoreboard Market Sales, 2019-2024, 2024-2030,
• United States Top five Electronic Scoreboard companies in 2023 (%)
Report Includes
This report presents an overview of United States market for Electronic Scoreboard , sales, revenue and price. Analyses of the United States market trends, with historic market revenue/sales data for 2019 - 2023, estimates for 2024, and projections of CAGR through 2030.
This report focuses on the Electronic Scoreboard sales, revenue, market share and industry ranking of main manufacturers, data from 2019 to 2024. Identification of the major stakeholders in the United States Electronic Scoreboard market, and analysis of their competitive landscape and market positioning based on recent developments and segmental revenues.
This report will help stakeholders to understand the competitive landscape and gain more insights and position their businesses and market strategies in a better way.
This report analyzes the segments data by Type, and by Sales Channels, sales, revenue, and price, from 2019 to 2030. Evaluation and forecast the market size for Humidifier sales, projected growth trends, production technology, sales channels and end-user industry.
Key Companies covered in this report:
The report also provides analysis of leading market participants including:
• Key companies Electronic Scoreboard revenues in United Statesn market, 2019-2024 (Estimated), ($ millions)
• Key companies Electronic Scoreboard revenues share in United Statesn market, 2023 (%)
• Key companies Electronic Scoreboard sales in United Statesn market, 2019-2024 (Estimated),
• Key companies Electronic Scoreboard sales share in United Statesn market, 2023 (%)
Key Indicators Analysed
• Market Players & Competitor Analysis: The report covers the key players of the industry including Company Profile, Product Specifications, Production Capacity/Sales, Revenue, Price and Gross Margin 2019-2030 & Sales with a thorough analysis of the market’s competitive landscape and detailed information on vendors and comprehensive details of factors that will challenge the growth of major market vendors.
• United Statesn Market Analysis: The report includes United Statesn market status and outlook 2019-2030. Further the report provides break down details about each region & countries covered in the report. Identifying its sales, sales volume & revenue forecast. With detailed analysis by types and applications.
• Market Trends: Market key trends which include Increased Competition and Continuous Innovations.
• Opportunities and Drivers: Identifying the Growing Demands and New Technology
• Porters Five Force Analysis: The report provides with the state of competition in industry depending on five basic forces: threat of new entrants, bargaining power of suppliers, bargaining power of buyers, threat of substitute products or services, and existing industry rivalry.
Key Benefits of This Market Research:
• Industry drivers, restraints, and opportunities covered in the study
• Neutral perspective on the market performance
• Recent industry trends and developments
• Competitive landscape & strategies of key players
• Potential & niche segments and regions exhibiting promising growth covered
• Historical, current, and projected market size, in terms of value
• In-depth analysis of the Electronic Scoreboard Market
• Overview of the regional outlook of the Electronic Scoreboard Market
Key Reasons to Buy this Report:
• Access to date statistics compiled by our researchers. These provide you with historical and forecast data, which is analyzed to tell you why your market is set to change
• This enables you to anticipate market changes to remain ahead of your competitors
• You will be able to copy data from the Excel spreadsheet straight into your marketing plans, business presentations or other strategic documents
• The concise analysis, clear graph, and table format will enable you to pinpoint the information you require quickly
• Provision of market value (USD Billion) data for each segment and sub-segment
• Indicates the region and segment that is expected to witness the fastest growth as well as to dominate the market
• Analysis by geography highlighting the consumption of the product/service in the region as well as indicating the factors that are affecting the market within each region
• Competitive landscape which incorporates the market ranking of the major players, along with new service/product launches, partnerships, business expansions, and acquisitions in the past five years of companies profiled
• Extensive company profiles comprising of company overview, company insights, product benchmarking, and SWOT analysis for the major market players
• The current as well as the future market outlook of the industry concerning recent developments which involve growth opportunities and drivers as well as challenges and restraints of both emerging as well as developed regions
• Includes in-depth analysis of the market from various perspectives through Porter’s five forces analysis
• Provides insight into the market through Value Chain
• Market dynamics scenario, along with growth opportunities of the market in the years to come
• 6-month post-sales analyst support
We offer additional regional and global reports that are similar:
• Global Electronic Scoreboard Market
• United States Electronic Scoreboard Market
• Japan Electronic Scoreboard Market
• Germany Electronic Scoreboard Market
• South Korea Electronic Scoreboard Market
• Indonesia Electronic Scoreboard Market
• Brazil Electronic Scoreboard Market
Customization of the Report: In case of any queries or customization requirements, please connect with our sales team, who will ensure that your requirements are meet.
1.1 Electronic Scoreboard Product Introduction
1.2.1 United Statesn Electronic Scoreboard Market Size Growth Rate by Type, 2019 VS 2023 VS 2030
1.2.2 Wall-mounted Type
1.2.3 Desktop Type
1.3.1 United States Electronic Scoreboard Market Size Growth Rate by Application, 2019 VS 2023 VS 2030
1.3.2 Stadium
1.3.3 Training Center
1.3.4 Competition
1.3.5 Others
1.4 United States Electronic Scoreboard Sales Estimates and Forecasts 2019-2030
1.5 United States Electronic Scoreboard Hydrocephalus Shunts Revenue Estimates and Forecasts 2019-2030
1.6 Study Objectives
1.7 Years Considered
2.1 United States Electronic Scoreboard Sales by Manufacturers
2.1.1 United States Electronic Scoreboard Sales by Manufacturers (2019-2024)
2.1.2 United States Electronic Scoreboard Sales Market Share by Manufacturers (2019-2024)
2.1.3 Top Largest Manufacturers of Electronic Scoreboard in 2023 in United States
2.2 United States Electronic Scoreboard Revenue by Manufacturers
2.2.1 United States Electronic Scoreboard Revenue by Manufacturers (2019-2024)
2.2.2 United States Electronic Scoreboard Revenue Market Share by Manufacturers (2019-2024)
2.2.3 United States Top Companies by Electronic Scoreboard Revenue in 2023
2.3 United States Electronic Scoreboard Sales Price by Manufacturers (2019-2024)
2.4 Analysis of Competitive Landscape
2.4.1 Manufacturers Market Concentration Ratio (CR3 and HHI)
2.4.2 United States Electronic Scoreboard by Company Type (Tier 1, Tier 2, and Tier 3)
2.4.3 United States Electronic Scoreboard Manufacturers Geographical Distribution
2.5 Mergers & Acquisitions, Expansion Plans
3.1 Electronic Scoreboard Market Size by Region: 2019-2030
3.1.1 United States Electronic Scoreboard Sales by Region: 2019-2024
3.1.2 United States Electronic Scoreboard Sales Forecast by Region (2025-2030)
3.1.3 United States Electronic Scoreboard Revenue by Region: 2019-2024
3.1.4 United States Electronic Scoreboard Revenue Forecast by Region (2025-2030)
4.1 United States Electronic Scoreboard Sales by Type
4.1.1 United States Electronic Scoreboard Historical Sales by Type (2019-2024)
4.1.2 United States Electronic Scoreboard Forecasted Sales by Type (2025-2030)
4.1.3 United States Electronic Scoreboard Sales Market Share by Type (2019-2030)
4.2 United States Electronic Scoreboard Revenue by Type
4.2.1 United States Electronic Scoreboard Historical Revenue by Type (2019-2024)
4.2.2 United States Electronic Scoreboard Forecasted Revenue by Type (2025-2030)
4.2.3 United States Electronic Scoreboard Revenue Market Share by Type (2019-2030)
4.3 United States Electronic Scoreboard Price by Type
4.3.1 United States Electronic Scoreboard Price by Type (2019-2024)
4.3.2 United States Electronic Scoreboard Price Forecast by Type (2025-2030)
5.1 United States Electronic Scoreboard Sales by Application
5.1.1 United States Electronic Scoreboard Historical Sales by Application (2019-2024)
5.1.2 United States Electronic Scoreboard Forecasted Sales by Application (2025-2030)
5.1.3 United States Electronic Scoreboard Sales Market Share by Application (2019-2030)
5.2 United States Electronic Scoreboard Revenue by Application
5.2.1 United States Electronic Scoreboard Historical Revenue by Application (2019-2024)
5.2.2 United States Electronic Scoreboard Forecasted Revenue by Application (2025-2030)
5.2.3 United States Electronic Scoreboard Revenue Market Share by Application (2019-2030)
5.3 United States Electronic Scoreboard Price by Application
5.3.1 United States Electronic Scoreboard Price by Application (2019-2024)
5.3.2 United States Electronic Scoreboard Price Forecast by Application (2025-2030)
6.1 Daktronics
6.1.1 Daktronics Corporation Information
6.1.2 Daktronics Overview
6.1.3 Daktronics in United States: Electronic Scoreboard Sales, Price, Revenue and Gross Margin (2019-2024)
6.1.4 Daktronics Electronic Scoreboard Product Introduction
6.1.5 Daktronics Recent Developments
6.2 Nevco, Inc.
6.2.1 Nevco, Inc. Corporation Information
6.2.2 Nevco, Inc. Overview
6.2.3 Nevco, Inc. in United States: Electronic Scoreboard Sales, Price, Revenue and Gross Margin (2019-2024)
6.2.4 Nevco, Inc. Electronic Scoreboard Product Introduction
6.2.5 Nevco, Inc. Recent Developments
6.3 Fair-Play Scoreboards
6.3.1 Fair-Play Scoreboards Corporation Information
6.3.2 Fair-Play Scoreboards Overview
6.3.3 Fair-Play Scoreboards in United States: Electronic Scoreboard Sales, Price, Revenue and Gross Margin (2019-2024)
6.3.4 Fair-Play Scoreboards Electronic Scoreboard Product Introduction
6.3.5 Fair-Play Scoreboards Recent Developments
6.4 Colorado Time Systems
6.4.1 Colorado Time Systems Corporation Information
6.4.2 Colorado Time Systems Overview
6.4.3 Colorado Time Systems in United States: Electronic Scoreboard Sales, Price, Revenue and Gross Margin (2019-2024)
6.4.4 Colorado Time Systems Electronic Scoreboard Product Introduction
6.4.5 Colorado Time Systems Recent Developments
6.5 Electro-Mech Scoreboard Co.
6.5.1 Electro-Mech Scoreboard Co. Corporation Information
6.5.2 Electro-Mech Scoreboard Co. Overview
6.5.3 Electro-Mech Scoreboard Co. in United States: Electronic Scoreboard Sales, Price, Revenue and Gross Margin (2019-2024)
6.5.4 Electro-Mech Scoreboard Co. Electronic Scoreboard Product Introduction
6.5.5 Electro-Mech Scoreboard Co. Recent Developments
6.6 Varsity Scoreboards
6.6.1 Varsity Scoreboards Corporation Information
6.6.2 Varsity Scoreboards Overview
6.6.3 Varsity Scoreboards in United States: Electronic Scoreboard Sales, Price, Revenue and Gross Margin (2019-2024)
6.6.4 Varsity Scoreboards Electronic Scoreboard Product Introduction
6.6.5 Varsity Scoreboards Recent Developments
6.7 OES Scoreboards
6.7.1 OES Scoreboards Corporation Information
6.7.2 OES Scoreboards Overview
6.7.3 OES Scoreboards in United States: Electronic Scoreboard Sales, Price, Revenue and Gross Margin (2019-2024)
6.7.4 OES Scoreboards Electronic Scoreboard Product Introduction
6.7.5 OES Scoreboards Recent Developments
6.8 Spectrum Scoreboards
6.8.1 Spectrum Scoreboards Corporation Information
6.8.2 Spectrum Scoreboards Overview
6.8.3 Spectrum Scoreboards in United States: Electronic Scoreboard Sales, Price, Revenue and Gross Margin (2019-2024)
6.8.4 Spectrum Scoreboards Electronic Scoreboard Product Introduction
6.8.5 Spectrum Scoreboards Recent Developments
6.9 All American Scoreboards
6.9.1 All American Scoreboards Corporation Information
6.9.2 All American Scoreboards Overview
6.9.3 All American Scoreboards in United States: Electronic Scoreboard Sales, Price, Revenue and Gross Margin (2019-2024)
6.9.4All American Scoreboards Electronic Scoreboard Product Introduction
6.9.5 All American Scoreboards Recent Developments
6.10 Sportable Scoreboards
6.10.1 Sportable Scoreboards Corporation Information
6.10.2 Sportable Scoreboards Overview
6.10.3 Sportable Scoreboards in United States: Electronic Scoreboard Sales, Price, Revenue and Gross Margin (2019-2024)
6.10.4 Sportable Scoreboards Electronic Scoreboard Product Introduction
6.10.5 Sportable Scoreboards Recent Developments
7.1 Electronic Scoreboard Industry Chain Analysis
7.2 Electronic Scoreboard Key Raw Materials
7.2.1 Key Raw Materials
7.2.2 Raw Materials Key Suppliers
7.3 Electronic Scoreboard Production Mode & Process
7.4 Electronic Scoreboard Sales and Marketing
7.4.1 Electronic Scoreboard Sales Channels
7.4.2 Electronic Scoreboard Distributors
7.5 Electronic Scoreboard Customers
8.1.1 Electronic Scoreboard Industry Trends
8.1.2 Electronic Scoreboard Market Drivers
8.1.3 Electronic Scoreboard Market Challenges
8.1.4 Electronic Scoreboard Market Restraints
10.1 Research Methodology
10.1.1 Methodology/Research Approach
10.1.2 Data Source
10.2 Author Details
10.3 Disclaimer
Frequently Asked Questions ?
